$HFT (HASHFLOW) | Potential 2,000%+ Upside Setup?SET:HFT (HASHFLOW) | Potential 2,000%+ Upside Setup?
HFT/USDT is trading near $0.00687 after a prolonged macro markdown characterized by consecutive Lower Highs, Lower Lows, and bearish BOS.
From an ICT/SMC perspective, price is approaching a potential HTF accumulation zone. However, bullish confirmation remains essential.
🔹 Accumulation Zone: $0.0057–$0.0070
🔹 Bullish Flip: $0.01073
🔹 Targets: $0.01643/$0.03414/$0.09521/$0.29288
A sustained reclaim above $0.01073 could initiate a structura
Hashflow / Tether
No trades
No trades
In-depth trading ideas
Binance Delisting HFT TokenSET:HFT price surged, rally was attributed to Hashflow's August 4 integration with FxWallet, which expanded its RFQ liquidity. Trading volume spiked because it demonstrated active protocol development and can attract momentum traders. However, the high whale concentration (top 100 wallets hold 90.63% of supply) suggest the move was volatile and prone to sharp corrections. Binance announced it will delist Hashflow (HFT) along with five other tokens. All spot trading for HFT will end on August 17
H
HFTUSDT Forming Bullish MomentumHFTUSDT is forming a clear bullish momentum pattern, a classic bullish wave signal that often indicates an upcoming breakout. The price has been consolidating within a narrowing range, suggesting that selling pressure is weakening while buyers are beginning to regain control. With consistent volume confirming accumulation at lower levels, the setup hints at a potential bullish breakout soon. The projected move could lead to an impressive gain of around 40% to 50% once the price breaks above the
HLong
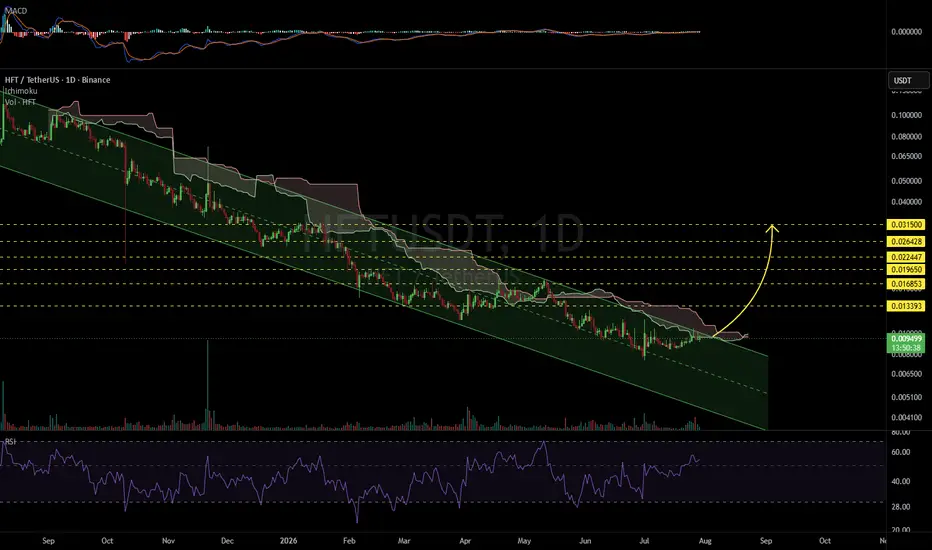
HFTUSDT 1D#HFT is trading within a descending channel on the daily timeframe and is currently testing both the channel resistance and the Ichimoku Cloud. A confirmed breakout above these key resistance levels could trigger a bullish move toward the following upside targets:
🎯 $0.013393
🎯 $0.016853
🎯 $0.019650
🎯 $0.022447
🎯 $0.026428
🎯 $0.031500
⚠️ Always use a tight stop-loss and apply proper risk management.
H
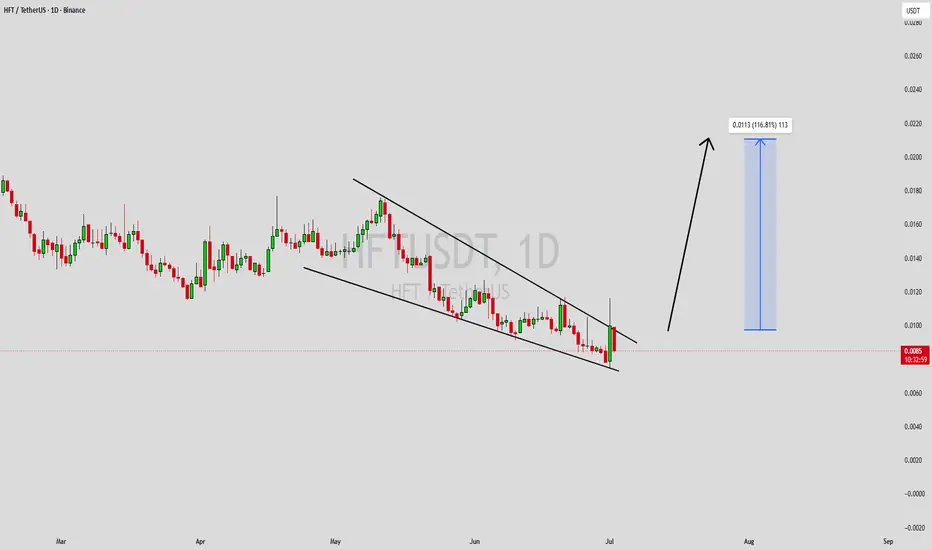
HFTUSDT Forming Falling WedgeHFTUSDT is forming a clear falling wedge pattern, a classic bullish wave signal that often indicates an upcoming breakout. The price has been consolidating within a narrowing range, suggesting that selling pressure is weakening while buyers are beginning to regain control. With consistent volume confirming accumulation at lower levels, the setup hints at a potential bullish breakout soon. The projected move could lead to an impressive gain of around 90% to 100% once the price breaks above the we
HLong
HFT/USDT — Early Reversal or Just a Relief Rally?The HFT/USDT (1D) chart shows a strong downtrend from its previous peak, marked by a consistent pattern of lower highs and lower lows. The descending trendline acts as a key dynamic resistance, continuously pushing the price downward.
Currently, the price is trading in the lower range (around 0.015–0.016), showing signs of consolidation and a potential breakout from the mid-term bearish pressure.
---
📐 Pattern Formation: Descending Triangle / Descending Channel Breakout Attempt
The main pat
HLong
HFTUSDT Forming Falling WedgeHFTUSDT is forming a clear falling wedge pattern, a classic bullish reversal signal that often indicates an upcoming breakout. The price has been consolidating within a narrowing range, suggesting that selling pressure is weakening while buyers are beginning to regain control. With consistent volume confirming accumulation at lower levels, the setup hints at a potential bullish breakout soon. The projected move could lead to an impressive gain of around 140% to 150% once the price breaks above t
HLong
Hashflow: 965% profits potential, an easy targetI can understand the strong reaction when I say 965% is an easy target. It is hard to reconcile under the current market sentiment. It is hard to visualize, accept and adapt to the change that is just weeks away.
Hashflow (HFTUSDT) has huge potential for growth and this can come sooner than expected. When the altcoins start growing, it will be nothing like what you see now.
Hashflow started dropping since it started trading back in November 2022. There was a small rise ending in February 2023
HLong
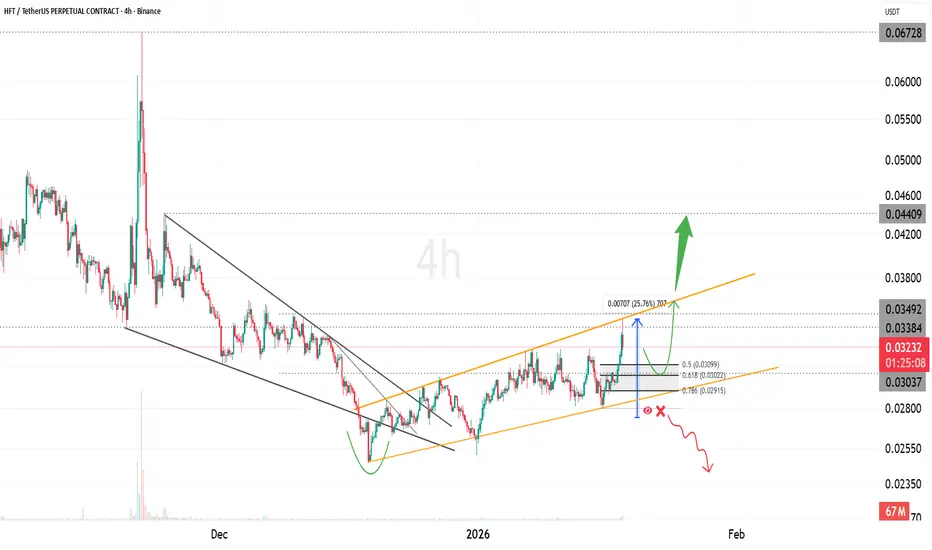
HFT Loading a Ascending Broadening Wedge BreakoutHFT is forming an Ascending Broadening Wedge on the 4H timeframe, indicating rising volatility and expansion in price range.
From the previous analysis, price has already delivered a 25%+ upside move, validating the structure and confirming volatility expansion.
Price continues to print higher highs and higher lows while respecting the lower trendline. As long as structure holds, upside continuation remains valid.
Bullish scenario:
• Hold above ascending support
• Acceptance above 0.0349
• Ex
H
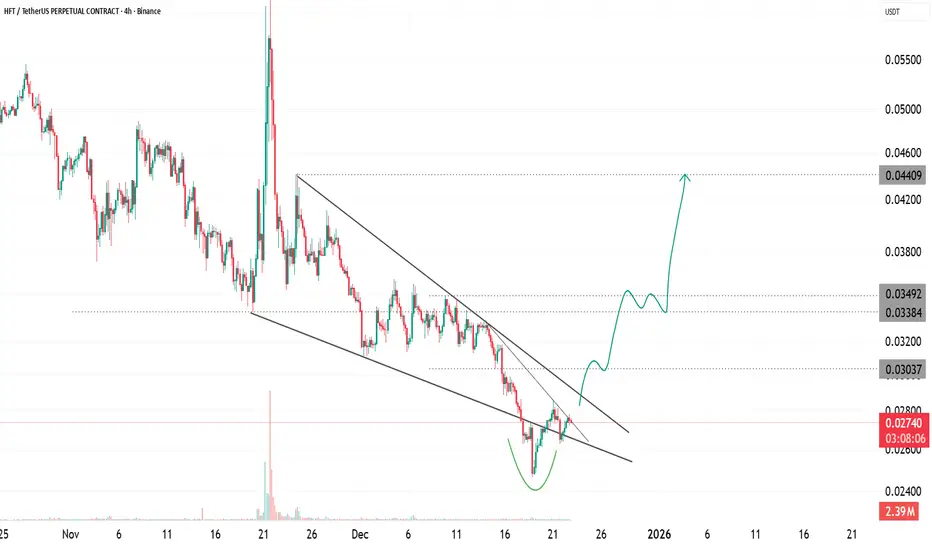
HFT Falling Wedge Signals Potential Trend ReversalHFT has been forming a clear falling wedge after a prolonged bearish phase. Price action shows lower highs and lower lows, but the range is tightening as the wedge converges, indicating weakening bearish momentum rather than strong continuation.
Price recently reacted from the lower boundary of the wedge and is now attempting to reclaim short-term structure. If HFT manages to break and hold above the upper wedge resistance, a relief rally toward the next resistance zones becomes likely. The fir
H
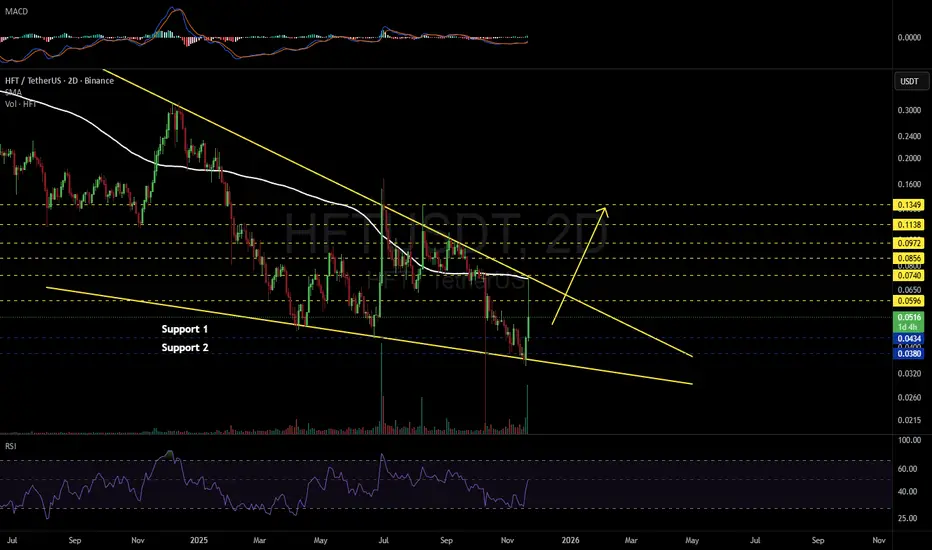
HFTUSDT 2D#HFT is moving inside a falling wedge pattern on the 2-day timeframe. It recently made a sharp upward move, but the rally stalled exactly at the confluence of the wedge resistance and the 2-day SMA100. Price tapped that zone and was immediately rejected, sending it back down. Consider buying a small bag here and near the support levels at
$0.0434 and $0.0380.
In case of a breakout above the wedge, the potential targets are:
🎯 $0.0596
🎯 $0.0740
🎯 $0.0856
🎯 $0.0972
🎯 $0.1138
🎯 $0.1349
⚠️ Always
H
HFTUSDT Forming Falling WedgeHFTUSDT is forming a classic falling wedge pattern on the daily charts, a reliable bullish reversal signal that's capturing the eye of savvy crypto traders as altcoin season heats up in late 2025. This tightening consolidation phase, with lower highs and higher lows converging toward the $0.045 support, points to fading seller exhaustion and stealthy buyer accumulation, setting the stage for a potential explosive breakout above the $0.050 resistance. Trading volume has been robust at over 12 mil
HLong
HFT/USDT - Bullish Reversal Setup 1HAfter a strong breakdown, price has started forming a potential reversal structure on the 1H timeframe.
Currently, HFT is respecting the ascending trendline support and showing early signs of strength.
A clean breakout above the local resistance could confirm bullish continuation toward the marked supply zone.
**Setup Details:**
* **Entry:** Around trendline support (~0.051)
* **Target:** 0.07370
* **Stop-loss:** 0.04350
* **Risk/Reward Ratio:** 1:3+
* **Bias:** Bullish as long as price stays
HLong
HFT: One Last Pump Before the Dumpster?🚨 COINBASE:HFTUSD BINANCE:HFTUSDT — Quick Breakdown 🚨
📉 Structure
Clear bearish trend: lower lows, lower highs. Every time momentum hits overbought, we get another dump. Altseason? Highly unlikely to save this shitcoin.
📊 Price Action
June brought a bounce, but July almost completely erased it. If August closes below its open — expect the downtrend rally to continue.
🌊 Wave Scenario
June’s move looks like a potential impulse, so one more upward leg is possible:
🎯 T1: 0.10
HLong
HFT/USDT — Will Bears Continue, or Will Bulls Take Control?Overview:
HFT has been trapped in a long-term downtrend since 2022, defined by the descending yellow trendline. Price is now consolidating at a critical zone, holding above strong support around 0.0431 (Low) while testing the descending trendline near 0.0969.
This is a make-or-break moment: will it continue the bearish cycle or start a potential accumulation phase for a major reversal?
---
🔎 Pattern & Market Structure
Descending Trendline → pressing the market down with consistent lower highs
HLong
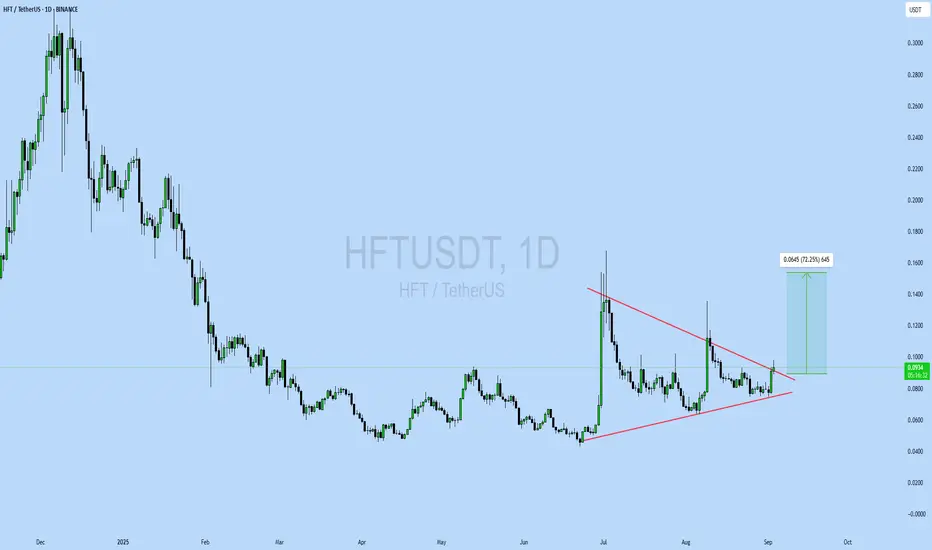
HFTUSDT UPDATE#HFT
UPDATE
HFT Technical Setup
Pattern : Bullish Pennant Pattern
Current Price: $0.0937
Target Price: $0.158
Target % Gain: 72.25%
Technical Analysis: HFT is forming a bullish pennant on the 1D chart with a breakout attempt supported by recent volume. If the price sustains above the $0.09 breakout zone, continuation toward $0.158 is expected.
Time Frame: 1D
Risk Management Tip: Always use proper risk management.
HLong
HFTUSDT Forming Falling WedgeHFTUSDT is showing a promising setup as it forms a falling wedge pattern, a bullish reversal structure that often signals an upcoming breakout. This pattern develops when price action trends lower while narrowing its range, indicating selling pressure is weakening and buyers are preparing to take control. The presence of good trading volume adds strength to this setup, confirming that investors are actively accumulating positions during this consolidation phase.
The technical outlook suggests t
HLong
HFTUSDT | Bullish Momentum Gaining Strength!🚀 Trade Setup Details:
🕯 #HFT/USDT 🔼 Buy | Long 🔼
⌛️ Timeframe: 4H
--------------------
🛡 Risk Management:
🛡 If Your Account Balance: $1000
🛡 If Your Loss-Limit: 1%
🛡 Then Your Signal Margin: $42.64
--------------------
☄️ En1: 0.0928 (Amount: $4.26)
☄️ En2: 0.0848 (Amount: $14.92)
☄️ En3: 0.0796 (Amount: $19.19)
☄️ En4: 0.0747 (Amount: $4.26)
--------------------
☄️ If All Entries Are Activated, Then:
☄️ Average.En: 0.0823 ($42.64)
--------------------
☑️ TP1: 0.1153 (+40.1%) (RR:1.71)
☑️ TP2
HLong
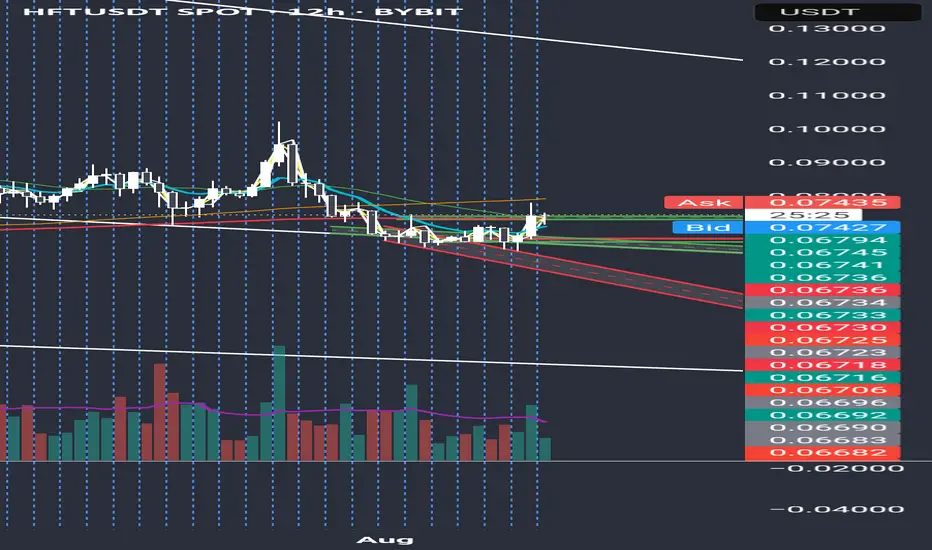
HFT - 100m gem primed for launch?I've been watching HFT for the last week. It's been getting solid bounces off the white descending support following a recent run.
It faked out the support during the recent dip but was able to form a channel below and has now made the first new high on the 12h as the MACD turns positive.
A test of the recent high at 0.163 would be a 100% move from here, but we could see a move much higher.
If we zoom out to the 2D chart we can see we've just formed a bullish hammer (close enough to one I thi
HLong
HFT Buy/Long Setup (1D)After the downward trendline break and the formation of the main CH (Change of Character), we can look for buy/long positions around the key support zones.
A healthy time correction has also formed on the chart, and with price approaching the demand zone, we expect a strong reaction.
The support zone and target levels (TPs) are marked on the chart.
A daily candle close below the invalidation level will invalidate this analysis.
For risk management, please don't forget stop loss and capital m
H
Hashflow Already Hit Bottom, I Can Prove It · 1,300% PPThe bottom is in. I can prove it and you will agree.
Good afternoon my fellow Cryptocurrency trader, how are you feeling in this wonderful day?
Hashflow (HFT) has been dropping since February 2023, a major decline but there is good news, just recently market conditions and price action dynamics started to change. Come April 2025 a downtrend is no more. Instead, when a new low was hit in June the chart ended as a double-bottom rather than a bearish impulse. And this is not all.
After the low i
HLong
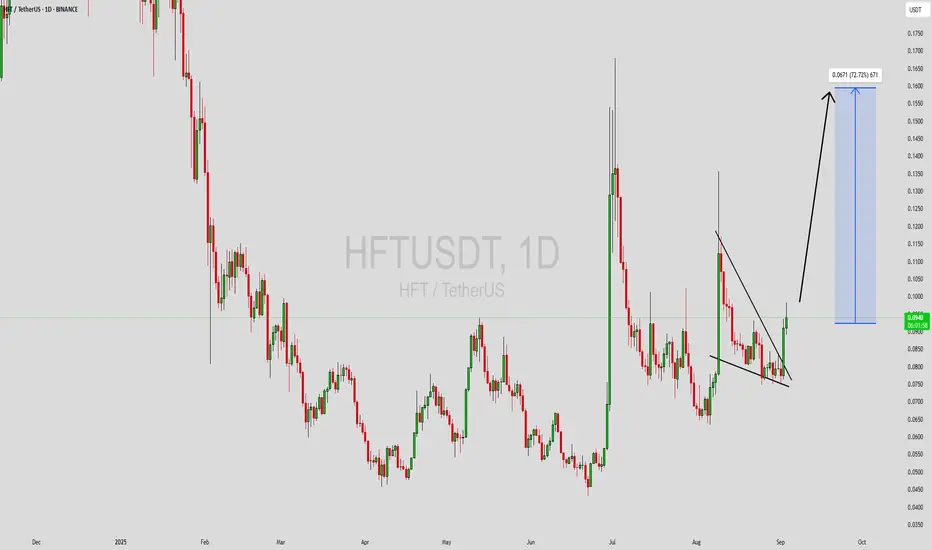
HFTUSDT UPDATE
Pattern: Falling Wedge Breakout
Current Price: \$0.0940
Target Price: \$0.1630
Target % Gain: 85.33%
Technical Analysis: HFT has broken out of a falling wedge on the 8H chart with strong bullish candles. Volume confirms the breakout, and the move above resistance suggests a potential rally toward the 85% target zone.
Time Frame: 8H
HLong
$HFTUSDT Trade Setup 6H.TSX:HFT Trade Setup (6H)
• Entry: CMP
• Stop Loss: $0.0709
• Targets:
T1: $0.0929
T2: $0.1251
Bullish breakout with clean retest.
The setup looks strong if support holds.
DYOR, NFA
HLong
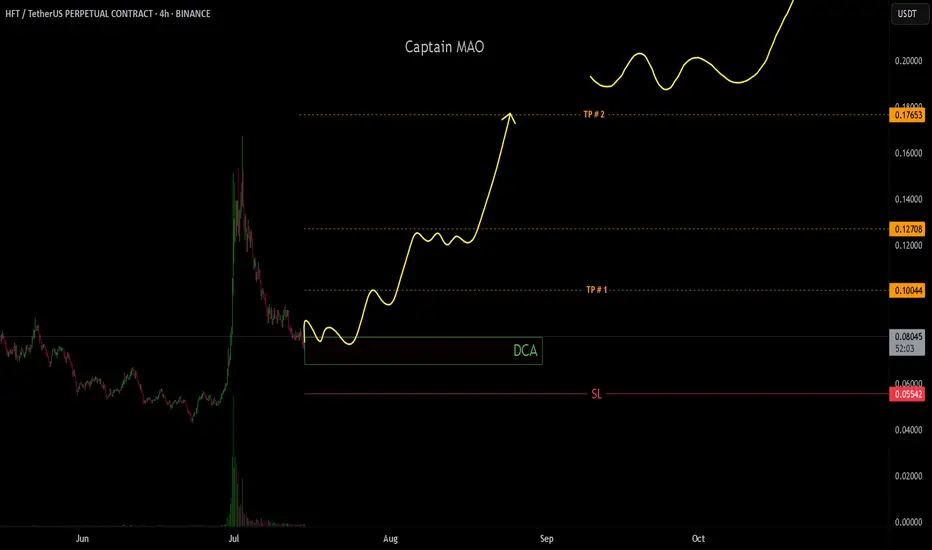
HFT/USDT NEXT LEGIn late June 2025, HFT surged over +250%, backed by strong buying interest and significant volume. Following that explosive move, the price has now corrected around 55%, currently consolidating at a key support/resistance flip zone a level that previously acted as resistance and now shows signs of holding as support.
HLong