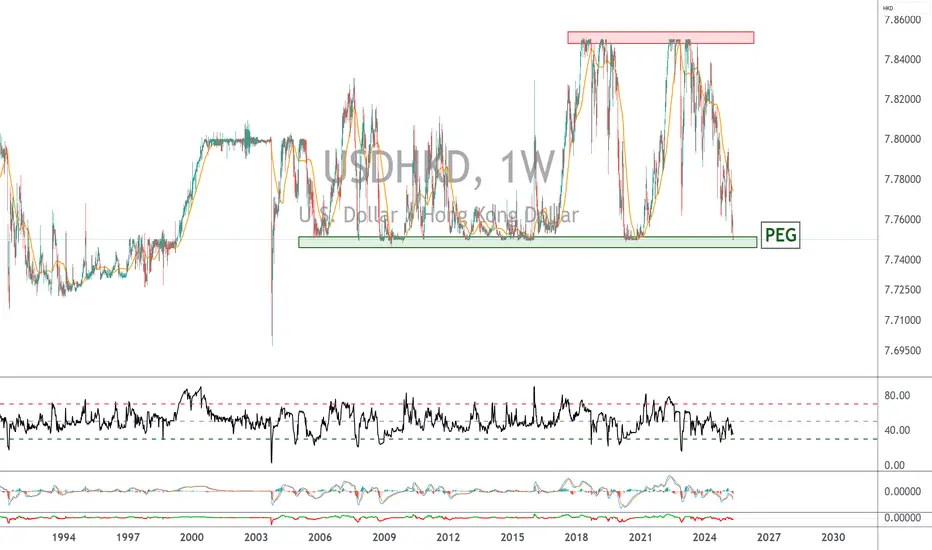
Will the pattern repeat itself again - USDHKD ??I could not find a pair that offers such kind of risk reward ratio , haha. However, do note from the historic pattern that it may not goes down to 7.749 immediately as shown on chart.
Yes, you do need patience in this pair, I would say , short it and keep it there for minimum 6 months or more.
As usual, please DYODD
HONG KONG DOLLAR / U.S. DOLLAR
No trades
No trades
In-depth trading ideas
USD/HKD — Long at Pullback Demand- [Quantum Algo]USDHKD
Context:
USD/HKD has been climbing steadily since mid-May — rallying from 7.8270 to 7.8388 in a controlled, structured move. The first Buy signal on this chart fired at 7.8290 and delivered a clean move up to 7.8550 — over 250 pips of follow-through. Now, after a pullback to 7.8346, a second Buy signal has fired at a higher base.
Why this setup works — three confluences:
Signal pattern repetition — the previous Buy signal on this exact chart delivered its full move with clean structure.
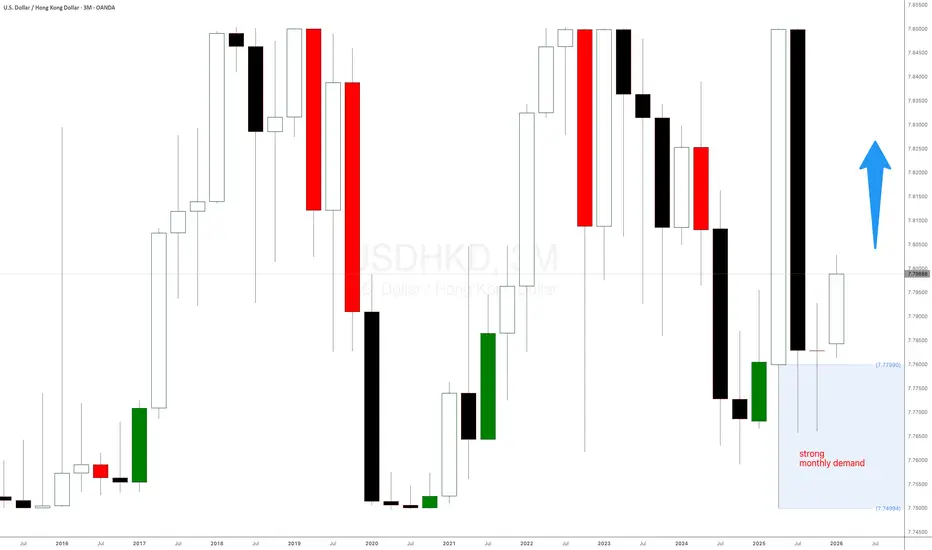
USDHKD Rally: The Monthly Demand You Should Have not Have MissedThe Move Was Planned Months Ago
There’s a reason USDHKD didn’t just “randomly” rally.
Back in November 2025, price dropped straight into a major monthly demand level around 7.77. That’s not a coincidence, and it’s definitely not something you want to ignore if you’re serious about learning how to trade forex.
This is the type of level that quietly sits there while most traders are busy chasing intraday setups. Then, when price reacts, everyone suddenly starts asking what news caused the move.
USDHKD monthly demand level is playing out. New leg expectedUSDHKD monthly demand level mentioned a few weeks ago is playing out as expected. New leg expected. New bullish price action and strong daily and H4 bullish impulses are happening as a reaction to this strongly monthly demand level at $7.77.
Expecting a new bullish leg in the following weeks.
USDHKD LONGI am awaiting for the price to come down more to 7.76 price level before going LONG. If you look back to the historic pattern of this pair, it stays nicely at the 7.75 price level since 2007 and it always rebound, haha. I will allocate a small 3% to test out my idea.
As usual, please DYODD
USDHKD Forex Pair is exploding as expectedMost traders keep chasing candles on the 5-minute chart, hoping to find magic. But magic doesn’t happen there — it happens when you learn to wait.
The USD/HKD Forex pair is the perfect example. We called the monthly demand level at 7.77 weeks ago, and look at it now — it’s reacting beautifully.
The big boys are buying while everyone else is still guessing. Let’s dive into the chart and see why this pair is offering both swing and intraday opportunities right now!
USDHKD Forex Analysis and Forec
USD/HKD Forex. US Dollar getting stronger vs Honk Kong DollarStrong weekly demand level at $7.779 on USD/HKD forex cross-pair. We're expecting the US Dollar to get much stronger against the Hong Kong dollar in the following days and weeks. You can use this weekly imbalance to trade or use the smaller timeframes to take intraday and scalping Forex long positions.
USD/HKD short?Factors That Could Push USD/HKD Lower (HKD Appreciation)
Capital Inflows Into Hong Kong
-Increased foreign investment (e.g., into Hong Kong equities, IPOs, real estate) can drive demand for HKD.
-This forces HKMA to intervene by selling HKD and buying USD to keep the peg in place.
Stronger Chinese Economic Outlook
-Since Hong Kong is tightly linked to China, a surge in investor confidence in China’s recovery or stimulus measures can boost demand for HKD assets.
US Dollar Weakness
-I
How can I use PEGs to trade Forex?Hello everyone,
On May 6, we brought you a technical update on the USD/HKD rate (US dollar VS Hong Kong dollar), as the exchange rate was testing the PEG level of 7.75, defended by the Hong Kong monetary authorities. The PEG therefore provided solid support, and the exchange rate rebounded strongly. It is now under resistance. We'd like to take this opportunity to offer you an educational update on the notion of the PEG in Forex. The link to our May 6 article is just below.
What is a PEG an
Caution: USD/HKD rate tests decisive PEG of 7.75Introduction: Since the start of 2025, the US dollar has been the only major currency to post a significant decline on the forex market. In fact, it is the only so-called major currency to have fallen on Forex this year. Against this backdrop, Donald Trump's trade war has weakened the greenback's image as a safe haven in the face of the risk of global economic recession. Institutional investors have increased their short positions in the US dollar in recent weeks, reaching a net short exposure
USDHKD 7.75 and 7.85 PEG RANGE USDHKD is waking up and we're getting early signals of a run toward 7.85
This pair moves in slow motion, but right now the setup is clear as price is grinding higher after bouncing perfectly from our key level. HKMA’s 7.85 weak-side peg is acting like a price magnet when the Fed stays hawkish = fuel for this move
Most traders ignore this pair because it’s pegged and low volatility but that’s exactly why it works. Institutions trade this range relentlessly for easy profits. We’re riding the mom
USDHKD PROJECTION FOR MY FRIENDS Dear followers and friends,
See a great analysis of USDHKD on trendline and zones,
Confirming bearish move, now we wait for the market to touch the double TOP, Confirm the start of bearish movement.
Kindly like and recommend to your friends ...
OLUMIGHTYFX ACADEMY NIGERIA
USDHKD One of the best buys in the market.The USDHKD pair just formed a 1W Death Cross this week but the current 1W candle is a green one. The reason is that it is rebounding after reaching last week the 2-year Support Zone. We believe that we will see an aggressive rise next that will approach the Lower Highs trend-line. Our target is just below it at 7.82500.
-------------------------------------------------------------------------------
** Please LIKE 👍, FOLLOW ✅, SHARE 🙌 and COMMENT ✍ if you enjoy this idea! Also share your ideas
USDHKD Bounced off the 2022 Support! Strong buy!The USDHKD pair hit amidst Monday's turmoil the top of the Support Zone that was established back on the week of December 05 2022 and instantly rebounded. This naturally shows the strong technical demand of that level.
Even tough another 1-2 weeks of consolidation is possible, on the long-term, we expect a test of the May 01 2023 Lower Highs trend-line. Our Target is 7.8300.
-------------------------------------------------------------------------------
** Please LIKE 👍, FOLLOW ✅, SHARE 🙌 an
USD/HKD Trading Signal: SellDear Traders,
Our analysis using the EASY Quantum Ai strategy suggests a potential Sell opportunity for the USD/HKD currency pair. Please find the detailed signal below:
Direction: Sell
Enter Price: 7.80837
Take Profit: 7.80693667
Stop Loss: 7.80964667
Justification:
1. Technical Analysis: We've detected a downward trend formation in short-term charts, which is supported by a series of lower highs and lower lows, indicating bearish momentum.
2. Resistance Levels: The 7.80837 price
Trade Signal for USDHKD PairDirection: Sell
Enter Price: 7.81036
Take Profit: 7.80840333
Stop Loss: 7.81196333
We have generated a trade signal for the currency pair USDHKD, with a SELL direction at the entry price of 7.81036. The Take Profit target is set at 7.80840333, and the Stop Loss is placed at 7.81196333. This forecast is developed using the EASY Quantum Ai strategy.
Rationale Behind the Forecast:
1. Technical Analysis: Our quantitative models have identified a potential bearish trend for USDHKD based o
USDHKD Be ready for a long-term buy.The USDHKD pair has been giving us excellent trades in the past 12 months and the latest (April 18, see chart below) almost hit our 7.79500 Target about 3 weeks ago:
With the price approaching yet again the 11-month Support Zone, there is no reason to diverge from this successful pattern. Right now by being so close to the Support Zone, the R/R ratio favors buying towards the Resistance Zone.
Our Target will be slightly lower at 7.83900 (April 08 High).
-----------------------------------
USDHKD - In Downtrend with Symmetrical TriangleUSDHKD in 1h time frame chart is printing Downtrend with Symmetrical Triangle pattern and there is no any divergence in RSI. Therefore market may seem more inclined to move in the direction of the existing trend.
Hence I'll take short trade with Sell Stop Order on the breakdown last Lower Low level with stoploss above at last Higher Low level.
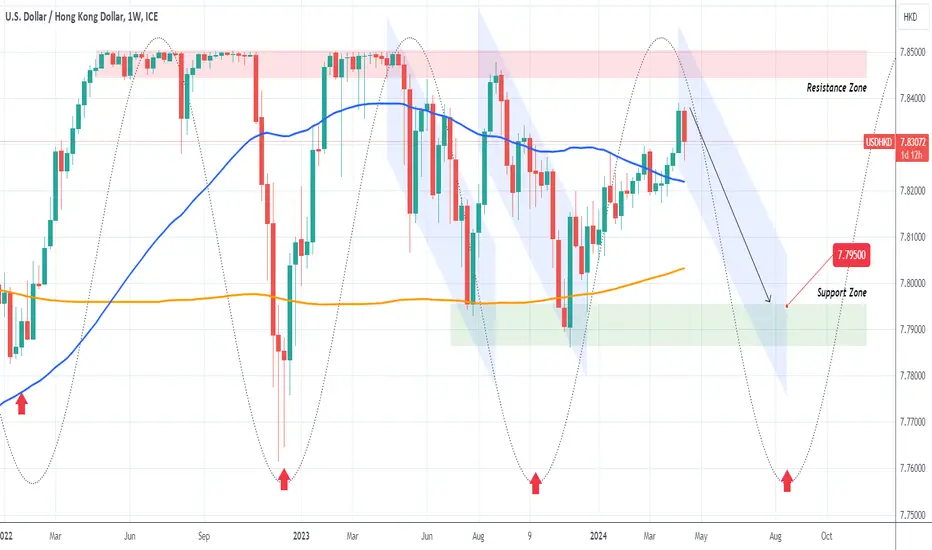
USDHKD Approaching the 2-year Resistance Zone. Major Sell.The USDHKD pair has been rising since November 2023 after hitting the Support Zone and is approaching the 2-year Resistance Zone. The Sine Waves help us understand the cyclical nature behind it. This is a low risk sell opportunity for the long-term. Our Target is 7.79500 (top of Support Zone).
-------------------------------------------------------------------------------
** Please LIKE 👍, FOLLOW ✅, SHARE 🙌 and COMMENT ✍ if you enjoy this idea! Also share your ideas and charts in the comment