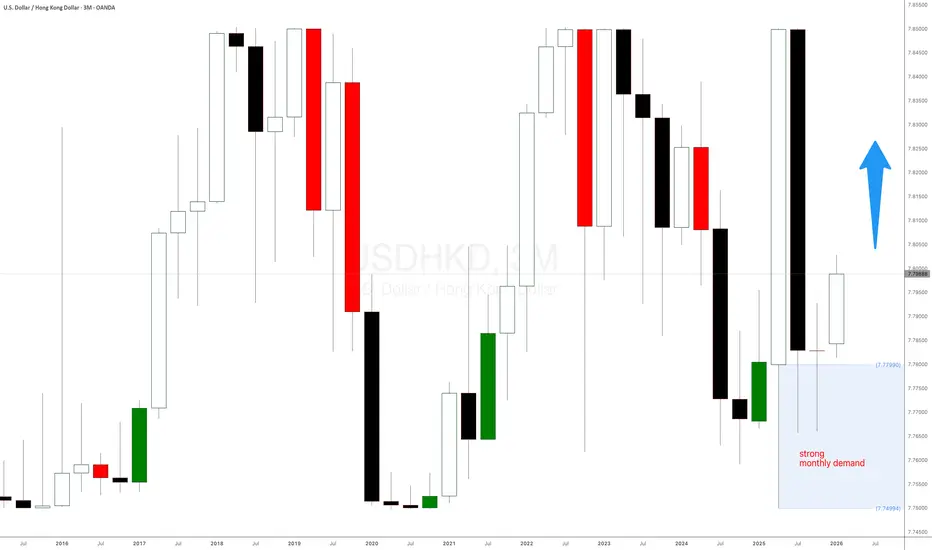
Will the pattern repeat itself again - USDHKD ??I could not find a pair that offers such kind of risk reward ratio , haha. However, do note from the historic pattern that it may not goes down to 7.749 immediately as shown on chart.
Yes, you do need patience in this pair, I would say , short it and keep it there for minimum 6 months or more.
A
HONG KONG DOLLAR / U.S. DOLLAR
No trades
No trades
Peers for comparison
USD/HKD — Long at Pullback Demand- [Quantum Algo]USDHKD
Context:
USD/HKD has been climbing steadily since mid-May — rallying from 7.8270 to 7.8388 in a controlled, structured move. The first Buy signal on this chart fired at 7.8290 and delivered a clean move up to 7.8550 — over 250 pips of follow-through. Now, after a pullback to 7.8346, a second
USDHKD Rally: The Monthly Demand You Should Have not Have MissedThe Move Was Planned Months Ago
There’s a reason USDHKD didn’t just “randomly” rally.
Back in November 2025, price dropped straight into a major monthly demand level around 7.77. That’s not a coincidence, and it’s definitely not something you want to ignore if you’re serious about learning how to
USDHKD monthly demand level is playing out. New leg expectedUSDHKD monthly demand level mentioned a few weeks ago is playing out as expected. New leg expected. New bullish price action and strong daily and H4 bullish impulses are happening as a reaction to this strongly monthly demand level at $7.77.
Expecting a new bullish leg in the following weeks.
USDHKD LONGI am awaiting for the price to come down more to 7.76 price level before going LONG. If you look back to the historic pattern of this pair, it stays nicely at the 7.75 price level since 2007 and it always rebound, haha. I will allocate a small 3% to test out my idea.
As usual, please DYODD
USDHKD Forex Pair is exploding as expectedMost traders keep chasing candles on the 5-minute chart, hoping to find magic. But magic doesn’t happen there — it happens when you learn to wait.
The USD/HKD Forex pair is the perfect example. We called the monthly demand level at 7.77 weeks ago, and look at it now — it’s reacting beautifully.
The
USD/HKD Forex. US Dollar getting stronger vs Honk Kong DollarStrong weekly demand level at $7.779 on USD/HKD forex cross-pair. We're expecting the US Dollar to get much stronger against the Hong Kong dollar in the following days and weeks. You can use this weekly imbalance to trade or use the smaller timeframes to take intraday and scalping Forex long positio
USD/HKD short?Factors That Could Push USD/HKD Lower (HKD Appreciation)
Capital Inflows Into Hong Kong
-Increased foreign investment (e.g., into Hong Kong equities, IPOs, real estate) can drive demand for HKD.
-This forces HKMA to intervene by selling HKD and buying USD to keep the peg in place.
Stronger Ch
See all ideas
Summarizing what the indicators are suggesting.
Oscillators
Neutral
Oscillators
Neutral
Summary
Neutral
Summary
Neutral
Summary
Neutral
Moving Averages
Neutral
Moving Averages
Neutral
Displays a symbol's price movements over previous years to identify recurring trends.
Frequently asked questions
Today, HKD/USD rate is 0.12741 USD.
For broader market analysis, dive into the technicals on the HKDUSD live chart and read the latest HKDUSD news:
– US Market Open: Risk sentiment dips in limited newsflow ahead of Fed speak with focus turning to NFP
– US Market Open: European bourses/US futures under pressure amid a firmer USD & further debt downside
– US Market Open: Broadly constructive risk tone after a RBA tightening slowdown & ahead of Fed speak
For broader market analysis, dive into the technicals on the HKDUSD live chart and read the latest HKDUSD news:
– US Market Open: Risk sentiment dips in limited newsflow ahead of Fed speak with focus turning to NFP
– US Market Open: European bourses/US futures under pressure amid a firmer USD & further debt downside
– US Market Open: Broadly constructive risk tone after a RBA tightening slowdown & ahead of Fed speak
Markets don't sleep, here's what's going on with HKDUSD at the moment:
– US Market Open: Risk sentiment dips in limited newsflow ahead of Fed speak with focus turning to NFP
– US Market Open: European bourses/US futures under pressure amid a firmer USD & further debt downside
– US Market Open: Broadly constructive risk tone after a RBA tightening slowdown & ahead of Fed speak
See more updates in real-time with our News Flow.
– US Market Open: Risk sentiment dips in limited newsflow ahead of Fed speak with focus turning to NFP
– US Market Open: European bourses/US futures under pressure amid a firmer USD & further debt downside
– US Market Open: Broadly constructive risk tone after a RBA tightening slowdown & ahead of Fed speak
See more updates in real-time with our News Flow.
The safest way to trade HKDUSD is through a reliable broker. Create an account, fund it, and place a buy order.
You can trade HKDUSD directly from TradingView:
– Choose a broker: Explore our supported trading partners and pick one that fits your needs
– Compare options: View available brokers side by side to evaluate fees and features
– Connect your account: Open Supercharts, click "Trade", select your broker, and log in
– Start trading: Place orders without leaving the chart
Tip: If you're new to trading, try paper trading first — it lets you practice strategies in real market conditions without risking funds.
You can trade HKDUSD directly from TradingView:
– Choose a broker: Explore our supported trading partners and pick one that fits your needs
– Compare options: View available brokers side by side to evaluate fees and features
– Connect your account: Open Supercharts, click "Trade", select your broker, and log in
– Start trading: Place orders without leaving the chart
Tip: If you're new to trading, try paper trading first — it lets you practice strategies in real market conditions without risking funds.
It's worth checking HKDUSD rate change for various periods to get the full picture:
– 1 day — 0.00%
– 1 week — −0.02%
– 1 month — +0.02%
HKDUSD's all-time low was 0.12734 USD (Apr 11, 2018), and its highest price is 0.12908 USD (Dec 2, 2009). Track the dynamics with the latest forex news right on TradingView.
– 1 day — 0.00%
– 1 week — −0.02%
– 1 month — +0.02%
HKDUSD's all-time low was 0.12734 USD (Apr 11, 2018), and its highest price is 0.12908 USD (Dec 2, 2009). Track the dynamics with the latest forex news right on TradingView.
When trading HKDUSD, one should keep in mind many factors.
First, analyze the fundamentals:
– Macroeconomic data: Inflation, GDP, employment, and other key indicators in the economies behind both currencies
– Central bank policy: Interest rate decisions and monetary policy from the respective central banks
– Market sentiment: Check what other traders anticipate
– News flow: Geopolitical events and economic releases
Then check technical ratings:
– Today — strong sell
– 1-week — sell
– 1-month — sell
Identify the trend, watch key levels (support and resistance), consider volatility and upcoming economic events. Then, you'll be closer to an informed decision.
First, analyze the fundamentals:
– Macroeconomic data: Inflation, GDP, employment, and other key indicators in the economies behind both currencies
– Central bank policy: Interest rate decisions and monetary policy from the respective central banks
– Market sentiment: Check what other traders anticipate
– News flow: Geopolitical events and economic releases
Then check technical ratings:
– Today — strong sell
– 1-week — sell
– 1-month — sell
Identify the trend, watch key levels (support and resistance), consider volatility and upcoming economic events. Then, you'll be closer to an informed decision.
HKDUSD volatility measures how much the exchange rate fluctuates over time, i.e. how quickly and how strongly it moves up or down.
The current volatility rating is 0.02%.
What it means for traders:
– Higher volatility: Larger and faster price swings → higher risk and opportunity
– Lower volatility: More stable price movement → smaller trading ranges
– Market behavior: Volatility often increases during major economic news or central bank decisions
Volatility helps traders estimate risk and position sizing. It's also useful for adapting strategies to market conditions.
How to use volatility:
– Compare volatility across other currency pairs
– Combine with technical analysis (trends, support/resistance)
– Monitor economic events that may increase market movement
The current volatility rating is 0.02%.
What it means for traders:
– Higher volatility: Larger and faster price swings → higher risk and opportunity
– Lower volatility: More stable price movement → smaller trading ranges
– Market behavior: Volatility often increases during major economic news or central bank decisions
Volatility helps traders estimate risk and position sizing. It's also useful for adapting strategies to market conditions.
How to use volatility:
– Compare volatility across other currency pairs
– Combine with technical analysis (trends, support/resistance)
– Monitor economic events that may increase market movement
HKDUSD is quoted as how many USD (quote currency) it takes to buy one HKD (base currency).
For example, if the pair trades at 1.50, it means 1 HKD = 1.50 USD.
What can influence the rate:
– Supply and demand: Driven by trade, investment flows, and speculation
– Economic data: Inflation, GDP, employment reports
– Central bank policy: Interest rates and monetary decisions
Follow these and more events in the Economic Calendar.
For example, if the pair trades at 1.50, it means 1 HKD = 1.50 USD.
What can influence the rate:
– Supply and demand: Driven by trade, investment flows, and speculation
– Economic data: Inflation, GDP, employment reports
– Central bank policy: Interest rates and monetary decisions
Follow these and more events in the Economic Calendar.