In-depth trading ideas
Trading GOLD with Volume Profile and VWAP - XAUUSD Trade IdeaIn this video, I show you how I use Volume Profile and VWAP to gain an edge when trading XAUUSD. I'll walk you through my current market analysis, explain what I'm looking for, and share a trade idea you can use as part of your own trading plan.
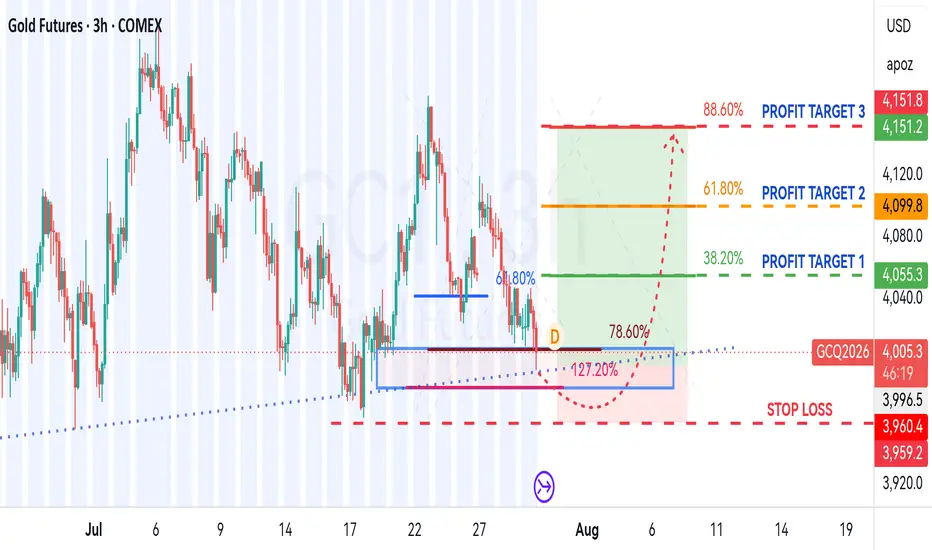
GC Long — Gold's dip into support looks like a gift before the nGold is printing a clean, aligned 4h bullish pullback that has reset its extension nicely. Recent headlines highlight a pause in the rally as Fed minutes loom, but analysts favor buying the dip into the current support zone. The structure provides a solid risk-reward setup to position for the next leg higher, though conviction is slightly tempered by the upcoming binary event.
📍 Entry: 4106.8
🛑 Stop: 4065.6
🎯 Target: 4180.2
⚖️ R:R: 1.78
GC one hour hitting resistanceGC one hour is in a sideways range. The market is near the
top of the range. I am looking for one of two things.
1) The market to fall back down towards the bottom of the
range.
2) The market to break above the top of the range and
create a bullish trend.
Once the market gives the above information. I can bring
in Fibonacci to help with Entry, Stop & Limit prices
Take partial profits if you want to ruin your futureTaking partials is not inherently a better strategy unless the numbers actually show that it is. The reality is that, in general, the data shows exactly the opposite: reducing the size of a winning position halfway through, or even earlier, ends up hurting long-term profitability instead of improving it.
The logic is actually quite simple. When someone needs to determine where to take profits, the only thing they can really do is estimate the probability of price reaching a given target. Suppose someone does the work and their data shows that, on average, a certain target has a 70% probability of being reached. Perfect. That trader now has a logical place to set their take profit instead of choosing one that is completely random or based on feelings or intuition.
Now, what happens if they decide to take partial profits halfway there? If the original target was chosen because the statistics showed it was the optimal exit, then taking partials before reaching it also requires a statistical justification. Otherwise, the decision is no longer based on the same probabilistic framework used to choose the TP in the first place.
Seventy percent of the time, price will still reach the target, but it will do so with only half of the original position, while losing trades will still be full-size losses.
There is nothing in this framework, the most basic framework that exists in trading, that makes it reasonable to abandon half of a position halfway to the target just to lock in less profit.
We constantly hear traders say things like, "Price moves toward liquidity pools." Fine. If that is the natural path of price, then why would you want to arrive there with only half of your position, assuming reaching that area is already considered a high-probability event? From a numerical or expectancy standpoint, it makes absolutely no sense.
In reality, traders take partial profits as a psychological crutch, not because it generates higher returns. I am guilty of this type of behavior myself, I'm not going to lie, but I don't lie to myself. Actually, it's not that I take partial profits, because I never do. But sometimes I exit earlier because I "feel" something is about to happen, and then price ends up reaching the natural TP defined by the framework anyway.
Being able to withstand the turbulence between point A and point B while reducing risk is precisely what separates traders from one another. Some are masters at this and can add to winning positions or reduce risk by moving to breakeven or using a profit stop, without necessarily sacrificing their upside.
Taking partial profits has absolutely no numerical foundation unless the trader can statistically demonstrate that they improve the strategy. In practice, almost nobody does this. Most traders do it because it feels good, not because it is more profitable. If you expect someone to come forward and say, "I take partial profits because my data shows it's better", you probably won't find them, because the numbers overwhelmingly point in the opposite direction.
XAUUSD ANALYSIS
ANALYSIS
---
# GC1! | PDH Liquidity Sweep into HTF Bearish Order Block | ICT Premium Distribution Model
## Executive Summary
Gold Futures (GC1!) have rallied into a high-probability institutional reaction zone after engineering liquidity above the **Previous Day High (PDH)**. The liquidity sweep occurred within a premium dealing range, where multiple bearish confluences—including SMT divergence, a Higher Timeframe Bearish Order Block, and an unmitigated Fair Value Gap—suggest the potential for a bearish repricing.
Rather than anticipating a reversal, this setup focuses on waiting for bearish confirmation before targeting internal sell-side liquidity.
**Market Bias:** Bearish while price remains below the Higher Timeframe Bearish Order Block.
---
# Market Narrative
Price delivered a strong bullish expansion from the Previous Day Low (PDL), rebalancing inefficiencies before attacking **Previous Day High (PDH)** liquidity.
The raid above PDH occurred directly beneath the **Previous Week High (PWH)** and inside a Higher Timeframe Bearish Order Block, placing price in a premium environment where institutional distribution frequently occurs.
Adding further weight to the bearish thesis, **SMT divergence** developed during the rally, indicating weakening relative strength despite the continued advance.
If sellers reclaim control through a lower-timeframe Market Structure Shift (MSS), the market may begin delivering toward internal sell-side liquidity and nearby bullish imbalances.
---
# Institutional Confluences
### Previous Day High (PDH) Liquidity Sweep
The market engineered liquidity above PDH before showing signs of rejection.
Liquidity raids above previous session highs frequently precede institutional reversals when supported by additional confluences.
---
### Previous Week High (PWH)
The weekly liquidity objective remains overhead, placing price within a higher-timeframe premium zone where institutional selling interest may increase.
---
### Higher Timeframe Bearish Order Block
Price is trading beneath a significant bearish Order Block that previously initiated an impulsive decline.
This remains the primary institutional supply zone and serves as the invalidation area for the bearish thesis.
---
### Bearish Fair Value Gap (FVG)
The current rally has mitigated a bearish Fair Value Gap, providing an efficient location for institutional sell orders to enter the market.
---
### SMT Divergence
SMT divergence developed during the advance, indicating that correlated markets failed to confirm the new highs.
This intermarket divergence often precedes a liquidity reversal when combined with premium pricing.
---
### Premium Pricing
The market is currently trading in premium relative to the active dealing range, favoring short opportunities over aggressive buying.
---
# Trade Plan
## Entry
**Entry:** **4,149.90**
The preferred short entry follows:
* PDH liquidity sweep
* Rejection inside the Bearish Fair Value Gap
* SMT divergence
* Lower-Timeframe Market Structure Shift (MSS)
* Bearish displacement confirming institutional selling
---
## Stop Loss
**Stop Loss:** **4,178.90**
A sustained acceptance above this level weakens the bearish narrative and increases the probability of continuation toward the Higher Timeframe Bearish Order Block and Previous Week High liquidity.
---
## Profit Targets
### TP1 — Internal Sell-Side Liquidity (SSL)
**Target:** **4,107.30**
The first objective aligns with Internal Sell-Side Liquidity and a nearby bullish Fair Value Gap, making it a logical area for partial profit-taking.
---
### TP2 — 4084
A successful break below Internal SSL increases the probability of price seeking liquidity resting beneath the **Previous Day Low (PDL)**.
---
EXTENDED
### TP3 — Higher Timeframe Bullish Order Block
Should bearish momentum accelerate, price may continue into the Higher Timeframe Bullish Order Block near the **4,055–4,060** region, completing a deeper discount rebalance.
---
## Risk-to-Reward
* **Entry:** 4,149.90
* **Stop Loss:** 4,178.90
* **TP1:** 4,107.30 (Internal SSL)
* **TP2:- 4084
**Projected Risk-to-Reward:** Approximately **7:1**, offering favorable asymmetry if bearish confirmation develops.
---
# Liquidity Roadmap
### Completed
* ✅ Previous Day Low expansion
* ✅ Bullish Displacement
* ✅ Previous Day High Liquidity Sweep
* ✅ Premium Repricing
* ✅ Bearish FVG Mitigation
* ✅ SMT Divergence
### Monitoring
* ⏳ Lower-Timeframe MSS
* ⏳ Bearish Displacement
* ⏳ Internal SSL Raid (TP1-TP2)
* ⏳ Previous Day Low (TP3)
---
# Alternative Scenario
If buyers establish sustained acceptance above **4,178.90** and continue through the Higher Timeframe Bearish Order Block, the bearish setup becomes invalid. In that scenario, the market may continue expanding toward **Previous Week High (PWH)** liquidity before encountering the next significant area of institutional supply.
---
# Trade Checklist
* ✅ Higher Timeframe Bias
* ✅ Premium Pricing
* ✅ Previous Day High Liquidity Sweep
* ✅ Previous Week High Overhead Liquidity
* ✅ SMT Divergence
* ✅ Higher Timeframe Bearish Order Block
* ✅ Bearish Fair Value Gap
* ✅ Defined Risk
* ⏳ Lower-Timeframe MSS Confirmation
* ⏳ Bearish Execution Trigger
---
# Conclusion
This setup reflects a high-confluence ICT premium distribution model, where price engineers liquidity above the **Previous Day High** within a premium dealing range before testing a Higher Timeframe Bearish Order Block. The combination of **PDH sweep, SMT divergence, Bearish Fair Value Gap mitigation, and institutional supply** creates a compelling bearish framework. Execution remains conditional on lower-timeframe confirmation, with downside objectives focused on **Internal Sell-Side Liquidity**, the **Previous Day Low**, and the Higher Timeframe Bullish Order Block.
---
**Educational Disclaimer**
This analysis is provided solely for educational purposes to illustrate ICT and Smart Money Concepts. It presents a scenario-based market interpretation and should not be considered financial advice or a prediction of future price movement. Always wait for confirmation and apply disciplined risk management before entering any trade.
Gold Update [30JUL2026]wave 4 of wave C shows another peak which potentially shapes a triangle
this spike should keep below previous high of $4,171 to fit triangle's rule
The low of wave 3 as a target was eliminated as triangle would accumulate
enough bearish momentum to drop much lower
Other downside targets remain unchanged from previous update
RSI keeps Bearish position under the "waterline"
Bullish trigger is set at the bottom of wave 1 at $4,510
Gold Outlook: Smart Money SetupGold Outlook: Smart Money Setup
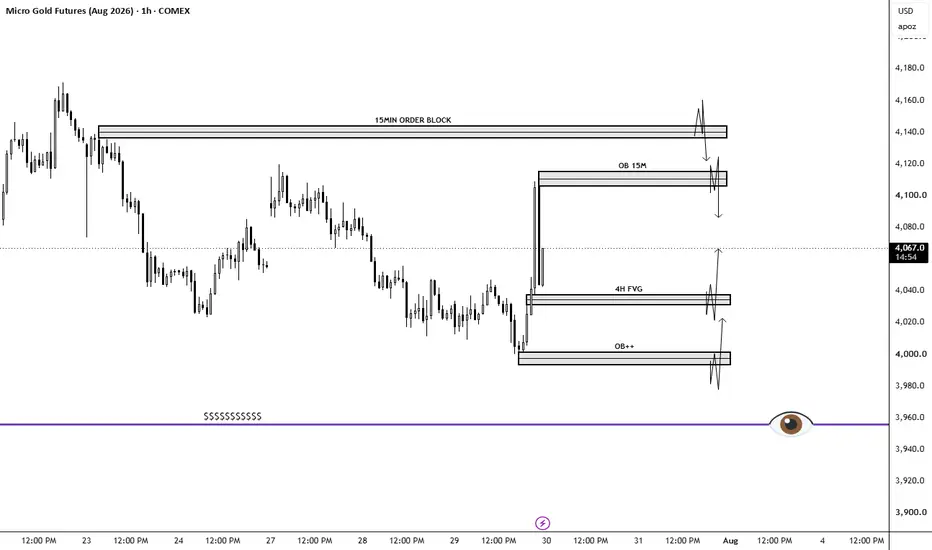
Gold has reached a major 15M Order Block, making this a key decision zone. A liquidity sweep above the highs followed by rejection could trigger a move toward the 4H Fair Value Gap and lower demand levels.
If buyers manage to hold above the supply zone with strong momentum, the bullish trend remains valid.
Bias: Bearish unless price confirms acceptance above the 15M Order Block.
Trade the confirmation, not the anticipation.
#Gold #XAUUSD #SmartMoney #SMC #ICT #TradingView #PriceAction #OrderBlock #FVG #Liquidity
GOLD (GC): Fib Confluence & Declining VolumeFollowing a strong macro rally to $5,508, Gold (COMEX Futures) has entered a corrective wedge phase. Price action has pulled back directly into a major confluence zone on the daily chart, testing whether long-term buyers will step back in to defend the primary uptrend.
Key Technical Factors
38.2% Fibonacci Level ($4,004.9): Price is interacting directly with the first major macro Fib retracement level from the $1,571 base run.
Structural Support ($3,947 – $4,098): Confluence between horizontal demand and dynamic trendline support.
Volume Profile & Contraction: Noticeable volume decay during the corrective channel descent, signaling selling momentum is drying up as price reaches lower liquidity pools.
Macro Trend Alignment: The long-term rising trendline and 200-day moving average remain intact just below current price levels.
Trade Execution Scenarios
Scenario A: Bullish Defense
Trigger: Daily reversal confirmation (e.g., pin bar / bullish engulfing holding above $3,947).
Target 1: $4,397.4 (Resistance / Lower high)
Target 2: $4,579.7 (23.6% Fib level)
Target 3: $5,508.9 (Macro Highs)
Invalidation: Daily close below $3,940.
Scenario B: Corrective Expansion
Trigger: Sustained daily close below $3,947 with an expansion in bear volume.
Target 1: $3,540.3 (50.0% Fib retracement)
Target 2: $3,289.3 (Major structural horizontal shelf)
Are you looking for a bounce off this 38.2% Fib zone, or do you expect a deeper pullback toward the 50% retracement? Drop your thoughts in the comments!
Gold – Long-Term Perspective **Gold – Long-Term Perspective 📉📈**
Today, I'm taking a look at **Gold from a higher-timeframe perspective**.
The **Weekly (W1), Daily (D1), and H4 charts** are all currently showing a **bearish order flow**. From a structural point of view, the broader trend remains to the downside.
However, it is important to keep the recent price action in perspective. Since its **all-time high**, Gold has already declined by **around 30%**. After such an extended move, a corrective recovery is a realistic possibility before the higher-timeframe trend continues.
From the **H4 chart**, my preferred scenario is a move higher toward the **buy-side liquidity** resting above the current price. This area is particularly interesting because it could offer a location where sellers step back into the market, potentially leading to another leg lower.
Looking at the **weekly timeframe**, significant **sell-side liquidity** still remains below the current market. This supports the idea that any bullish move in the coming weeks may be corrective rather than the beginning of a new long-term uptrend.
For the next few weeks, **long setups** are therefore worth monitoring, provided the market confirms them through price action. Once the buy-side liquidity has been taken, I will reassess whether the market is preparing for another move lower.
As always, I don't predict the market—I prepare for scenarios and let price action determine the next move.
**Disclaimer:** This post is provided for informational and educational purposes only and does not constitute financial or investment advice, or a recommendation to buy or sell any financial instrument. All analyses reflect my personal market view only. Every trader and investor should conduct their own research and apply appropriate risk management.
#Trading #Gold #XAUUSD #ICT #PriceAction #Liquidity #OrderFlow #MarketStructure #SmartMoney #TechnicalAnalysis #SwingTrading
GOLD: Still Trending Lower! Is It At The Bottom Yet?In this Weekly Market Forecast, we will analyze Gold for the week of July 20-24th.
Gold is widely expected to lean bearish this coming week, as prices struggle to hold the critical $4,000 per ounce floor. Downward pressure is being driven by a stronger US dollar and expectations of a hawkish Federal Reserve, even though easing US inflation numbers recently tried to provide some support.
These same price levels are in Premium of the range. So, I am on the look out for the sell model to form on the highlighted fib levels.
Enjoy!
May profits be upon you.
Leave any questions or comments in the comment section.
I appreciate any feedback from my viewers!
Like and/or subscribe if you want more accurate analysis.
Thank you so much!
Disclaimer:
I do not provide personal investment advice and I am not a qualified licensed investment advisor.
All information found here, including any ideas, opinions, views, predictions, forecasts, commentaries, suggestions, expressed or implied herein, are for informational, entertainment or educational purposes only and should not be construed as personal investment advice. While the information provided is believed to be accurate, it may include errors or inaccuracies.
I will not and cannot be held liable for any actions you take as a result of anything you read here.
Conduct your own due diligence, or consult a licensed financial advisor or broker before making any and all investment decisions. Any investments, trades, speculations, or decisions made on the basis of any information found on this channel, expressed or implied herein, are committed at your own risk, financial or otherwise.
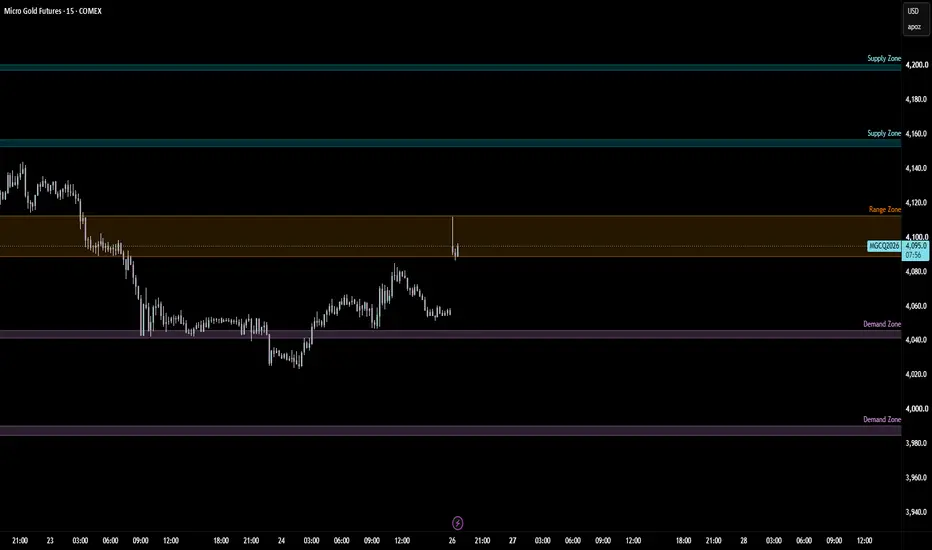
Breakout Zones MGC 15m / 28 JulyGold Range 15m
Waiting for a breakout of the current range.
- Breakout to the upside → Long with TP at Supply Zone
- Breakout to the downside → Short with TP at Demand Zone
What’s your bias on the next breakout?
Thanks to gold's volatility, a trade never lasts more than one day.
Drop a Boost if you like the idea and follow for daily setups 🚀
Not financial advice — for educational purposes only.
Gold (MGC) Weekly Outlook | Will Sellers Stay in Control?Heading into a new trading week, I'm trying to stay focused on what price is doing, not what I want it to do.
Last week started with strong bullish momentum, but everything changed after Wednesday's New York session. Sellers stepped in aggressively, and by Friday Gold had closed back below the midpoint of the week's expansion. That tells me buyers lost control of the auction at higher prices.
On the bigger picture, Gold is still trading below the Monthly Point of Control (POC), which keeps my higher-timeframe bias leaning bearish. However, I'm not interested in chasing shorts into support.
My ideal scenario would be a retracement back toward the 4085-4120 area, where we have a 1H Fair Value Gap and previous areas of value. If sellers defend that zone, I'll be looking for confirmation of another move lower.
On the other hand, if buyers can reclaim 4120 and hold above it, I'll become much more cautious with any bearish ideas. That would suggest the market may be shifting back toward bullish continuation.
Key Levels This Week
🔹 Resistance: 4085-4120 (1H Fair Value Gap)
🔹 Support: Friday's Low
🔹 Major Psychological Level: 4000
Things I'm Watching
Month-end order flow and possible portfolio rebalancing.
Wednesday's Federal Funds Rate announcement, which is likely to be the biggest volatility event of the week.
Whether rallies are accepted above value or rejected back into the recent downtrend.
I'm not trying to predict exactly where Gold will finish this week. My goal is to identify where buyers or sellers become aggressive and let the market confirm the next move.
Trade the reaction, not the prediction.
#Gold #MGC #Futures #PriceAction #OrderFlow #TradingView #MarketStructure #FairValueGap #COMEX #DayTrading #NOFOMOTrading
XAUUSD Analysis bearish ATTACK!Gold is trading inside a key supply zone after sweeping short-term liquidity, with price showing signs of rejection. As long as this resistance holds, the path of least resistance remains to the downside.
A clean bearish confirmation could trigger a move toward the major demand zone around 4005–4010, where liquidity is resting and buyers may step in. If sellers fail to maintain control and price reclaims the current supply, the bearish idea becomes invalid.
Key Levels
🔹 Resistance: 4058–4063
🔹 Target: 4005–4010
🔹 Bias: Bearish below resistance
Patience > Prediction. Wait for confirmation before execution.
#XAUUSD #Gold #COMEX #TradingView #SMC #ICT #PriceAction #Futures #Liquidity #Trading
Gold Never Rests So Why Should Its Futures?Although COMEX gold futures trade almost continuously during the week, they halt every Friday afternoon and do not reopen until Sunday evening. Yet events that move gold markets can and do occur over the weekend.
While Gold priced through crypto tokenized gold and CFD style products can continue trading during that closure, the most active gold trading venue – CME futures – remains closed.
COMEX has listed gold futures since December 1974, and this weekend break has existed throughout that period. Continuous gold feeds are a much more recent development, creating a structural mismatch between prices that continue to move and regulated derivatives that remain closed.
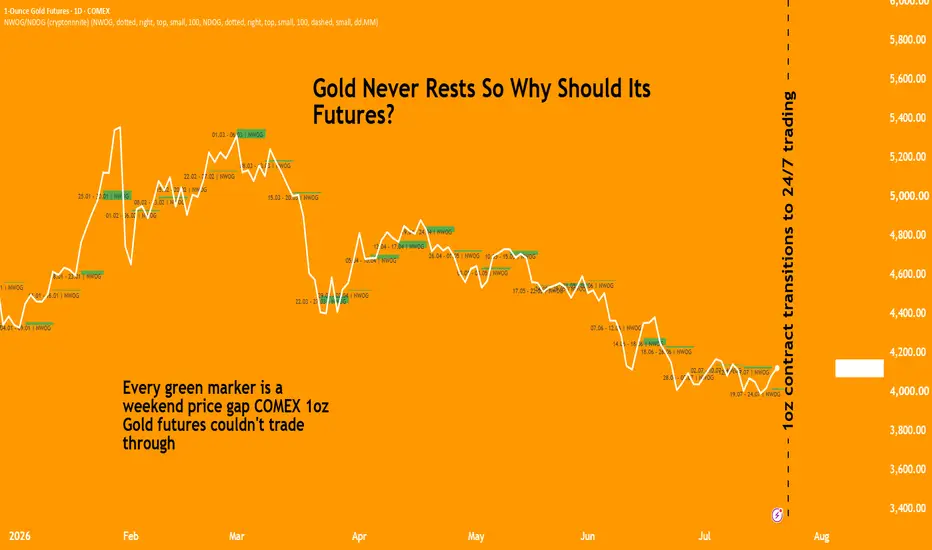
Any repricing during that window appears as a gap when futures resume trading, leaving no regulated and liquid trading venue between Friday's close and Sunday's reopen.
Against this backdrop, CME is enabling 24/7 trading for its 1oz gold futures , scheduled to launch on 24 July 2026, reducing the roughly two-day blind spot to a brief maintenance window.
What the Data Reveals About Gold Weekend Gaps
To measure the impact of the weekend futures market closure, we analysed 44 weekends between October 2025 and July 2026, comparing the Friday close with the Sunday reopen and tracking whether each gap was filled during the following trading week.
Most gaps were modest, remaining within roughly 0.5% in either direction. The clear outlier was late January 2026, when gold reopened 2.91% lower, the largest gap in the sample. That move followed news of Kevin Warsh's appointment as the next Federal Reserve Chair.
It also shows why weekend price action has become more common. Market-moving policy announcements increasingly land over the weekend. Recent examples span monetary policy, trade measures and geopolitical developments, leaving investors exposed to moves they cannot hedge.
Of the 44 gaps, 42 (95.5%) were filled during the following trading week, leaving only two open.
The 17 April 2026 gap, at 1.03%, has remained open for more than three months, despite closing within 0.02% of filling in late April. The 10 July gap, more recent and larger at 1.08%, has stayed further from filling, closing 0.87% short at its nearest approach.
The Gap Understates Weekend Risk
The Friday-close-to-Sunday-reopen gap captures only two price snapshots and says nothing about gold's path in between.
Comparing it with the full weekend high-low range shows how much risk the headline gap can miss. In late January 2026, the 2.91% gap sat against a 4.84% weekend range. In late February, a 1.96% gap compared with a 4.18% range, more than twice as large.
Across the sample, the weekend range exceeded the two-point gap in 43 of 44 weeks, including ordinary low-volatility periods. The understatement was therefore structural rather than driven by a few large moves. This represents potential market moves that gold traders never had access to before.
Why This Matters
The same pattern exposes the weakness of relying on proxies such as XAUTUSD. Thin, catch-up-prone trading may show where gold has moved, but not at the depth required for genuine price discovery.
CME's 24/7 1oz gold futures replace that blind spot with regulated weekend volume, reducing the roughly two-day closure to a brief maintenance window.
Continuous trading won't make weekend risk disappear, but it does bring that risk into view earlier, when traders can still act on it.
The 17 April gap, still open after more than three months, illustrates the distinction. A move that persists for that long behaves more like a lasting shift in market direction than a temporary blip.
Granular Weekend Hedging using Micro Contracts
The weekend of 30 January 2026 provides a useful example of what continuous access would have meant in practice.
Consider a trader who held a long position in CME 1oz gold futures as of 30/Jan. Under the old framework, the position could not be modified between Friday's COMEX close and the Sunday reopen. The 2.8% decline would therefore have produced a mark-to-market loss of USD 137 before the trader could respond.
The same weekend also shows the upside a short position could have captured, using XAUTUSD as a proxy for how gold would have traded through the closure.
Gold declined steadily into Saturday 31 January, allowing a short to be closed that afternoon at roughly a 2.3% profit. After a brief rebound, prices resumed falling, giving scope to re-enter and close a second short by the Sunday reopen.
Trading both moves would have produced a materially better result than holding a single short across an inactive weekend.
Each CME 1oz Gold futures (1OZ) contract represents 1 troy ounce, one-hundredth of the standard 100-ounce GC contract. This contract requires maintenance margin of ~$200 making them a capital efficient instrument to obtain granular exposure to gold prices.
This content is sponsored.
MARKET DATA
CME Real-time Market Data helps identify trading setups and more effectively express market views. If you have futures in your trading portfolio, you can check out on CME Group data plans available that suit your trading needs at tradingview.com/cme .
DISCLAIMER
This case study is for educational purposes only and does not constitute investment recommendations or advice. Nor are they used to promote any specific products, or services.
Trading or investment ideas cited here are for illustration only, as an integral part of a case study to demonstrate the fundamental concepts in risk management or trading under the market scenarios being discussed.
Gold (MGC) | Is This the High of the Week?After three strong days of bullish momentum, Gold is starting to show signs that buyers may be losing steam. I'm not ready to call the top just yet, but we're reaching an area where I want to see how price reacts before making my next move.
One thing that immediately caught my attention was the large gap down at today's session open. Rather than chasing price lower, I'd actually like to see the market retrace and attempt to fill that gap. The reaction there should tell us a lot about who is in control heading into the Asian Kill Zone.
📈 Bullish Scenario
If buyers reclaim the gap, break above yesterday's high, and can hold those gains, then the uptrend remains intact and I'll continue respecting the bullish momentum.
📉 Bearish Scenario
If price fills the gap but fails to reclaim value, followed by a break and acceptance below 4116, I'll view that as confirmation that sellers are beginning to take control. That would align with the larger bearish structure I'm seeing on the higher timeframes.
I'm trying not to let my higher timeframe bias force trades. Yes, the Daily chart still favors the bears overall, but the intraday trend has been making higher highs and higher lows all week. Until that structure breaks, patience is key.
For me, this session isn't about predicting the next move—it's about letting the market confirm which side is winning the auction.
Key Levels I'm Watching
🔹 Yesterday's High – Bullish continuation if reclaimed and accepted above.
🔹 4116 – Bearish confirmation if price breaks below and accepts underneath.
🔹 Session Gap – The reaction here could determine the direction for the remainder of the week.
As always, I'm letting price come to me rather than chasing moves. The best trades usually come after confirmation, not anticipation.
What's your bias heading into Thursday? Are you expecting continuation higher, or do you think this rally is running out of steam?
#Gold #MGC #Futures #PriceAction #OrderFlow #TradingView #COMEX #MarketStructure #ICT #SmartMoney #DayTrading #NOFOMOTrading
Gold and silver are trading higher today This is July 22nd and they wanted you to see a follow up from yesterday because gold and silver has gone higher but it may be coming to a support area and perhaps some correction lower even though I think gold and silver are going to go higher than what you see right now but there's some patterns that you have to be aware of and that's in the video and there's a little blurb of stuff on space X and I talk about that