HYPE: Target Reached, Next Wave Potential Setup!Hello There,
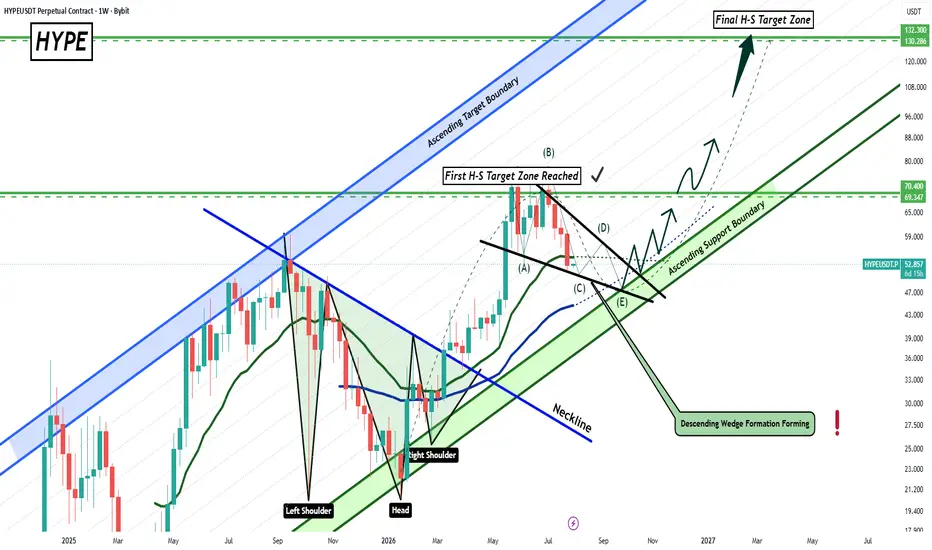
welcome to this update analysis about HYPE. Since my last analysis of HYPE, the coin emerged with strong bullish expansions and already reached the first H-S target zone I pointed out in my analysis. Now, as this important target has been reached HYPE I spotted further pivotal signs which could alter the whole price dynamic within the upcoming times.
When looking at my chart now, we can see how HYPE, since reaching the first target, pulled back and is now testing remaining support zones. As the short-term supply increased, it could drop more and visit the remaining support. The most important support is within the ascending support boundary.
In the next times, it is likely that HYPE visits this area to complete the wave count within the descending wedge, bounce in the supports, and set up the next bullish wave expansion. Once the breakout above the upper boundary of the formation is completed, this will determine the bullish expansion setup.
As already mentioned in my previous analysis, HYPE has the final target zone as marked in my chart. From the current point of view, it is highly necessary that HYPE increases bullish volume and momentum to complete the formation and set up the next bullish wave expansion.
In this manner, thank you a lot for watching!
The support is highly appreciated.
VP
In-depth trading ideas
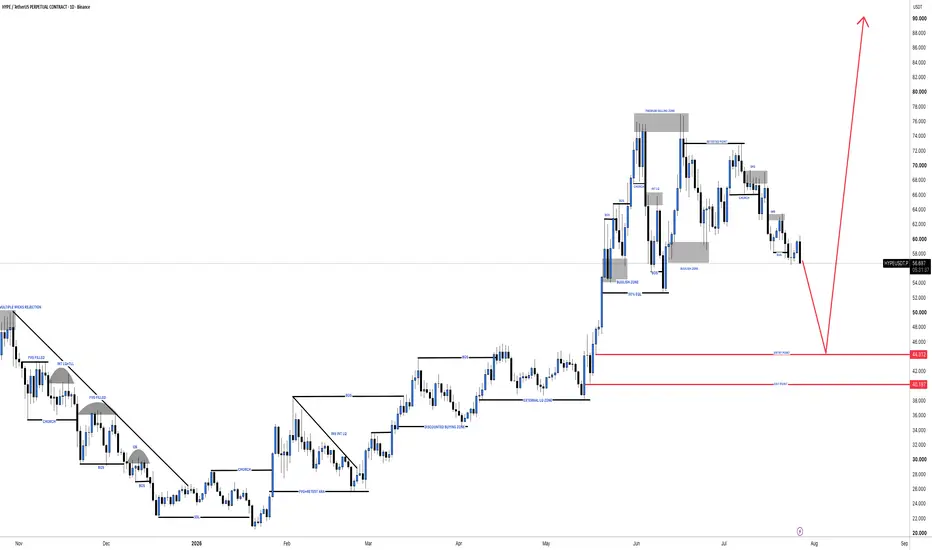
#HYPEUSDT: One More Push Down And Then Right Up! 🔺This crypto pair has been showing a fluctuating pattern and currently exhibits strong bearish behaviour. We anticipate a price drop until it reaches our entry point, where a powerful bullish reversal is expected to propel the price to 90 or higher.
🔺Our sole target remains but you can set intraday trading targets. An exit point is also in place so enter accordingly. We’re observing a surge in bullish volume which will likely drive the price to another record high.
Good luck and trade safely! ❤️
HYPE Weakness: Is a Deeper Drop Next…!Yello Paradisers! Are you prepared for a potential sharp downside move on #HYPE, or are you still calling this “just a healthy pullback” while smart money quietly distributes above you? At first glance, the structure may look harmless. But when we remove emotions and read the chart objectively, the story changes completely. This is not a random retracement. This is a high-risk zone where discipline matters more than opinions.
💎#HYPE has clearly broken below its ascending support trend line and is now retesting it from underneath. This rejection increases the probability that the previous bullish structure has weakened and the sellers are beginning to take control.
💎#HYPE broader market structure has also shifted toward the bearish side, adding further weight to the downside scenario. As long as price remains rejected within the order block and fair value gap zone, the probability continues to favour another move lower.
💎The first important support level is located around $53. If selling pressure continues, this area could act as the next downside magnet. A decisive break below it would further strengthen the bearish structure and expose lower price targets.
💎From Volume Spread Analysis perspective, the sequence is even more revealing. We saw a buying climax followed by a climactic action bar. This combination typically shows distribution. In simple terms, institutions use these aggressive spikes to offload positions into retail enthusiasm. When the crowd feels confident, smart money distributes quietly.
💎#HYPE also swept the upper trigger line of the buying climax and collected buy-side liquidity through an upthrust test. However, price failed to remain above that area and was followed by a candle closing below the lower trigger line.
💎#HYPE also witnessed a two-bar reversal near the upper trigger line. This is an important probability that supply is dominating demand. If bearish momentum continues, the next major downside target is located around $40, and the move could develop faster than many traders expect.
💎If #HYPE manages to break above the key resistance at 80.20 with a strong momentum candle, this whole bearish probability would be invalidated, and we could instead see a bullish continuation. As always, we let price confirm our bias.
Discipline is key, Paradisers! The charts may look volatile, but this is where professionals thrive and amateurs panic. Don’t let emotions guide your trades. Wait for clear confirmation and manage risk like a pro. Strive for consistency, not quick profits. Treat the market as a businessman, not as a gambler.
MyCryptoParadise
iFeel the success🌴
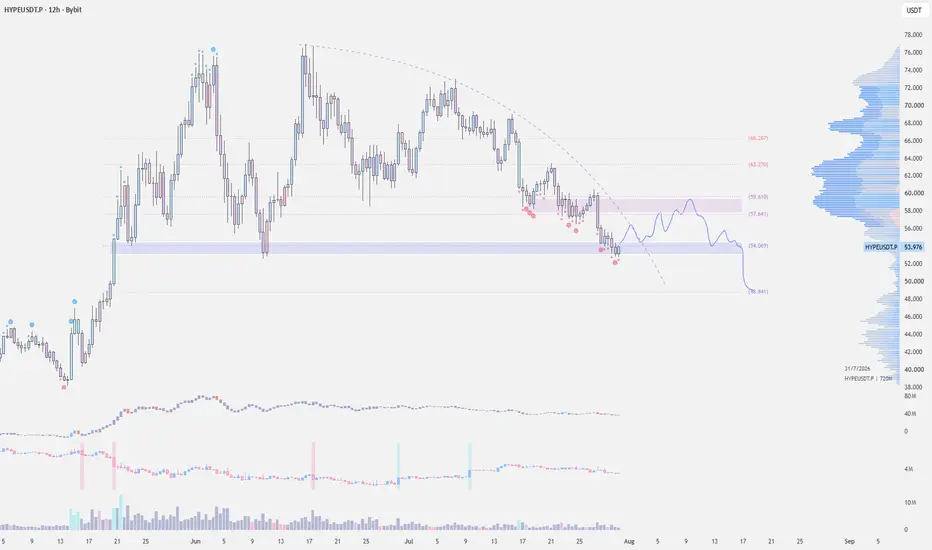
HYPEUSDT Structure Breakdown Could Trigger a Deeper CorrectionHYPEUSDT is showing signs of weakness after rejecting from a higher-timeframe supply zone. Price has completed a rounded-bottom recovery but is now testing a critical neckline support that also aligns with local market structure.
A confirmed daily close below the key decision level around $53.29 would strengthen the bearish outlook and could trigger a continuation move toward the primary demand zone near $26.00–$28.00.
As long as price remains below the HTF supply region, sellers retain the advantage. The neckline is the level to watch, holding above it may delay the decline, while a decisive breakdown would significantly increase the probability of the projected bearish scenario.
WESLAD Research™
Probability Over Prediction.
HYPE USDT LONG SIGNAL#8. .HYPE/USDT – Trade Setup (LONG)
📈 Position Type: LONG
🕒 Timeframe: 1H
📊 Market: Futures
💰 Entry Zone:
52.460
🛑 Stop-Loss:
51
🎯 Take-Profit Targets:
• TP1: 54
• TP2: 55.58
• TP3: 57.27
• TP4. 58.74
Tp5.
⚙️ Leverage:
5*10
▫️ After TP1, move SL to Entry + 0.2%.
▪️ Exit Plan:
• 40% at TP1
• 20% at TP2
• 20% at TP3
20% at TP4
📌 Risk Management:
Risk only 1–2% of your capital per trade.
⚠️ Always check and confirm the setup on your chart before entering the trade.
$HYPE - Can $50 Hold?After weeks of sustained selling, HYPE is approaching a decision point. KUCOIN:HYPEUSDT is trading into a high-confluence support area after deviating below the recent low.
I'd like to see $50 hold here and also CRYPTOCAP:BTC find a mechanical bounce at 61.5k–60.5k. If both conditions are met, KUCOIN:HYPEUSDT could see a rotation back into $57–60s region.
HYPE USDT LONG SIGNAL#148. HYPE/USDT – Trade Setup (LONG)
📈 Position Type: LONG
🕒 Timeframe: 1H
📊 Market: Futures
💰 Entry Zone:
54.265
53.053
🛑 Stop-Loss:
52.470
🎯 Take-Profit Targets:
• TP1: 56.
• TP2: 57.260
• TP3: 57.480
• TP4..59.729
⚙️ Leverage:
5 *10
▫️ After TP1, move SL to Entry + 0.2%.
▪️ Exit Plan:
• 50% at TP1
• 25% at TP2
• 25% at TP3
📌 Risk Management:
Risk only 1–2% of your capital per trade.
⚠️ Always check and confirm the setup on your chart before entering the trade.
$HYPE - Long Trade IdeaKUCOIN:HYPEUSDT is now retesting a key daily demand zone after an extended pullback. This is an area where I'd be watching closely for a bullish reaction.
If this daily demand continues to hold, it could offer a good scalp long opportunity targeting the 57–60 resistance area.
Plan:
* Watch for confirmation that buyers defend the current lows.
* Target: 57–60
* Invalidation: Stop just below the recent swing lows.
HYPE: Bulls Defend Major SupportPrimary trend under pressure
Hyperliquid has corrected almost 30% from its June all-time high, with the recent double top shifting momentum back in favour of the bears. Even so, price has now returned to a major weekly support zone around $53.00.
Moving averages turning weaker
The 21/8-week EMAs remain bullishly crossed, but price is now trading around the 21-week EMA and both averages have started to slope lower. A bearish crossover would further weaken the longer-term technical picture.
Support becomes the battleground
The $53.00 area has repeatedly acted as an important level, with buyers stepping in on several occasions. A sustained hold here would keep the broader bullish structure alive, while a decisive break could shift the focus towards the previous swing low around $38.17.
Momentum continues to weaken
Volume has declined steadily since the all-time high, while RSI is falling back towards the 50 level. StochRSI has already moved into oversold territory, suggesting downside momentum may be becoming stretched.
Recovery still possible
Despite the recent weakness, HYPE has a history of producing sharp reversals. Bulls now need to defend the current support area before attempting to rebuild momentum towards the recent highs.
In Summary
HYPE has entered an important technical area after falling around 30% from its all-time high. The $53.00 weekly support is now the key level to watch. While weakening momentum and rolling-over 21/8-week EMAs favour the bears in the short term, a successful defence of support could provide the foundation for another recovery.
Patience on HYPE, Opportunity on rAMZNPrice is trying to reclaim a broken trendline after weeks of selling pressure. A confirmed hold here could open the door toward the 59.8–60.2 resistance zone, while rejection keeps the broader downtrend intact.
I'm not rushing the trade.
At the same time, I'm closely watching rAMZN on Bitget ahead of Amazon's earnings. The biggest catalysts for me are AWS growth, AI spending, and Q3 guidance. Technically, 235.9 remains the key breakout level. A confirmed close above it could target 238 and 240+, while losing 232.9 would shift my focus toward 229.2 and 226.6.
With earnings released after the US market closes, I like being able to follow the reaction on Bitget rToken instead of waiting for the next trading session.
Between crypto setups and tokenized stocks, there's no need to force entries when better opportunities are developing elsewhere.
Patience is a position.
HYPE USDT LONG SIGNAL#135. HYPE/USDT – Trade Setup (LONG)
📈 Position Type: LONG
🕒 Timeframe: 1H
📊 Market: Futures
💰 Entry Zone:
53.56
🛑 Stop-Loss:
52.30
🎯 Take-Profit Targets:
• TP1: 54.704
• TP2: 56.192
• TP3: 57.88
• TP4
⚙️ Leverage:
5 *10
▫️ After TP1, move SL to Entry + 0.2%.
▪️ Exit Plan:
• 50% at TP1
• 25% at TP2
• 25% at TP3
📌 Risk Management:
Risk only 1–2% of your capital per trade.
⚠️ Always check and confirm the setup on your chart before entering the trade.
HYPEUSDT Technical Analysis (4H)www.tradingview.com
HYPEUSDT 4H: Bears Still Control, But Major Support Is Being Tested
HYPE remains in a clear short-term downtrend, printing a series of lower highs and lower lows after failing to reclaim the $63 resistance zone. Multiple Break of Structure (BoS) signals confirm that sellers continue to dominate market structure.
The recent decline has brought price into a key confluence area around $57.20-$56.45, where horizontal support aligns with the rising long-term trendline. This is an important decision zone. As long as buyers defend it, a relief bounce remains possible.
Key Levels
Support
$57.20 (immediate support)
$56.45 (major trendline support)
Below $56.45 could accelerate selling toward the mid-$54 region.
Resistance
$59.98 (first recovery hurdle)
$60.20 (strong supply zone)
$63.05 (major breakout resistance)
Bullish Scenario
If HYPE holds above $56.45 and buyers reclaim $59.98, momentum could shift toward $60.20, with $63.05 becoming the next upside objective.
Bearish Scenario
A confirmed 4H close below $56.45 would invalidate the current support structure and likely trigger another leg lower as bearish market structure remains intact.
Outlook
The trend still favors sellers, but price is sitting at a technically significant support cluster. Watch for volume confirmation and a strong bullish reversal candle before considering a trend reversal. Until resistance is reclaimed, rallies may continue to face selling pressure.
Bias: Bearish to Neutral
Invalidation: Sustained reclaim above $60.20
Confirmation: Breakdown below $56.45 or breakout above $59.98.
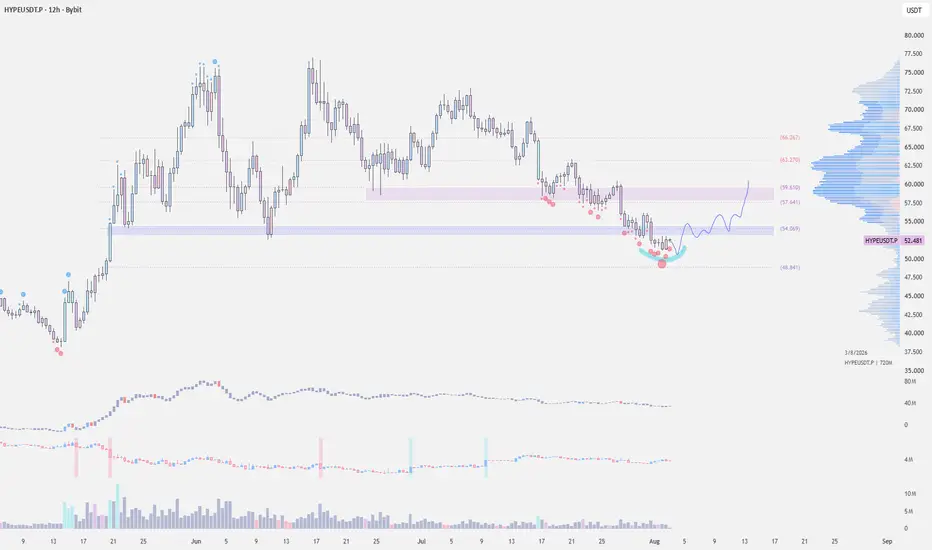
HYPE 4H Level Map — 53.0–53.6 Reclaim vs 51.1 DemandHYPE is attempting to reclaim 53.0–53.6 after defending 51.1–52.0. Confirmed 4H acceptance above 53.6 keeps 55.7 in play. Failure back below the reclaim zone returns focus to demand.
A 4H close below 51.1 invalidates the bounce map and opens 49.0. The broader daily structure remains weak, so this is a scenario map—not a bullish prediction.
At publication, Bybit perpetual funding is near neutral at 0.01%, while 24h open interest is broadly flat. Derivatives do not show clear long crowding.
Maps, not predictions.
HYPE/USDT — Testing Demand Zone, Potential Move Toward $62.5HYPE/USDT — Testing Demand Zone, Potential Move Toward $62.5
HYPE has corrected roughly 30% from the June high ($76.8) and is currently testing a key demand zone around $52 — the origin of the late-May breakout and a prior high-volume node. The pullback has been orderly, forming lower highs at $74, $72, $68 and $63.45, which points to a trend correction rather than capitulation.
Key levels:
Demand zone: $47.60–52.30
Current price: ~$52.00
Upside objective: $62.50
Major resistance: $63.45 (late-July swing high)
Reward-to-risk of the scenario: approx. 2.4:1
Technical context:
The $52 area carries multiple layers of confluence — a psychological level, prior resistance turned support from the May breakout leg, and the lower boundary of the descending channel from June. The $62.50 level aligns with the EMA cluster acting as the bull/bear pivot and sits just below the $63.45 swing high, marking the first significant supply area.
Invalidation:
An hourly close below $47.60 would break the demand zone and expose the $44–46 region (May consolidation). The 1H structure remains a downtrend until price reclaims the $56–58 area, the last lower high — until then, the bullish scenario is counter-trend.
Fundamental backdrop:
97–99% of protocol fees are directed into HYPE buybacks; roughly 210k HYPE repurchased over the past week, $1.16B cumulative — a structural bid under the price
HIP-4 permissionless prediction markets launched on testnet, processing 6.05M contracts on day one and matching Polymarket's two-week BTC volume within 48 hours
ETF products (21Shares, Bitwise, Grayscale) hold cumulative net inflows of ~$288M, although July recorded the first monthly outflow
Hyperliquid's tokenized RWA volume now exceeds all other crypto categories combined
Bigger picture:
A reclaim of $63.45 would open the moderate year-end path toward $80–90, with intermediate levels at $68, $72–74 and the $76.8 ATH area.
This is a market analysis, not financial advice.
$HYPE - CVD Bullish DivergenceKUCOIN:HYPEUSDT rejected at our 63–64s pivot and sold off into 57s.
Price is still struggling to hold this level to validate the retest, though I'm seeing some bullish divergence on cvd on the 4-hour.
If you're still looking to play this, watch the 61–62s. If price fails to break above it and CRYPTOCAP:BTC can't reclaim 66k, then take profit.
HYPE: Another 10% Drop Expected If First Daily Trendline BreaksHi,
For HYPERLIQUID, I’m expecting at least another 10% drop toward the second daily trendline if the first trendline is lost. My target is $53.
Need a little love!
We pour love into every post your support keeps us inspired! Don’t be shy, we’d love to hear from you on comments. Big thanks
HYPE 1D – Sharp Drop Into Rising Trendline SupportHYPE on the 1D timeframe is currently trading around 58.635 after a sharp decline from the late June high near 77.500, with price now pressing directly into the rising trendline that has defined every significant low since the January bottom near 20.000 and is currently climbing into the 56.000–58.000 area.
The chart shows a rising trendline originating from the January low near 20.000, connecting the February low near 26.500, the April low near 26.500, and the May low near 39.000 before price broke aggressively higher into June, reaching a high near 77.500. That trendline has been the macro support floor across the entire visible structure, with each prior touch producing a significant rally. The most recent touch in late May near 39.000–41.000 launched price into the strongest rally of the cycle, pushing from the trendline all the way to 77.500 before sellers took over. The current decline from that high has been steep and uninterrupted, dropping through the 72.500, 68.500, 64.500, and 60.500 levels without a meaningful bounce, and is now compressing directly into the rising trendline near 56.000–58.000. The horizontal level near 58.500–60.500 has emerged as a short-term reference through the current consolidation zone.
Every prior touch of this trendline across six months has produced a significant rally, making the current test the most watched level on this chart, particularly given the velocity of the decline that has brought price here.
Key Levels To Watch
→ 75.000–77.500 – June high, major resistance above
→ 68.500–70.000 – Prior consolidation zone, resistance
→ 64.000–65.000 – Mid-range resistance zone
→ 60.500–62.000 – Broken horizontal support, now resistance
→ 58.500–60.500 – Current price zone, short-term pivot
→ 56.000–58.000 – Rising trendline, current test (dynamic, climbing)
→ Below 52.500 – Trendline breakdown, macro structure at risk
A hold at the rising trendline near 56.000–58.000 and a recovery back above 60.500–62.000 would keep the macro structure that has defined every low since January intact and set up a potential push back toward 64.000–65.000 and the June high region above.
A confirmed daily close below the rising trendline near 56.000 would be the first macro structural break since January, removing the trendline that has held every significant low on this chart and opening downside toward 52.500 and potentially lower with no clear horizontal support beneath.
Every prior trendline touch produced a major rally, this is the most critical test since January. Hold 56.000–58.000 → macro structure intact, recovery open toward 60.500–65.000. Lose trendline on confirmed daily close → first macro break since January, downside toward 52.500 and below. Bias cautiously bullish at trendline. Shift only on confirmed daily close below 56.000–58.000.
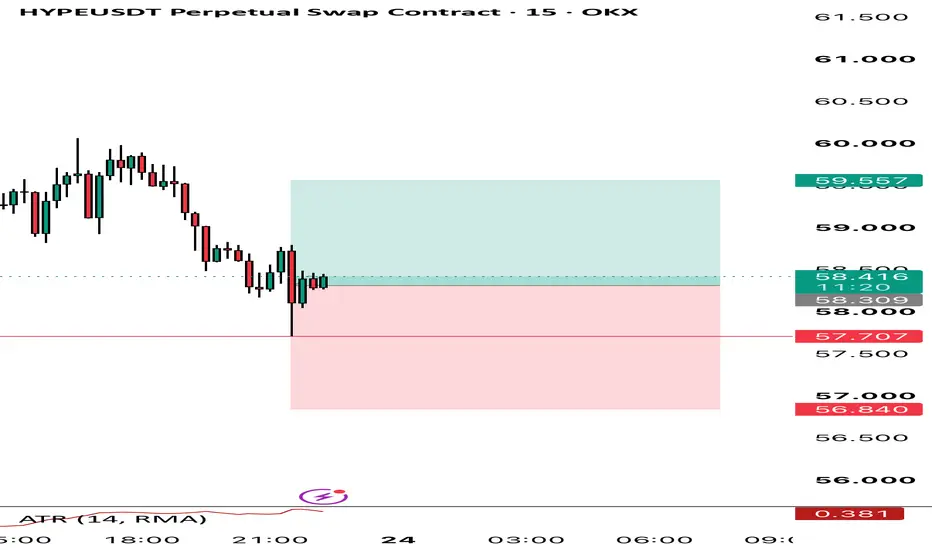
HYPE#107 HYPE/USDT – Trade Setup (LONG)
📈 Position Type: LONG
🕒 Timeframe: 1H
📊 Market: Futures
💰 Entry Zone:
58.70
56.880
🛑 Stop-Loss:
55.695
🎯 Take-Profit Targets:
• TP1: 60.200
• TP2: 62.630
• TP3: 65.144
• TP4: 68
⚙️ Leverage:
5 *10
▫️ After TP1, move SL to Entry + 0.2%.
▪️ Exit Plan:
• 40% at TP1
• 20% at TP2
• 20% at TP3
20% at. TP4
📌 Risk Management:
Risk only 1–2% of your capital per trade.
⚠️ Always check and confirm the setup on your chart before entering the trad