White Sugar Futures - Bullish build upThis one almost looks too good to be true.
We have a long term, downward triangle pattern, been broken out of, with volume building, and now a beautiful bullish flag formed.
I would expect one last little liquidity sweep to occur to that higlighted box, followed by a continuation movement to the u
Peers for comparison
General info
ISIN
GB00NSCMJB14
FIGI
BBG026R6L132
Identifiers
ISIN GB00NSCMJB14
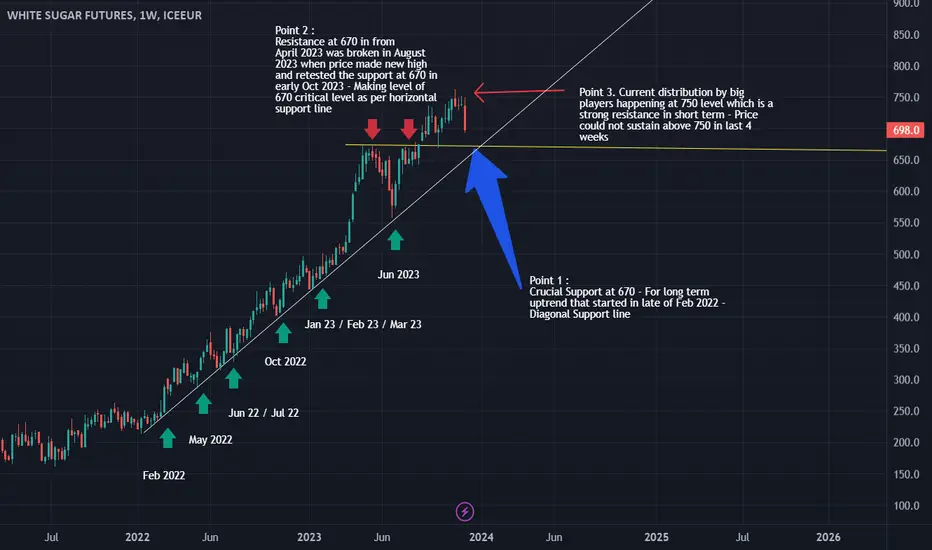
Time to cut down on Sugar ?Weekly Analysis : White Sugar - Read in Sequence Point 1, 2 & 3. Long term bullish trend is still intact as market is making new highs and new lows on weekly chart. However, the current rally above 670 resistance zone in late August 2023 seems to be losing steam as there is severe distribution happ
See all ideas
A representation of what an asset is worth today and what the market thinks it will be worth in the future.
Displays a symbol's price movements over previous years to identify recurring trends.
Frequently asked questions
Today, WV2029 trades at 468.4 USD.
For broader market analysis, dive into the technicals on the WV2029 futures price chart and read the latest WV2029 news:
– AGS WEEK AHEAD: Higher Dollar Weighs on Grain Prices
– Indonesia's 2026 white sugar output expected to reach 2.8 million tons, agriculture ministry says
– Diwali sweet boxes faces inflation bite as sugar prices surge 30%
For broader market analysis, dive into the technicals on the WV2029 futures price chart and read the latest WV2029 news:
– AGS WEEK AHEAD: Higher Dollar Weighs on Grain Prices
– Indonesia's 2026 white sugar output expected to reach 2.8 million tons, agriculture ministry says
– Diwali sweet boxes faces inflation bite as sugar prices surge 30%
WV2029 volume is the number of futures contracts traded over a given period. The current volume is 0.00.
This metric helps you understand market activity and liquidity:
– Higher volume indicates strong interest and easier trade execution
– Lower volume may signal weaker participation and wider spreads
Traders often use volume to confirm trends and identify potential reversals. Track more movements on the WV2029 chart.
This metric helps you understand market activity and liquidity:
– Higher volume indicates strong interest and easier trade execution
– Lower volume may signal weaker participation and wider spreads
Traders often use volume to confirm trends and identify potential reversals. Track more movements on the WV2029 chart.
One way to gain exposure to WV2029 is through a broker that offers futures. Before trading, make sure you understand how the product works and the risks involved.
You can trade WV2029 directly from TradingView:
– Choose a broker: Explore our supported trading partners and pick one that fits your needs
– Compare options: View available brokers side by side to evaluate fees and features
– Connect your account: Open Supercharts, click "Trade", select your broker, and log in
– Start trading: Place orders directly from the chart
Tip: If you're new to trading, try paper trading first — it lets you practice strategies in real market conditions without risking funds.
You can trade WV2029 directly from TradingView:
– Choose a broker: Explore our supported trading partners and pick one that fits your needs
– Compare options: View available brokers side by side to evaluate fees and features
– Connect your account: Open Supercharts, click "Trade", select your broker, and log in
– Start trading: Place orders directly from the chart
Tip: If you're new to trading, try paper trading first — it lets you practice strategies in real market conditions without risking funds.
The nearest expiration date for WV2029 is Sep 14, 2029.
Futures contracts expire on predetermined dates. As expiration approaches, many traders roll positions into the next contract to maintain exposure to the market.
Key metrics to watch near expiration:
• Volume and liquidity: Trading activity often shifts to the next contract month
• Open interest: Falling open interest may signal positions being closed or rolled forward
• Forward curve: Differences between contract prices can help identify market structure, including contango and backwardation
Explore the WV2029 chart to monitor active contracts and contract-month activity.
Futures contracts expire on predetermined dates. As expiration approaches, many traders roll positions into the next contract to maintain exposure to the market.
Key metrics to watch near expiration:
• Volume and liquidity: Trading activity often shifts to the next contract month
• Open interest: Falling open interest may signal positions being closed or rolled forward
• Forward curve: Differences between contract prices can help identify market structure, including contango and backwardation
Explore the WV2029 chart to monitor active contracts and contract-month activity.