Dollar Index (DXY) Double Three Rally Likely to Break LowerThe short‑term Elliott Wave view in the Dollar Index (DXY) indicates that the Index is correcting the cycle from the June 24, 2026 high within a double three structure. From the August 20, 2026 low, wave ((w)) concluded at 99.86. The subsequent pullback in wave ((x)) unfolded as a zigzag formation, where wave (a) terminated at 98.83 and wave (b) ended at 99.39. A final decline in wave (c) reached 98.58, completing wave ((x)) at a higher degree. Following this, the Index turned upward in wave ((y)), which is developing internally as another zigzag structure.
From wave ((x)), wave (a) advanced to 99.36, while the corrective pullback in wave (b) settled at 98.96. The Index has since resumed its upward trajectory, and as long as price remains above 98.58, the near‑term outlook favors further strength. The projected target aligns with the 100%–161.8% Fibonacci extension measured from the August 20 low. This extension defines a zone between 99.9 and 100.7, which serves as a potential area where sellers may emerge. Within this region, the Index could produce a three‑wave pullback or initiate a broader corrective phase to the downside.
Overall, the structure highlights a corrective sequence that remains constructive above 98.58. The unfolding zigzag in wave ((y)) suggests that buyers retain control in the short term, though the identified resistance zone should be monitored closely for signs of exhaustion.
US Dollar Index® Futures
No trades
No trades
In-depth trading ideas
U.S. Dollar Index Futures (DXY) – 1H Technical AnalysisMarket Structure
The DXY is showing a potential bullish reversal structure after the sharp decline from the 101.48 area.
Price formed a significant base around 98.685, followed by a sequence of higher lows. The latest move has pushed price back toward the descending trendline, creating a critical decision point.
🔑 Key Levels
🟢 Current Price
99.685
Resistance
99.825 – immediate resistance
100.595 – major resistance / T1
101.070–101.130 – major supply zone / T2
101.480 – previous major swing high
Support
99.00–99.20 – short-term support
98.685 – major structural support and bearish invalidation
🟢 Bullish Scenario
The chart shows price attempting to break the descending trendline.
A confirmed 1H close above the trendline, followed by a successful retest, would strengthen the bullish reversal structure.
Targets:
Entry: 99.65–99.70
TP1: 100.595
TP2: 101.070–101.130
TP3: 101.480
The move toward 100.595 is particularly important because it represents the first major resistance and the projected D point of the harmonic structure shown on the chart.
🔴 Bearish Scenario
The bullish setup would weaken if DXY fails to break the trendline and gets rejected from the 99.80–100.00 region.
A break below the recent higher-low structure could send price toward:
99.00 → 98.685
A decisive break below 98.685 would invalidate the bullish reversal structure and reopen the broader downside trend.
📐 Harmonic Structure
The chart appears to be developing a potential bullish XABCD structure, with:
X: ~101.48
A: ~98.68
B: ~99.80
D projection: ~100.595
Extension target: 101.07–101.13
The 1.618 extension shown on the chart supports the projected upside toward the 101.07–101.13 region.
🎯 TradingView Setup
DXY LONG IDEA
Entry: 99.65–99.70
Confirmation: Break & retest of descending trendline
TP1: 100.595
TP2: 101.070–101.130
TP3: 101.480
Structural SL: 98.685
⚠️ Important
The 99.80–100.00 area is the immediate test. A rejection there would indicate that the trendline breakout has not been confirmed.
📌 TradingView Summary
DXY is attempting a bullish reversal from the 98.685 base. A confirmed breakout above the descending trendline could open the way toward 100.595, followed by 101.070–101.130. Failure to break the trendline and a move back below the recent higher-low structure would expose 98.685.
Key relationship: A sustained DXY recovery can also create headwinds for Gold (XAU/USD), so the 99.80–100.00 reaction zone is particularly important when monitoring your gold bearish setup.
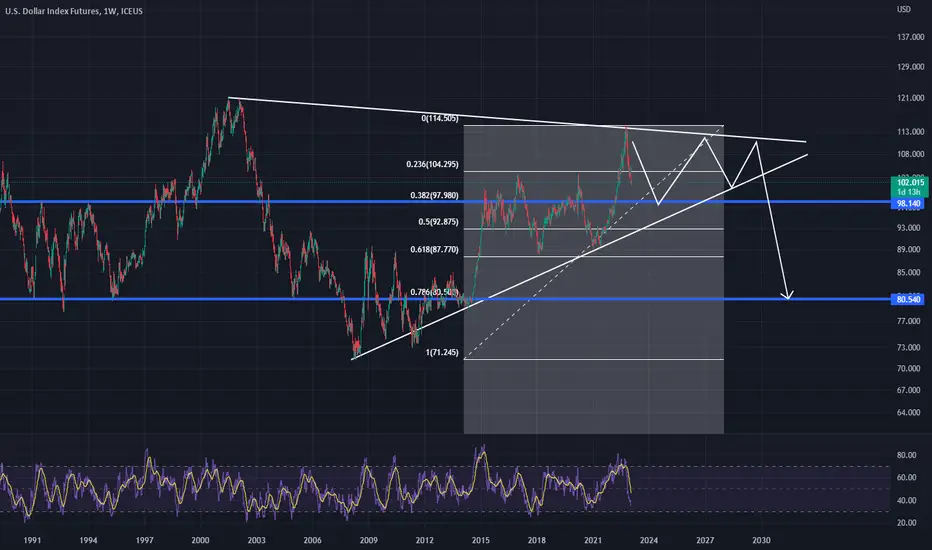
Weekly Rising Wedge On DXYThis looks to be bearish structure. Wanted to check against the community to ask for other opinions. Trend lines are valid.
Little more pump before the DXY drops off into the Low 80s?
Rsi indicated another pump to the top of the wedge, but I could see it falling through after that.
Comment!
Not financial Advice. I am a hobbyist.
USD Bulls Case Builds - Though NFP Decides Its FateWith Fed fund futures implying a 54% chance of a September hike, today's NFP report could decide which side of 50% those odds shift by the weekly close. The US dollar has been battered but showing signs of promise around support - so I take a closer look at the dollar index, NFP data and a high-level view of FX majors.
MS
DXY — same date, same reversal, two years runningThe Dollar Index has done something specific on the same date, twice running. July 1, 2024 — reversal. July 1, 2025 — reversal. The vertical lines on this chart mark both of those turns.
Two data points is a coincidence. But the setup around this year's July 1 is worth noting anyway.
The calendar is loaded. Independence Day sits immediately after, compressing trading. NFP and the broader employment picture follow on the other side of the holiday. That's the kind of schedule where positioning tends to shift before the data, not after.
Non-commercial net on the dollar recently flipped back into the green — you can see it on the histogram below. Speculators leaned back in.
Over in the yen, the picture is different. JPY speculative longs have stacked up near multi-year extremes. Crowded trades don't stay crowded. If something — a policy signal, an intervention hint, a surprise print — starts the unwind, USD/JPY can reprice quickly. And when USD/JPY moves fast, it doesn't stay quiet elsewhere in FX.
I'm not calling a direction. The pattern is two events, not a law. But watching whether DXY holds the 101 area into next week, and whether JPY positioning starts to lighten — those two threads together say more than either one alone.
Not financial advice — just how I'm reading it. Manage your risk.
$DXY Year long range finally pressing the topBox runs $95.79 to $100.36.
Price has broken out the top and is now testing the May 2025 ceiling at $101.57.
One level decides this and it's the resistance at $101.57.
Daily close above $101.57 on volume opens the measured move.
Range height projects a target near $104.94.
No close above, and this is just a poke into supply. Fade back below $100.36 puts price back in the box and kills the breakout.
Watching this closely.
A confirmed dollar breakout is a headwind for the debasement trade.
Not what AMEX:GLD , AMEX:SLV or CRYPTOCAP:BTC want to see here.
I'm long TVC:DXY above $101.57. Setup Invalidates below $100.36.
AUD/USD Holds 70c For Now, Key Data AwaitsAUD/USD is called "the battler" with good reason, and it showed resilience last week despite a hawkish Fed meeting, stronger US dollar and less-hawkish than expected RBA. Perhaps it can perform a bounce from 70c this week? But whether it does or how high it can, sits in the hands of AU CPI, employment and household spending alongside US PCE inflation.
MS
US DOLLAR INDEX GAP FILLED WAR TRADE IS BACK!Bullish- seems like everytime Oil bounces the US Dollar becomes a safe haven for the war. Therefore because Oil still holding support levels and making new highs I am bullish the dollar. But even if Oil falls that is also bullish the dollar because lower export demand and commodities and dollar have inverse relationship. As I mentioned in last post gaps normally get filled and look what just happened! So therefore the war trade continues for now and the War Trade in my opinion is Buy Oil, Buy Commodities, Buy US Dollar, Short Bonds, Bearish Stocks short term.
Bearish- Nope not right now another reason is because too many inflation fears right now. Also the FED is not talking right now about cutting interest rates. But if bond market were to get rush in buying we could see dollar top quick so always expect the unexpected when trading. Always keep a bullish and bearish bias because sometimes things can change quick in this business. At first I thought the gap not being filled was bearish market rallied to fill gap but the war trade is too strong right now to get bearish.
Commitment of Traders- The Non Commericals (Large Specs) are nuetral so nothing much going on right now. But the small specs retail traders are slightly long by 2,174 contracts but they are also notorious for getting things wrong. Think of this report as going against the grain meaning if you see The Large Specs really overcrowded in one direction long or short you want to place the opposite trade. Example if everyone is Long US dollar you want to look for a short trade signal because when they unwind the move will be big! If everyone if Short the US Dollar you want to look for long trade opportunity because when they unwind it will explode to the upside!
Good Luck & Always use Risk Management!
(Just in we are wrong in our analysis most experts recommend never to risk more than 2% of your account equity on any given trade.)
Hope This Helps Your Trading
Clifford
RISK DISCLOSURE
TRADING IN THE FUTURES AND FOREX MARKET INVOLVES SIGNIFICANT RISK. ALWAYS CONSULT A FINANCIAL ADVISOR AS HIGH RISK ASSET CLASSES MAY NOT BE SUITABLE FOR ALL INVESTORS. THIS IS NOT A RECOMMENDATION TO BUY OR SELL ANY ASSETS. ALL IDEAS ARE MADE FOR EDUCATIONAL PURPOSES. PAST PERFORMANCE DOES NOT GUARANTEE FUTURE RESULTS.
CFTC RULE 4.41 – HYPOTHETICAL OR SIMULATED PERFORMANCE RESULTS HAVE CERTAIN LIMITATIONS. UNLIKE AN ACTUAL PERFORMANCE RECORD, SIMULATED RESULTS DO NOT REPRESENT ACTUAL TRADING.
DXY Is Trapped Below Major ResistanceThe US Dollar Index is currently sitting at one of the most important decision zones of the entire year. After reacting aggressively from the weekly demand area between 94.50 and 97.20, price managed to recover short-term momentum, but structurally the market still looks vulnerable.
From a technical perspective, DXY continues to respect the descending trendline coming from the April highs. The recent rebound appears corrective rather than impulsive, and price is now approaching a key daily imbalance/FVG area around 98.50–98.90. This zone will likely determine the next macro move.
As long as the dollar remains below this resistance cluster, I continue to favor a bearish continuation scenario targeting 97.20 first, followed by a possible revisit of the 95.50 weekly demand area.
The COT data still supports this cautious outlook. Non-commercial traders remain slightly net short on the dollar:
Long positions: 21,403
Short positions: 21,882
At the same time, Open Interest increased significantly (+8,518), signaling fresh positioning and growing participation. This usually precedes expansion in volatility, meaning the market could soon deliver a stronger directional move.
Seasonality adds another layer to the analysis. Historically, May tends to be moderately positive for DXY on a 10Y and 15Y basis, but shorter-term seasonal flows (2Y) remain clearly bearish. Even more important, the broader yearly seasonal tendency points toward weakness during the summer months, especially from June into August.
My focus now is entirely on how price reacts inside the current daily imbalance:
Rejection from this area would confirm bearish continuation.
A clean weekly reclaim above 99.50 would invalidate the bearish structure and open the path toward 100.50 and potentially 101.70.
USD $ Has A Decision To Make - More Upside Or A False Breakout🌎SeekingPips🌍 has been bullish the US Dollar for the past few weeks and dip traded to at 97.800 we were buying.
However we didn't trade It directly rather we were selling both the GBPUSD and EURUSD.
Now we sit down and stalk the neck move.
We are waiting to see what happens at an old weekly high.
So far looks like it holds BUT YOU must pay attention and be aware of a deeper retracement than it currently has done.
[
b]Our current upside target obvious 100 and 100.500 after that. So the last 240min swing high would need to break and price would have to continue to make new higher high and lows.
If this proves a false breakout then there is not strong support and price could easily test the gre zone again. In this case we would be watching price very closely looking for a potential Buy signal after the flush.
HOW TO TRADE THE GRAND CUP 2 PROP FIRM TOURNAMENT! Hey Traders Happy Saturday just wanted to make a quick video about how we should all enter this tournament. Its a great way to learn about prop firms at the same time you will learn what it takes to trade under pressure. Its free for everyone so I just signed up I think today is last day. This is a futures prop firm trading tournament but you can trade multiple products and even use tradingview for the platform which is great.
I will be keeping everyone updated on trading view how the progression of the tournament goes.
Good Luck to all of us and may the best outlaw win! 😁
Good Luck & Always use Risk Management!
(Just in we are wrong in our analysis most experts recommend never to risk more than 2% of your account equity on any given trade.)
Hope This Helps Your Trading
Clifford
RISK DISCLOSURE
TRADING IN THE FUTURES AND FOREX MARKET INVOLVES SIGNIFICANT RISK. ALWAYS CONSULT A FINANCIAL ADVISOR AS HIGH RISK ASSET CLASSES MAY NOT BE SUITABLE FOR ALL INVESTORS. THIS IS NOT A RECOMMENDATION TO BUY OR SELL ANY ASSETS. ALL IDEAS ARE MADE FOR EDUCATIONAL PURPOSES. PAST PERFORMANCE DOES NOT GUARANTEE FUTURE RESULTS.
CFTC RULE 4.41 – HYPOTHETICAL OR SIMULATED PERFORMANCE RESULTS HAVE CERTAIN LIMITATIONS. UNLIKE AN ACTUAL PERFORMANCE RECORD, SIMULATED RESULTS DO NOT REPRESENT ACTUAL TRADING.
THE US DOLLAR 123 TOP FORMATION CONFIRMED!Bullish- As mentioned in my Monday Morning Market Open Video US Dollar is topping so I think the decline will continue. It has daily close below support at 98.67. This is not a bullish at all but if you are bullish I would wait until a break above resistance at 99.99 before considering buying a pullback.
Bearish- Yes 100% bears are in control right now although the FED didn't indicate rate hikes in the future. They said they are going to wait and see on the data. So unless inflation scares happen again with Oil then I think the selling will continue. But I don't think we should short just yet!
Why?
Look closely at the gap on the chart. There is an old saying in trading and that is when you see a gap it normally gets filled! Now of course I am not and cannot guarantee the gap will get filled but a large percentage of the do! So I say wait to a rise back 99.40 then short it with stop above resistance at 100.50 or go long the Euro when it pulls back.
Commitment of Traders- they are slightly bullish long 4500 contracts so they are not overcrowed bullish but if they do get overcrowded bullish that is even more of a reason to go against the them because if they are overcrowded to the long side eventually the buyers dry up and there is no one else left to buy. What happens then they all have to start selling to get out!
Good Luck & Always use Risk Management!
(Just in we are wrong in our analysis most experts recommend never to risk more than 2% of your account equity on any given trade.)
Hope This Helps Your Trading 😃
Clifford
RISK DISCLOSURE
TRADING IN THE FUTURES AND FOREX MARKET INVOLVES SIGNIFICANT RISK. ALWAYS CONSULT A FINANCIAL ADVISOR AS HIGH RISK ASSET CLASSES MAY NOT BE SUITABLE FOR ALL INVESTORS. THIS IS NOT A RECOMMENDATION TO BUY OR SELL ANY ASSETS. ALL IDEAS ARE MADE FOR EDUCATIONAL PURPOSES. PAST PERFORMANCE DOES NOT GUARANTEE FUTURE RESULTS.
CFTC RULE 4.41 – HYPOTHETICAL OR SIMULATED PERFORMANCE RESULTS HAVE CERTAIN LIMITATIONS. UNLIKE AN ACTUAL PERFORMANCE RECORD, SIMULATED RESULTS DO NOT REPRESENT ACTUAL TRADING.
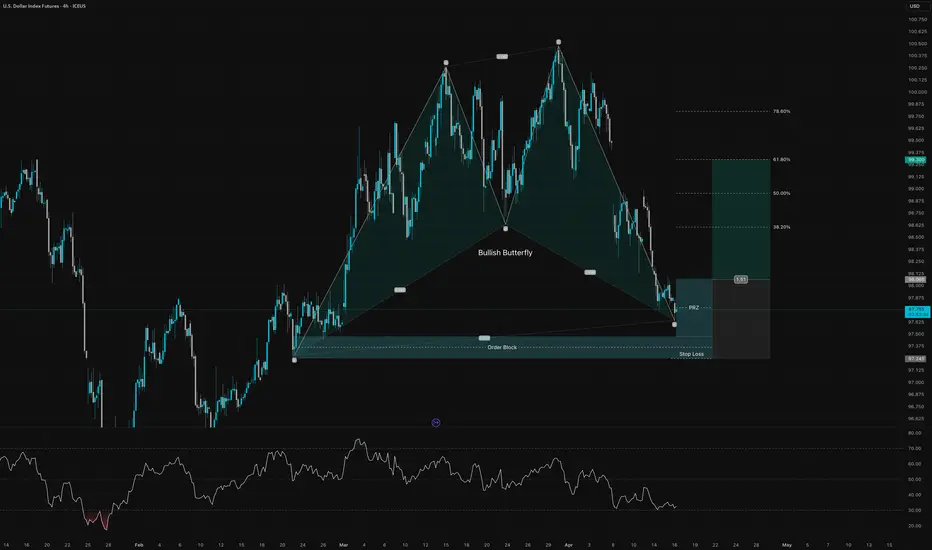
U.S. Dollar Index Future Bullish ButterflyOn the 4H chart, U.S. Dollar Index Futures are approaching a technically important reaction zone after completing a Bullish Butterfly harmonic pattern. The pattern terminates inside a well-defined PRZ (Potential Reversal Zone) around the 97.60–97.25 area, which also overlaps with a prior order block. This confluence makes the current region highly relevant for a possible bullish reaction.
After the strong selloff from the recent highs, price has now reached a zone where downside momentum may start to fade. In addition, RSI is trading in a weak area, suggesting the market is already stretched on the downside. That does not guarantee an immediate reversal, but it does support the idea that sellers may be losing momentum near support.
As long as price holds above the lower boundary of the PRZ and the stop-loss area around 97.25, a recovery move toward the next Fibonacci retracement levels becomes increasingly likely. The first upside targets are located near the 38.2% retracement, followed by the 50.0% and 61.8% levels, with the latter sitting around 99.30 and acting as the main bullish target in this setup.
The bullish idea would be invalidated by a clear break below the PRZ and stop-loss zone, as that would suggest the harmonic support has failed and sellers remain in full control.
Overall, this is a countertrend bullish setup inside a larger bearish move, so confirmation through price action is important. If buyers defend the PRZ, the chart offers an attractive rebound opportunity with a favorable risk-to-reward structure.
USD Index - Potential Bearish Reversal Following ABCD Pattern1. Technical Context:
The USD Index has rallied for four consecutive sessions, recovering from a prior swing low. This recovery has formed a clear harmonic pattern.
2. Pattern & Fibonacci Analysis:
A bullish ABCD pattern is identified on the lower time frame, with its terminal point (D) completing at the exact 0.618 Fibonacci retracement of the preceding down leg. This constitutes a classic pattern completion signal.
The subsequent rally from point D is now testing a Fibonacci resistance cluster at the 0.382 extension level .
3. Interpretation & Bias:
While momentum is currently near-term bullish, the confluence of a completed harmonic pattern at a key Fibonacci retracement provides a compelling potential reversal map. The structure suggests the rally may be corrective (wave B), increasing the probability for a resumption of the prior downtrend (wave C). The setup favors monitoring for bearish price action at the noted resistance for a short entry opportunity.
4. Key Levels:
Resistance Zone: 0.382 Fib Extension
Pattern Invalidation: A sustained break above the 0.618 extension level.
Confirmation: Requires bearish reversal candlesticks or momentum divergence at resistance.
US Dollar Index – Temporary Relief Before Further Downside?The US Dollar Index continues to trade under structural pressure on the daily chart, following the strong downside impulse that broke November’s value area and pushed price into a key weekly demand zone around 97.90–97.30. After a clear momentum swing lower, the index is now showing early signs of corrective strength, but the broader context continues to favor weakness into year-end.
On the technical side, price has reacted from support and is attempting a corrective retracement toward the 98.75–99.00 supply zone. This zone aligns with:
– Daily bearish trendline resistance
– A fresh Fair Value Gap (FVG)
– Previous structure imbalance
If price completes this pullback, the zone provides a high-probability region for bearish continuation targeting new lows into 97.50–97.20. The RSI remains below the midline, indicating momentum has not fully shifted to the upside and that current strength is corrective, not impulsive.
Seasonality reinforces this bearish narrative. December historically records negative averages in the Dollar Index across virtually every timeframe. The 20-year average in particular shows strong downward pressure late in the month, with typical weakness accelerating into year-end. Current price action is consistent with this seasonal pattern.
From a positioning standpoint, the latest COT report shows Non-Commercial traders significantly net short, with shorts sitting at 28,652 vs. longs at 14,778. This imbalance continues to reflect confidence in downside continuation. At the same time, the Commercial category reduced long exposure and increased shorts, adding further weight to bearish bias. The aggregate positioning structure is clearly aligned with the existing downtrend.
Overall, the Dollar Index remains structurally bearish. A final upside correction into the 98.75–99.00 supply zone could precede the next leg lower. Only a clean break and close above 99.20 would weaken the bear case and signal a potential shift in directional bias. Until then, rallies remain sell-side opportunities.
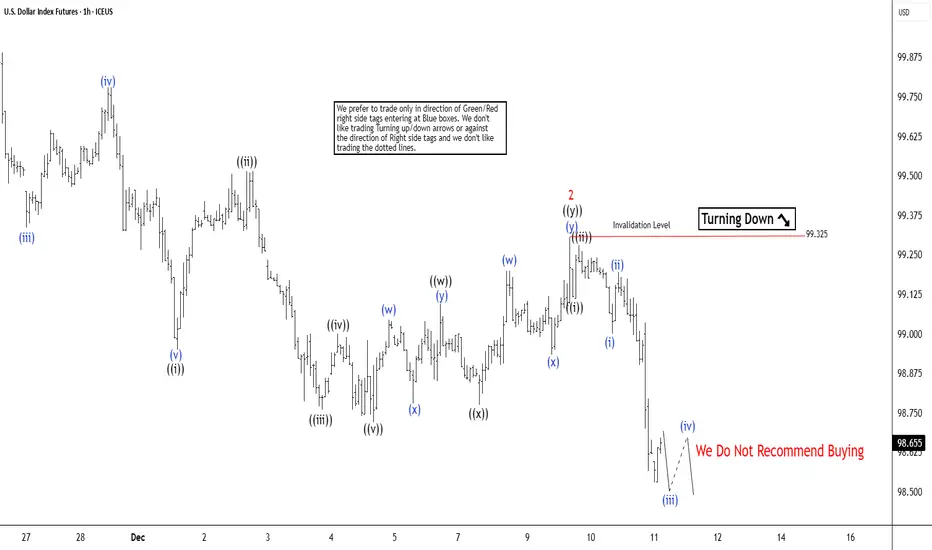
Dollar Index (DXY) Bearish Sequence Targets 97.7The Dollar Index (DXY) has broken decisively below the December 4 low at 98.76, establishing a clear bearish sequence from the November 21 peak. This structural decline favors continued downside momentum. The immediate target is the 100% Fibonacci extension measured from the November 21 peak, which projects toward 97.7. From that peak, wave ((i)) concluded at 99, followed by a corrective rally in wave ((ii)) that terminated at 99.56. The Index then extended lower in wave ((iii)) toward 98.82, while the subsequent rally in wave ((iv)) ended at 99.02. The final leg, wave ((v)), reached 98.76, thereby completing wave 1 of a higher degree cycle.
Following this initial decline, the Index staged a corrective advance in wave 2, unfolding as a double three Elliott Wave structure. From the termination of wave 1, wave ((w)) ended at 99.12, while the pullback in wave ((x)) concluded at 98.79. A final push higher in wave ((y)) reached 99.32, completing wave 2 in higher degree. With this correction finished, the Index has resumed its downward trajectory in wave 3. From the wave 2 high, wave ((i)) ended at 99.13, and the rally in wave ((ii)) terminated at 99.3. In the near term, as long as the pivot at 99.32 remains intact, rallies are expected to fail. The decline should continue to unfold in sequences of 3, 7, or 11 swings, reinforcing the bearish outlook and favoring further downside pressure toward the projected Fibonacci target.
DXY EXTREME BEARISH DIVERGENCE > ABOUT TO COME STRAIGHT DOWN!DXY Has been on a tear but I think thats about to end and I think it will end very quickly. There is multiple very strong bearish divergences on the weekly, across multiple indicators showing that a major move down is coming. I think we have reached the top for the DXY for a while and its about to tank. Dont know whats around the corner as far as news but something big is about to come out thats going to kill the DXY. This is not trading or financial advice this is just my opinion. If you apprecaite my work please consider giving this chart a boost and follow me for more updates. Thank you and good luck my friends.