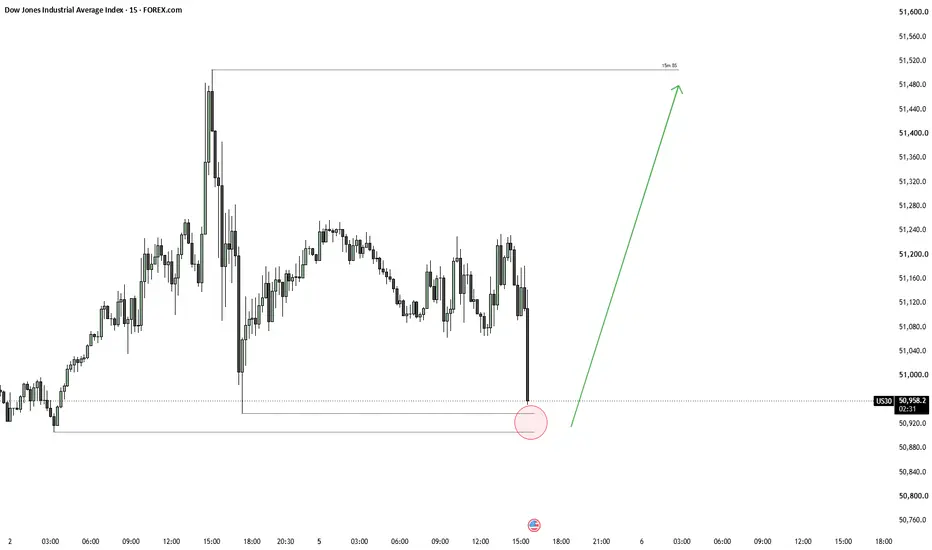
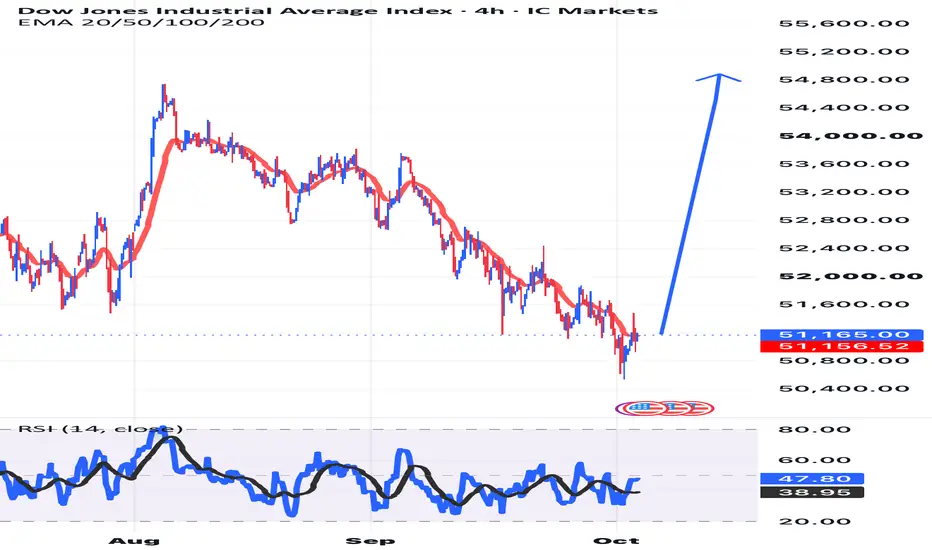
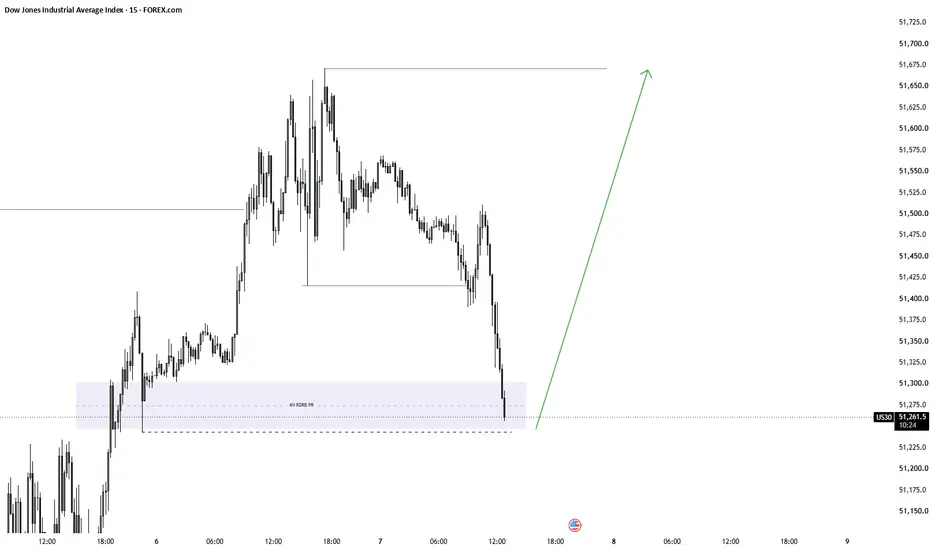
DOW JONES INDEX (US30): Strong Resistance Holds
Quick update for my analysis of the US30 Index.
Earlier, we spotted a confirmed breakout of a major support cluster.
The market is retesting it at the moment.
With a high probability, the index will drop soon.
Goal - 50300
❤️Please, support my work with like, thank you!❤️
I am part of Trade Nation's Influencer program and receive a monthly fee for using their TradingView charts in my analysis.
In-depth trading ideas
US30 Massive Bullish Breakout!
HI,Traders !
#US30 is trading in a strong
Uptrend and the price just
Made a massive bullish
Breakout of the falling
Resistance line and the
Breakout is confirmed
So after a potential pullback
We will be expecting a
Further bullish continuation !
Comment and subscribe to help us grow !
Is this finally the bottom?US30 low may be in with todays doji on daily there is a good chance for green friday tomorrow.
Daily overall looks quite interesting as there is a chance for manipulation move and sweep of the lows today.
As long as tomorrow doesnt close red next week could finally be the end of overnight pump and NY dump.
Lets see
US30 — BEARS EYE LOWER LEVELS The Dow Jones 2H chart is showing strong bearish pressure after repeated rejection from the descending trendline and the 51,500–51,600 resistance zone.
🔻 Price has broken below the recent consolidation area, indicating that sellers are gaining control. The market continues to form lower highs, keeping the overall structure bearish.
🎯 Downside Target: 49,748
📌 A pullback toward the 51,000–51,200 area could provide another confirmation zone if price faces rejection.
⚡ If bearish momentum cont
US30 LONG FROM SUPPORT
US30 SIGNAL
Trade Direction: long
Entry Level: 51,207.0
Target Level: 51,868.1
Stop Loss: 50,766.3
RISK PROFILE
Risk level: medium
Suggested risk: 1%
Timeframe: 9h
Disclosure: I am part of Trade Nation's Influencer program and receive a monthly fee for using their TradingView charts in my analysis.
✅LIKE AND COMMENT MY IDEAS✅
US30 Will Go Up From Support! Buy!
Take a look at our analysis for US30.
Time Frame: 9h
Current Trend: Bullish
Sentiment: Oversold (based on 7-period RSI)
Forecast: Bullish
The market is approaching a significant support area 51,212.9.
The underlined horizontal cluster clearly indicates a highly probable bullish movement with target 51,866.2 level.
P.S
The term oversold refers to a condition where an asset has traded lower in price and has the potential for a price bounce.
Overbought refers to market scenarios where the in
Laggards are Finally Crashing the Partay!Breadth is expanding right on cue. For weeks, NASDAQ:NDX mega cap leadership carried the weight while smaller caps and industrial heavyweights dragged their feet. Now the rotational picture is shifting fast across the board.
Here is the sequence of the laggards waking up:
SP:MID made the first move Friday by reclaiming its red EMA.
TVC:RUT followed through yesterday, popping back over its own red EMA.
(These 2 not in charts)
TVC:DJI joined the party today, finally pushing above its red
Bearish reversal at pullback resistance?US30 is reacting off the pivot and could reverse towards the 1st support, which is a pullback support that aligns with the 50% Fibonacci retracement.
Pivot: 51,583.30
1st Support: 49,842.18
1st Resistance: 52,744.40
Disclaimer:
The opinions given above constitute general market commentary and do not constitute the opinion or advice of IC Markets or any form of personal or investment advice.
Any opinions, news, research, analyses, prices, other information, or links to third-party sites cont
UShort
DOW JONES 2-month Channel Down now targeting 49800.Last week (September 30, see chart below), we gave a technical Sell Signal on Dow Jones (DJIA), as it has just been rejected on its 4H MA50 (blue trend-line), making a new Lower High:
The rejection was confirmed and the index quickly hit our 50550 Target. Now it flashes a new Sell Signal yet again as the price just hit its 4H MA100 (green trend-line) for the first time since September 04 and is getting rejected.
Even though we are not in the absolute Sell Zone (0.236 - 0 Fibonacci range) o
Dow Jones H4 | Bullish Bounce In PlayThe price has bounced off our buy entry level at 50,737.20, which is a pullback support.
Our stop loss is set at 50,030.18, which is a pullback support.
Our take profit is set at 51,640.61, which is an overlap resistance.
High Risk Investment Warning
65% of retail investor accounts lose money when trading CFDs with this provider. You should consider whether you understand how CFDs work and whether you can afford to take the high risk of losing your money.
Bearish move extends lower?Dow Jones (US30) is rising towards the pivot, which has been identified as a pullback resistance and could reverse towards the 1st support.
Pivot: 51,228.80
1st Support: 50,385.10
1st Resistance: 51,843.30
Disclaimer:
The opinions given above constitute general market commentary and do not constitute the opinion or advice of IC Markets or any form of personal or investment advice.
Any opinions, news, research, analyses, prices, other information, or links to third-party sites contained on t
UShort
DOW JONES INDEX (US30): Strong Selling Momentum
US30 turned bearish after the extended pullback.
The price violated a horizontal neckline of the head and shoulders pattern on a 4H time frame,
providing a valid bearish CHoCH.
Goal remains the same - 50300.
❤️Please, support my work with like, thank you!❤️
I am part of Trade Nation's Influencer program and receive a monthly fee for using their TradingView charts in my analysis.
US30How to become successful in forex and stock trading: 1.Master fundamentals and technical analysis. 2,Build and follow a solid trading plan. 3.Apply strict risk management (1–2% rule). 4.Stay disciplined—control fear and greed. 5.Record and analyze every trade. 6.Focus on high-quality setups only. 7.Diversify across assets and markets. 8.Keep evolving—study, adapt, and grow daily.
ULong
DOW JONES 2-month Channel Down targets the 1D MA200.Dow Jones (DJIA) has been trading within a Channel Down since August 04 and is currently under successive rejections on its 4H MA50 (blue trend-line). Those are on the middle of the pattern (0.5 Fibonacci level), with the 4H MA100 (green trend-line) just coming off the Channel's Sell Zone.
As long as this continues, it is more likely to see the current Bearish Leg completing a new -3.50% total decline (like the previous two Bearish Legs), targeting 50550. That would be directly above the 1D MA2
Descending Channel Liquidity Sweep & Reclaim Setup US30 1H: (Long Plan)
1. Market Context
On the 1H chart, US30 (Dow Jones) has been respecting a steep red descending channel from the 53,728.2 peak down to the 50,570 region. After breaking below the key horizontal support at 51,215.0 ("Buyer Out") and sweeping bottom liquidity, price is mounting a recovery to reclaim 51,215.0 and break out of the channel structure.
2. Sentiment & House Trap Analysis
• Where Traders Place Orders: Retail shorters, emboldened by the breakdown below 51,215.0 ("