JCT USDT LONG SIGNAL#32. JCT/USDT – Trade Setup (LONG)
📈 Position Type: LONG
🕒 Timeframe: 1H
📊 Market: Futures
💰 Entry Zone:
0.003804
0.0036
🛑 Stop-Loss:
0.003485
🎯 Take-Profit Targets:
• TP1: 0.0040
• TP2: 0.004242
• TP3: 0.004479
• TP4. 0.004737
Tp5.
⚙️ Leverage:
5*3
▫️ After TP1, move SL to Entry + 0.2%.
▪️ Exit Plan:
• 40% at TP1
• 20% at TP2
• 20% at TP3
20% at TP4
📌 Risk Management:
Risk only 1–2% of your capital per trade.
⚠️ Always check and confirm the setup on your chart before entering the trade.
JCT / TetherUS PERPETUAL CONTRACT
No trades
No trades
In-depth trading ideas
JCTUSDT Potential Long Setup | High-Risk Bounce Play📈 Market: JCTUSDT Perpetual (Bybit)
⏰ Timeframe: 15m
Trade Setup
Entry: 0.003900
Take Profit: 0.004043
Stop Loss: 0.003842
Why I'm Watching This
After an aggressive sell-off, price is attempting to stabilize near local lows. If buyers defend this support zone, a short-term relief rally toward resistance becomes possible.
Bullish Confirmation
✅ Hold above 0.00390
✅ Increasing buying volume
✅ Higher low formation on lower timeframes
Risk Factors
Overall trend remains bearish.
Falling below 0.003842 invalidates the setup.
This is a counter-trend trade, requiring disciplined risk management.
Trade Management
Keep risk predefined.
Consider moving stop to breakeven if price reaches the midpoint toward target.
Avoid chasing candles after a strong breakout.
Trade Plan
🎯 Entry: 0.003900
🚀 TP: 0.004043
🛑 SL: 0.003842
Disclaimer: This is a technical analysis idea for educational purposes, not financial advice. Always do your own research and manage risk accordingly.
#Trading #CryptoTrading #TechnicalAnalysis #Bybit #JCTUSDT #PriceAction #RiskManagement #DayTrading #Altcoins #TradingView
JCTUSDT 1D#JCT has broken above the daily SMA50 and is currently testing the resistance zone. Consider entering this coin only after a confirmed breakout. In that case, the potential upside targets are:
🎯 $0.005251
🎯 $0.006152
🎯 $0.007298
🎯 $0.007896
🎯 $0.008755
⚠️ Always use a tight stop-loss and maintain proper risk management.
JCT / USDT — Stage 1 Base & Early Rotation PlayHey there, how you doing so far?
March 23, 2026
JCT is part of the emerging on-chain / infrastructure + microcap rotation narrative, a segment that often attracts capital after major sectors (AI, L1s, DeFi) start cooling.
These types of assets tend to move later in the cycle, but when they do, they can deliver asymmetric upside due to low liquidity and early positioning.
🧠 Stage 1
JCT is currently transitioning into a Stage 1 base:
✔ Long downtrend → completed
✔ Price stabilization → confirmed
✔ Sideways accumulation → in progress
✔ Early breakout attempt → ongoing
For months, price has been building a flat base around $0.002–0.003, showing:
Volatility contraction
Reduced selling pressure
Gradual accumulation
This is exactly how Stage 1 structures develop before Stage 2 expansion.
🔍 Current Setup
Price: ~$0.0046
JCT is now:
Breaking above the $0.0045 resistance zone
Printing a higher high for the first time in months
Showing volume expansion on breakout
This is an early signal of trend change, not confirmation yet — but very important.
🧱 Key Levels
Support:
$0.0040–0.0045 → breakout / flip zone
$0.0020 → macro base
Upside Targets:
$0.0068 → first resistance
$0.0086 → mid target
$0.0123 → major liquidity zone
🎯 Scenario
✅ Bullish Case (Stage 2 Trigger)
If JCT:
Holds above $0.0045
Builds structure above resistance
Continues with volume
→ It can transition from Stage 1 → Stage 2 (trend phase)
That’s where fast expansion typically begins.
⚠️ Weak Case
Failure to hold breakout:
→ Back to range
→ More time in accumulation
(No structural damage unless $0.002 breaks)
🚀 Final Thought
JCT is not in full trend yet —
but it’s doing something more important:
👉 It’s building a Stage 1 base after a long downtrend
These are the phases where smart money accumulates quietly.
If the breakout confirms, this shifts from:
➡ accumulation → early trend asset
And that’s where the real move starts.
JCTUSDT — Price at Ceiling. Who's Left to Buy?Spot at 283.17M versus futures at 4.56B — F/S ratio 16.1x High with spot dollar 662.9K against futures 10.67M. Futures are running this at sixteen times the spot volume. Price at 0.002341 with futures basis nearly flat at 0.002343. The 42% bounce at 22.3x parabolic from demand is already printed. This is the arrival, not the departure.
Signal count extreme: 49 green to 3 red across 112, 94.2% bull. C>T a clean 13:0. EMA 8:0, Ichi TK 12:0, candles 11:2, DD/SS 4:0, pattern total 5:0. Spread at 88.5% Extreme. No squeeze active, BW 27.75%, bull momentum rising. MeanZ 1.09σ Rise. Every technical check aligns — and that alignment at 100% price ceiling is the warning, not the invitation.
Spot Z -0.27 Steady, futures Z -0.04 Steady, combined -0.05 Steady. Zero volume event backing a 22x parabolic move. Momentum at 0 Falling. Bull:Bear Z 0.56:-0.54 balanced, neither side owning the flow with conviction. Squeeze momentum con up at 202.7% — that reading reflects the prior compression energy, already released.
Leverage at 16.11x High, percentile 64.6% Mid. All-time max was 108.15x 10²² bars ago — current leverage is elevated but not at historical extremes. AT min 3.31x recorded 2721 bars ago. At 64.6% percentile with 16x absolute leverage and a 16x F/S ratio, the speculative stack is significant. Price at 100% ceiling of the 0.00148–0.00234 range with no room left in the distribution.
OBV Z at -0.67 Inflow — the one constructive signal in the structure. Quiet but persistent accumulation signature on OBV despite the futures-dominated volume. No whale activity, liquidations clear, no squeezes active on either spot or futures side. Sqz divergence Normal. Prem 0.09% neutral, yield bear at -0.8σ.
The honest read: a 22x parabolic bounce fully extended into the 100% price ceiling, 16x futures-to-spot ratio with steady volume and falling momentum, zero new volume event, and OBV inflow the only bull holdout. This is a leverage-carried move that has arrived at distribution territory. The signal stack was real on the way up — the risk now is that it stays that way while price quietly rolls without a volume catalyst to push through.
Is That Crypto Pump Real? Data Says No. Here's Why.
Stop Losing Money to Fake Volume. Find Real Moves Now.
Trade the REAL Crypto Volume. Stop Getting Faked Out.
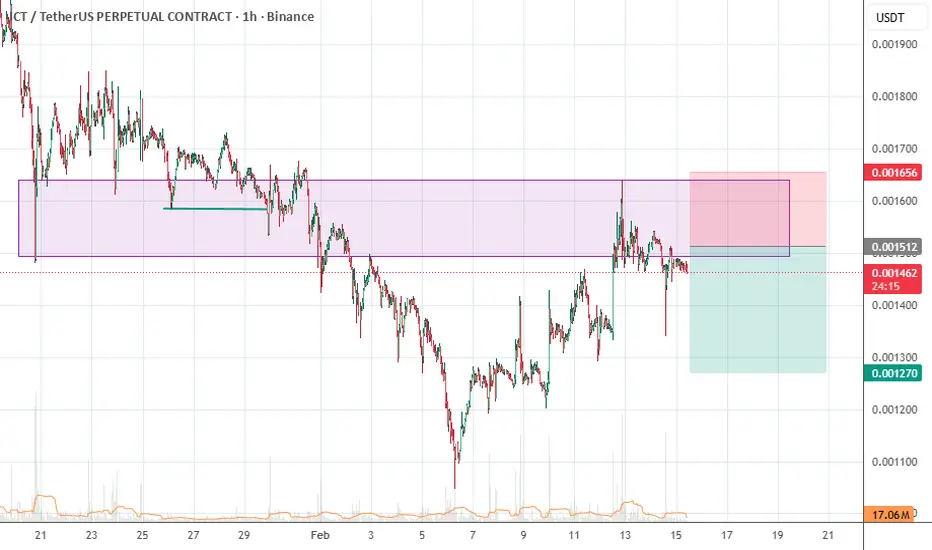
Will JCT continue to fall? (4H)The long-term trend has been broken, and we have a bearish CH on the chart.
A pullback and supply zone has formed, and in this area we are looking for short sell positions.
The targets are marked on the chart. Move to breakeven at the first target.
A daily candle close above the invalidation level will invalidate this analysis.
Do you think the specified selling zone is a good area for shorting?
If you would like us to analyze a coin or altcoin for you, first like this post, then comment the name of your altcoin below.
JCTUSDT: Rectangle Breakdown — Bearish Trend ContinuationPrice has broken down from a consolidation rectangle, which formed after a strong impulsive move lower. This structure acted as a bearish continuation pattern , and the downside breakout confirms that sellers remain in control.
After the loss of the lower boundary of the rectangle, price is expected to continue following the prevailing downtrend. Any minor pullbacks are likely to be corrective and may offer better positioning for trend continuation rather than signaling a reversal.
Bearish scenario:
Rectangle support broken → continuation of the downtrend
Momentum remains bearish below the former range
Next downside target: 0.0015 USD
As long as price stays below the broken structure, the bias remains strongly bearish. The highlighted lower zone represents a potential area where price may look for temporary stabilization.