JOE — Descending Trendline Under Pressure | Breakout Incoming?📊 Technical Analysis — $JOE/USDT
💵 Coin: NYSE:JOE
⌛ Time Frame: 1D
📐 Pattern: Descending Trendline / Bearish Trend Structure
🎯 Key Breakout Level: $0.03230
🎯 Main Upside Target: $0.04380
📈 Extended Targets: $0.05250 → $0.05800
📐 Descending Trendline
NYSE:JOE remains below the descending trend
JOE / USDT
No trades
No trades
Compare with JOE/USDT
Open interest
Open interest
Price
Liquidations
Long
Short
Price
JOEUSDT Forming Falling WedgeJOEUSDT is forming a clear falling wedge pattern, a classic bullish wave signal that often indicates an upcoming breakout. The price has been consolidating within a narrowing range, suggesting that selling pressure is weakening while buyers are beginning to regain control. With consistent volume con
JOE/USDT - Descending Trendline Pressure Toward Reversal?On the 1D timeframe, JOE/USDT is still in a mid–long term downtrend, clearly defined by a descending trendline (yellow line). Price continues forming lower highs and lower lows, but is now showing signs of accumulation at the bottom range.
Key observations:
Strong rebound from the low area (~0.033
JOEUSDT – Market Brain View | H1 Long CycleJOEUSDT – Market Brain View | H1 Long Cycle
Market Brain View
JOEUSDT is approaching a reaction zone after a corrective move from the recent H1 impulse.
The market is testing a structural support area where a short-term rebound may begin.
Cycle Structure
Impulse → Pullback → Support Reaction → Pot
JOE Holding Rising Trendline Support – Key Reaction Zone in PlayJOE is currently in a corrective phase after a strong impulsive move, trading within a rising structure. Price is holding above the ascending trendline while reacting around the 0.236–0.382 Fibonacci retracement zone. As long as this region holds, continuation toward higher levels remains valid. A b
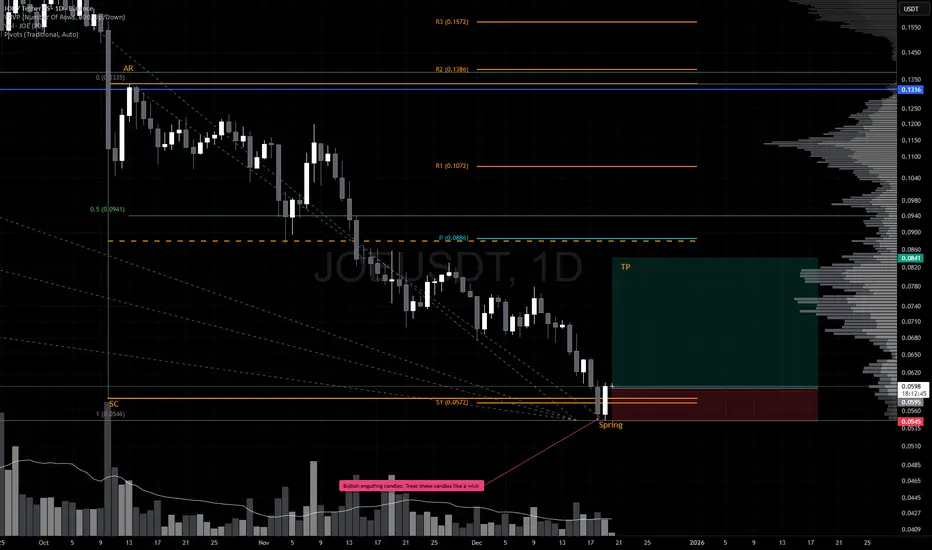
Relief Rally Inbound? JOE is shaping up for a potential reversal.
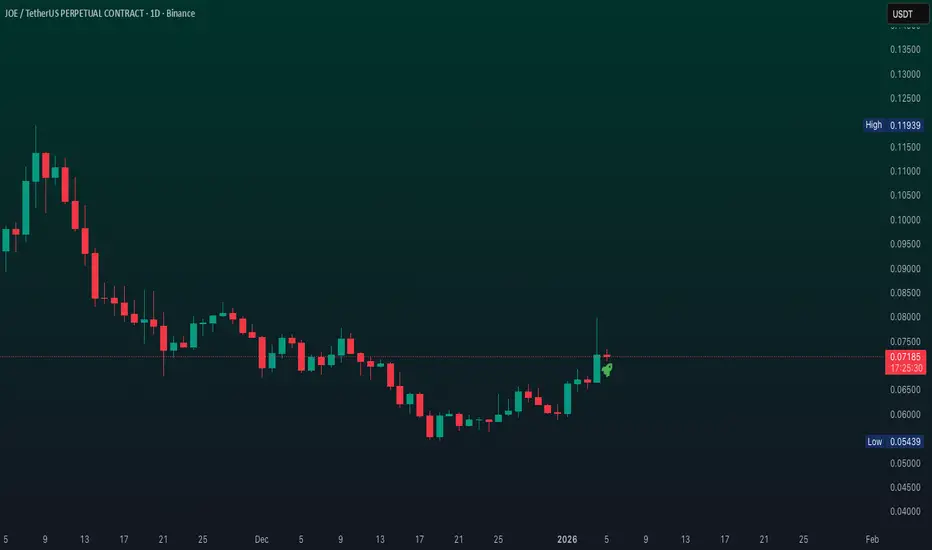
After the aggressive October 10 sell‑off, price responded with a clean Automatic Rally (AR) before rolling over into a controlled pullback. This latest dip appears to be sweeping the October 10 lows, and the December 19 bullish engulfing candle is the firs
JOE READY FOR BREAKOUT🔥 Fortune AI Radar — NYSE:JOE
Fresh activity detected on NYSE:JOE today.
Data suggests increasing market interest & buyers stepping in.
Technicals currently lean bullish, with momentum trending upward.
Whales showing hints of accumulation and hype rising among traders.
This coin is flashing st
JOE Analysis (4H)It seems that the JOE coin is forming a corrective diamond diatomic pattern and has now entered wave D.
If the price reaches the entry points we have identified, we will enter a long/buy position using DCA to target wave E of this pattern.
A daily candle closing below the invalidation level will i
JOE Breakout Above Descending Trendline, Retest in ProgressJOE was trending under a strong descending trendline that capped price for an extended period. Price has now broken above this descending resistance, marking a potential shift in short-term structure.
After the breakout, JOE is currently retesting the broken trendline, which is acting as a key deci
See all ideas
Summarizing what the indicators are suggesting.
Oscillators
Neutral
Oscillators
Neutral
Summary
Neutral
Summary
Neutral
Summary
Neutral
Moving Averages
Neutral
Moving Averages
Neutral
Displays a symbol's price movements over previous years to identify recurring trends.
Frequently asked questions
The current price of JOE / USDT (JOE) is 0.02744 USDT — it has fallen −1.24% in the past 24 hours. Try placing this info into the context by checking out what coins are also gaining and losing at the moment and seeing JOE price chart.
JOE / USDT price has fallen by −12.79% over the last week, its month performance shows a −30.61% decrease, and as for the last year, JOE / USDT has decreased by −76.37%. See more dynamics on JOE price chart.
Keep track of coins' changes with our Crypto Coins Heatmap.
JOE / USDT (JOE) reached its highest price on Nov 23, 2021 — it amounted to 4.25800 USDT. Find more insights on the JOE price chart.
See the list of crypto gainers and choose what best fits your strategy.
JOE / USDT (JOE) reached the lowest price of 0.02303 USDT on Jul 29, 2026. View more JOE / USDT dynamics on the price chart.
See the list of crypto losers to find unexpected opportunities.
The safest choice when buying JOE is to go to a well-known crypto exchange. Some of the popular names are Binance, Coinbase, Kraken. But you'll have to find a reliable broker and create an account first. You can trade JOE right from TradingView charts — just choose a broker and connect to your account.
Crypto markets are famous for their volatility, so one should study all the available stats before adding crypto assets to their portfolio. Very often it's technical analysis that comes in handy. We prepared technical ratings for JOE / USDT (JOE): today its technical analysis shows the strong sell signal, and according to the 1 week rating JOE shows the strong sell signal. And you'd better dig deeper and study 1 month rating too — it's sell. Find inspiration in JOE / USDT trading ideas and keep track of what's moving crypto markets with our crypto news feed.
JOE / USDT (JOE) is just as reliable as any other crypto asset — this corner of the world market is highly volatile. Today, for instance, JOE / USDT is estimated as 8.20% volatile. The only thing it means is that you must prepare and examine all available information before making a decision.
You can discuss JOE / USDT (JOE) with other users in our public chats, Minds or in the comments to Ideas.