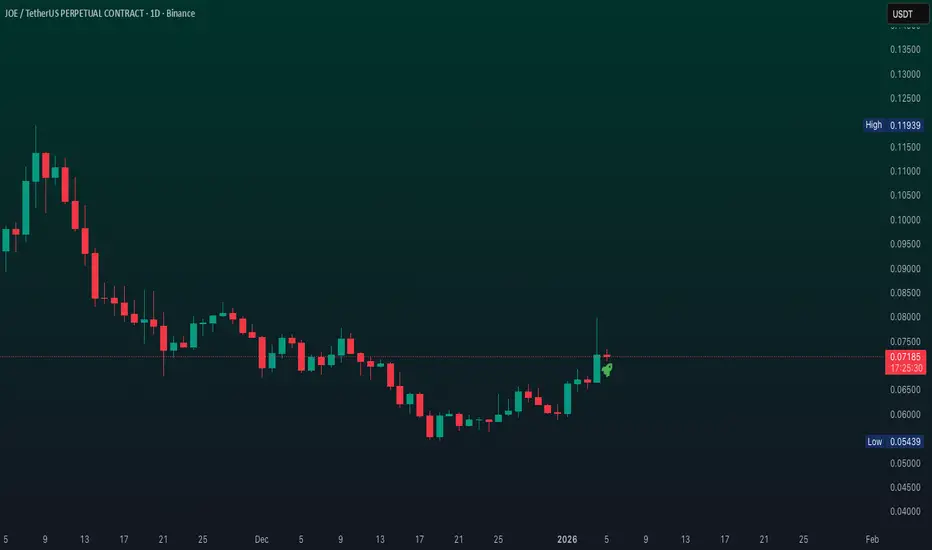
JOE — Descending Trendline Under Pressure | Breakout Incoming?📊 Technical Analysis — $JOE/USDT
💵 Coin: NYSE:JOE
⌛ Time Frame: 1D
📐 Pattern: Descending Trendline / Bearish Trend Structure
🎯 Key Breakout Level: $0.03230
🎯 Main Upside Target: $0.04380
📈 Extended Targets: $0.05250 → $0.05800
📐 Descending Trendline
NYSE:JOE remains below the descending trendline formed since the major high around $0.062+ in April.
This yellow trendline has acted as dynamic resistance, with several previous recovery attempts failing to break above it. This structure indi
JOE / USDT
No trades
No trades
In-depth trading ideas
JOEUSDT Forming Falling WedgeJOEUSDT is forming a clear falling wedge pattern, a classic bullish wave signal that often indicates an upcoming breakout. The price has been consolidating within a narrowing range, suggesting that selling pressure is weakening while buyers are beginning to regain control. With consistent volume confirming accumulation at lower levels, the setup hints at a potential bullish breakout soon. The projected move could lead to an impressive gain of around 80% to 90% once the price breaks above the wed
JOE/USDT - Descending Trendline Pressure Toward Reversal?On the 1D timeframe, JOE/USDT is still in a mid–long term downtrend, clearly defined by a descending trendline (yellow line). Price continues forming lower highs and lower lows, but is now showing signs of accumulation at the bottom range.
Key observations:
Strong rebound from the low area (~0.033)
Impulsive spike in early April (possible smart money entry)
Consolidation below trendline → indicating breakout pressure building
---
🔍 Structure & Pattern
📌 Descending Triangle / Descending
JOEUSDT – Market Brain View | H1 Long CycleJOEUSDT – Market Brain View | H1 Long Cycle
Market Brain View
JOEUSDT is approaching a reaction zone after a corrective move from the recent H1 impulse.
The market is testing a structural support area where a short-term rebound may begin.
Cycle Structure
Impulse → Pullback → Support Reaction → Potential H1 rebound cycle.
Entry Logic
Entry Zone: around 0.0495
Profit Map
Close 40% at +2%
Close remaining position at +6% if momentum expands.
Risk Control
Stop Loss: 0.0449
Rainbowsniper Logic
T
JOE Holding Rising Trendline Support – Key Reaction Zone in PlayJOE is currently in a corrective phase after a strong impulsive move, trading within a rising structure. Price is holding above the ascending trendline while reacting around the 0.236–0.382 Fibonacci retracement zone. As long as this region holds, continuation toward higher levels remains valid. A breakdown below 0.0626 would invalidate the bullish structure and expose deeper downside toward 0.0544.
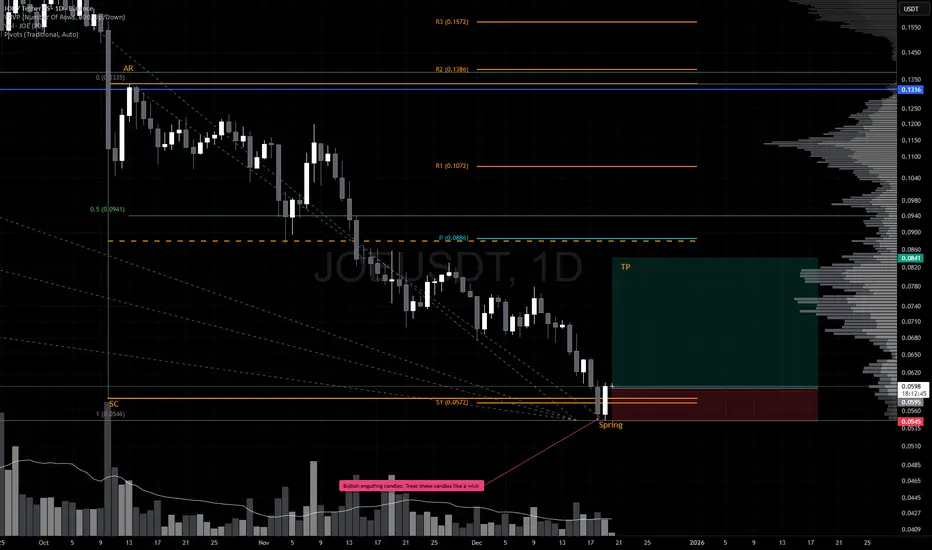
Relief Rally Inbound? JOE is shaping up for a potential reversal.
After the aggressive October 10 sell‑off, price responded with a clean Automatic Rally (AR) before rolling over into a controlled pullback. This latest dip appears to be sweeping the October 10 lows, and the December 19 bullish engulfing candle is the first meaningful sign of demand stepping back in.
Crucially, price closed back inside the prior range, which keeps the structure constructive. While heavier volume on the reversal would’ve added confiden
JOE READY FOR BREAKOUT🔥 Fortune AI Radar — NYSE:JOE
Fresh activity detected on NYSE:JOE today.
Data suggests increasing market interest & buyers stepping in.
Technicals currently lean bullish, with momentum trending upward.
Whales showing hints of accumulation and hype rising among traders.
This coin is flashing strong signals on short-term charts — worth keeping an eye on 👀
Not financial advice — always research before taking decisions
JOE Analysis (4H)It seems that the JOE coin is forming a corrective diamond diatomic pattern and has now entered wave D.
If the price reaches the entry points we have identified, we will enter a long/buy position using DCA to target wave E of this pattern.
A daily candle closing below the invalidation level will invalidate this analysis.
For risk management, please don't forget stop loss and capital management
When we reach the first target, save some profit and then change the stop to entry
Comment if you ha
JOE Breakout Above Descending Trendline, Retest in ProgressJOE was trending under a strong descending trendline that capped price for an extended period. Price has now broken above this descending resistance, marking a potential shift in short-term structure.
After the breakout, JOE is currently retesting the broken trendline, which is acting as a key decision zone. This behavior is typical after a structure break, where the market checks whether former resistance can flip into support.
If price manages to hold above the retest zone and shows acceptan
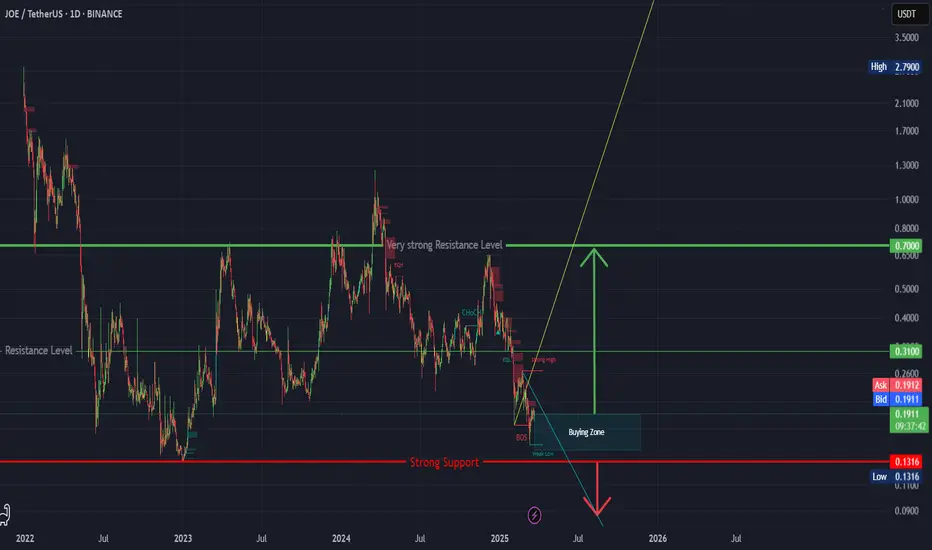
JOE/USDT — On the Edge of a Major Reversal or Final Breakdown?The price of JOE is currently sitting on a critical historical support zone around $0.1517 – $0.1241 (highlighted in yellow).
This area has repeatedly acted as a strong demand zone since 2023, suggesting a potential accumulation base for mid-term investors.
However, each retest without a strong rebound increases the probability of a breakdown. This phase could mark the decisive turning point for JOE’s next major move.
---
Market Structure & Pattern
Primary trend: Long-term downtrend with co
JOE ANALYSIS📊#JOE Analysis
✅There is a formation of Descending triangle pattern on daily chart🧐
Pattern signals potential bullish movement incoming after a small retest 📉
👀Current Price: $0.1944
🚀 Target Price: $0.2370
⚡️What to do ?
👀Keep an eye on #JOE price action and volume. We can trade according to the chart and make some profits⚡️⚡️
#JOE #Cryptocurrency #TechnicalAnalysis #DYOR
JOEUSDT Forming Bullish MomentumJOEUSDT is forming a strong technical structure that signals potential bullish momentum. The chart indicates price consolidation within a tightening range, often a precursor to a breakout move. With good trading volume supporting the current price action, the conditions are aligning for a significant upside move. Once resistance is cleared, the market could gain momentum quickly, pushing JOEUSDT into higher valuation zones.
Based on the current setup, expectations are pointing toward a 40% to 5
JOEUSDT TRADE ANALYSIS.OEUSDT – 15m Analysis
Bias: ✅ Bullish continuation possible
Key Structure Update:
Clear CHoCH marked – shift from bearish → bullish order flow.
Price already broke short-term structure and is pulling back.
POI Level:
OB + FVG confluence zone at 0.154–0.155 USDT.
SSL liquidity sits just above this zone, likely inducement before continuation.
Trade Plan:
Ideal scenario: price taps into OB + FVG = POI for confirmation (bullish candle or rejection wick).
Continuation target would be 0.162
JOE/USDT Approaching a Major Turning Point: Will Buyers Step In?🔎 Market Overview & Structure:
JOE/USDT is currently trading within a major historical demand zone between $0.1241 – $0.1548, a level that has proven to be a strong support since early 2023. Each time the price revisits this area, we’ve seen significant bounces — indicating that buyers continue to defend this zone aggressively.
However, the macro structure still reflects a clear long-term downtrend from its all-time high.
---
🧠 Why This Zone Matters (Demand Zone Characteristics):
This zone
JOEUSDT 1D#JOE is moving inside a symmetrical triangle on the daily chart and has bounced nicely off the triangle support.
📌 In case of a breakout above the triangle resistance and the daily SMA100, the potential upside targets are:
🎯 $0.2005
🎯 $0.2478
🎯 $0.2861
🎯 $0.3244
🎯 $0.3789
🎯 $0.4483
⚠️ As always, use a tight stop-loss and apply proper risk management.
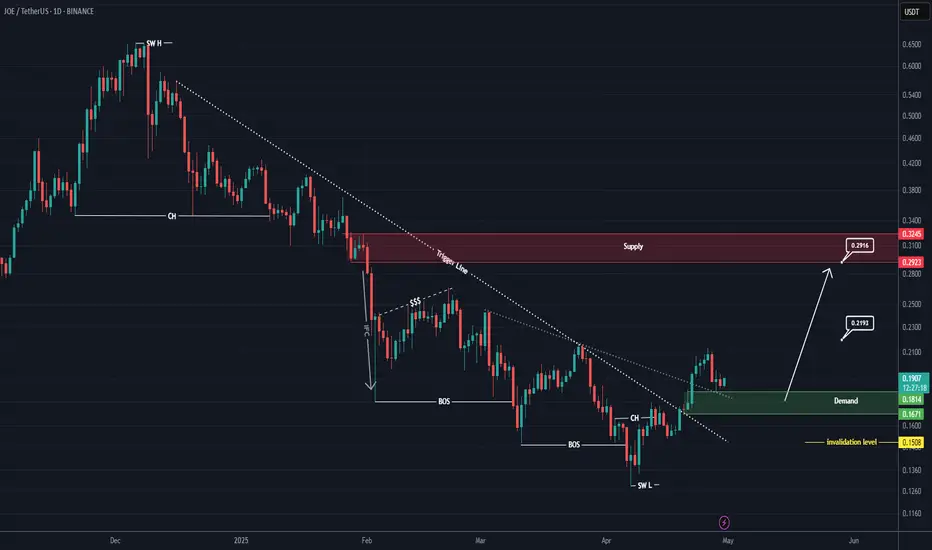
JOE Looks Bullish (1D)A 3D divergence is visible on the chart, indicating that sellers have exited their short positions.
A key trigger line has been broken, and the price has reclaimed critical levels.
We have identified two entry points where we plan to open buy/long positions.
A daily candle closing below the invalidation level will invalidate this analysis
Do not enter the position without capital management and stop setting
Comment if you have any questions
thank you
JOE Looks Bullish (1D)Two important trigger lines have been broken, and a bullish CH (Change of Character) is also visible on the chart. A key support zone has formed, which is expected to hold.
The correction that occurred has been sufficient in terms of both time and price, and the break of the trigger line indicates that the correction is likely over.
There is also a liquidity pool above the chart that is expected to be swept soon
Targets are marked on the chart.
A daily candle closing below the invalidation l
JOE ( SPOT)BINANCE:JOEUSDT
JOE / USDT
1D time frame
analysis tools
____________
SMC
FVG
Trend lines
Fibonacci
Support & resistance
MACD Cross
EMA Cross
______________________________________________________________
Golden Advices.
********************
* Please calculate your losses before any entry.
* Do not enter any trade you find it not suitable for you.
* No FOMO - No Rush , it is a long journey.
Useful Tags.
****************
My total posts
www.tradingview.com
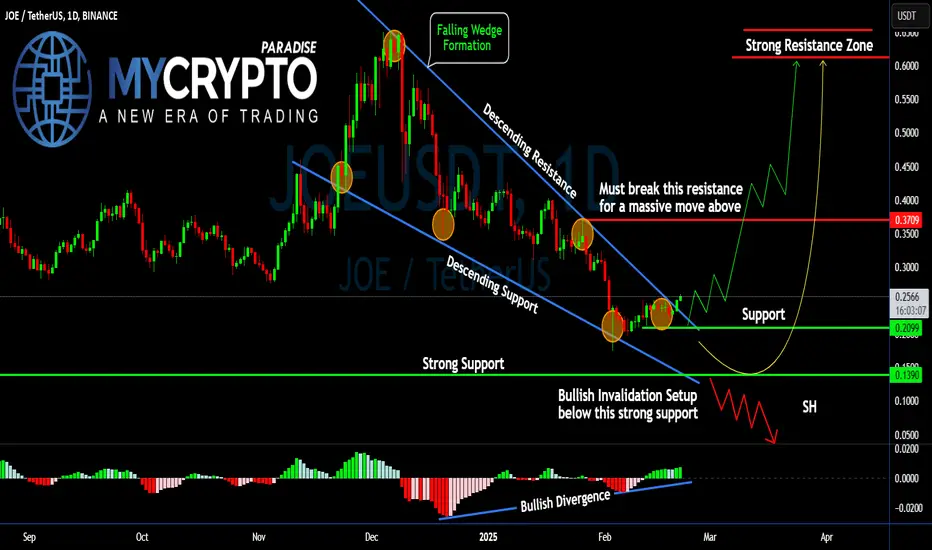
Can #JOE Bulls Continue this Bullish Momentum? Key Levels Yello Paradisers! Is #JOE about to break out of this falling wedge, or will the bears take full control? Here's why the next move could be massive for #JOEUSDT:
💎#JOEUSD has been trading within a falling wedge formation, consistently rejecting from its descending resistance. This pattern is typically bullish, but we need a confirmed breakout before expecting an explosive move. Currently, JOE is holding above a strong support zone at $0.1390 - $0.2099, where buyers have previously stepped in.
💎