JSE Resources: Relative Rejection (Continues)As per our 07 June report:
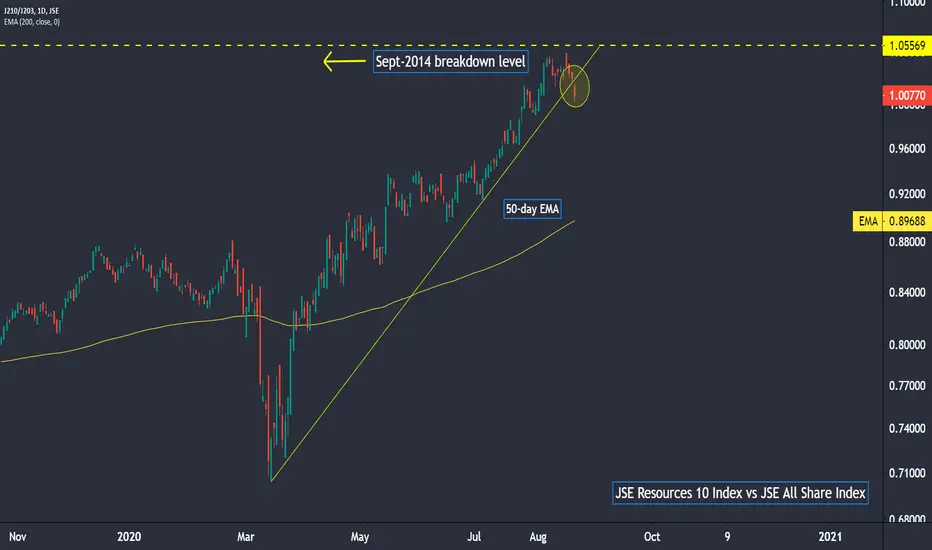
"On a relative basis (vs the All Share Index), upward momentum has been showing signs of slowing, with the relative ratio price being rejected at the prior (Sept-2014) breakdown level while the Relative Strength Index has developed a bearish divergence as per the monthly
Resource 10 Index
No trades
No trades
Peers for comparison
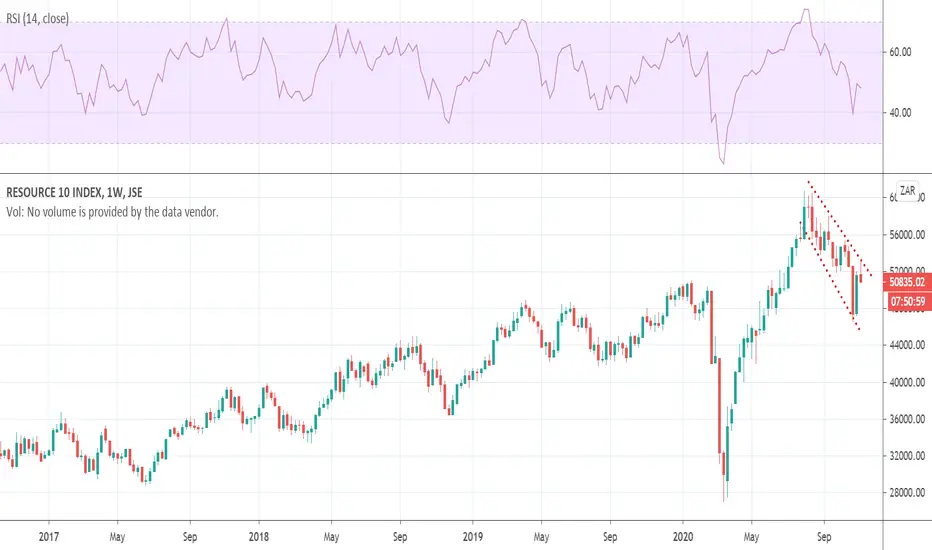
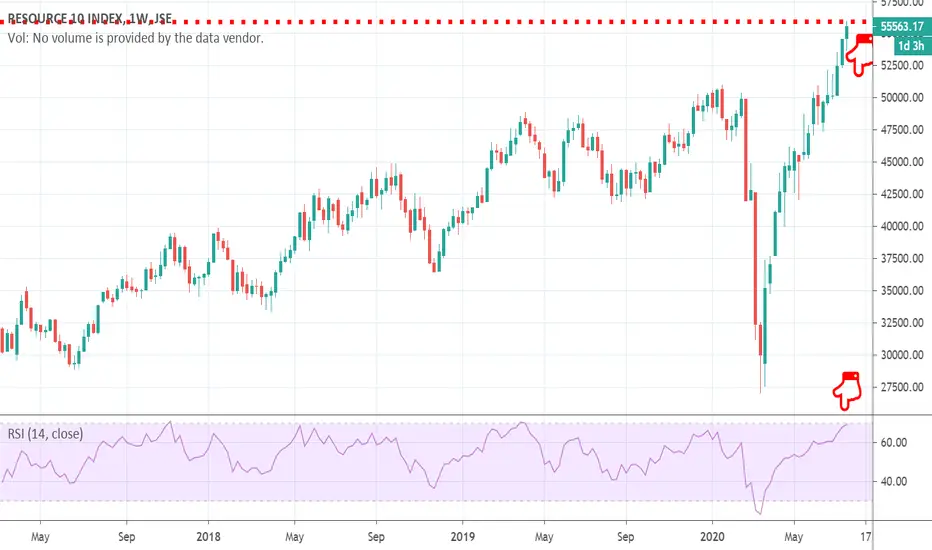
Resources 10 Index (J210) - MonthlyResources 10 Index (J210) | The short term sell-off has seen the index test the lower boundary of the upward channel which extends back to the most commodity market bottom of January 2016. This is subsequent to the rejection of the overhead horizontal resistance level seen in August 2020. The monthl
Resources 10 IndexResources 10 Index | On the daily chart, we are starting to see early signs of fatigue following the recent strong push higher. The monthly chart however paints a much clearer picture in term of resistance with the price now testing the July 2008 and July 2014 downward trend line. Technical evidence
J210 v J212Relative Sector Analysis
Resources 10 vs Financial 15 | During February, we identified the potential out-performance of JSE Resources vs JSE Financials. This was based off the long term (monthly) chart that showed an upward trend which was starting to accelerate. Subsequently, Resources rallied whi
See all ideas
Summarizing what the indicators are suggesting.
Oscillators
Neutral
Oscillators
Neutral
Summary
Neutral
Summary
Neutral
Summary
Neutral
Moving Averages
Neutral
Moving Averages
Neutral
Displays a symbol's value movements over previous years to identify recurring trends.