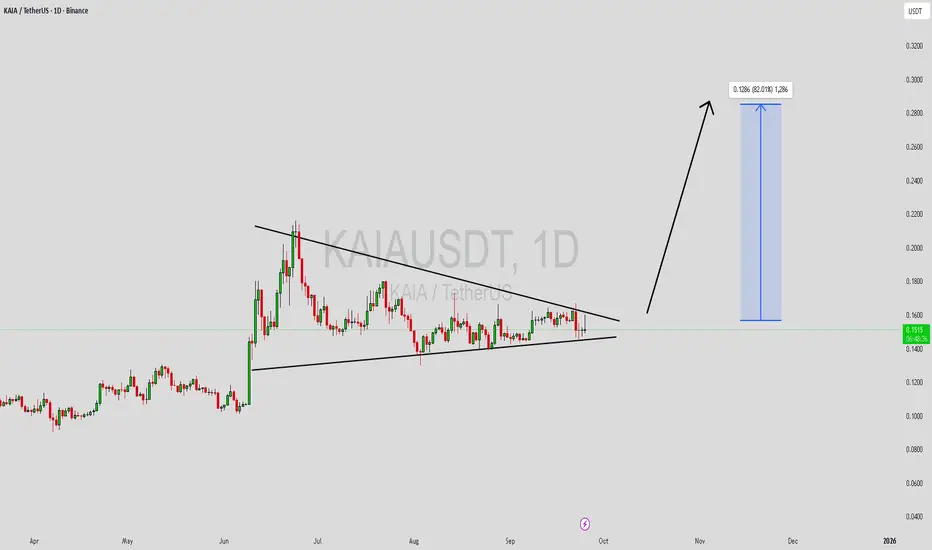
KAIAUSDT Forming Falling WedgeKAIAUSDT is forming a clear falling wedge pattern, a classic bullish reversal signal that often indicates an upcoming breakout could be approaching soon. The price has been consolidating within a narrowing range, suggesting that selling pressure is gradually weakening while buyers are beginning to r
Compare with Kaia/USDT
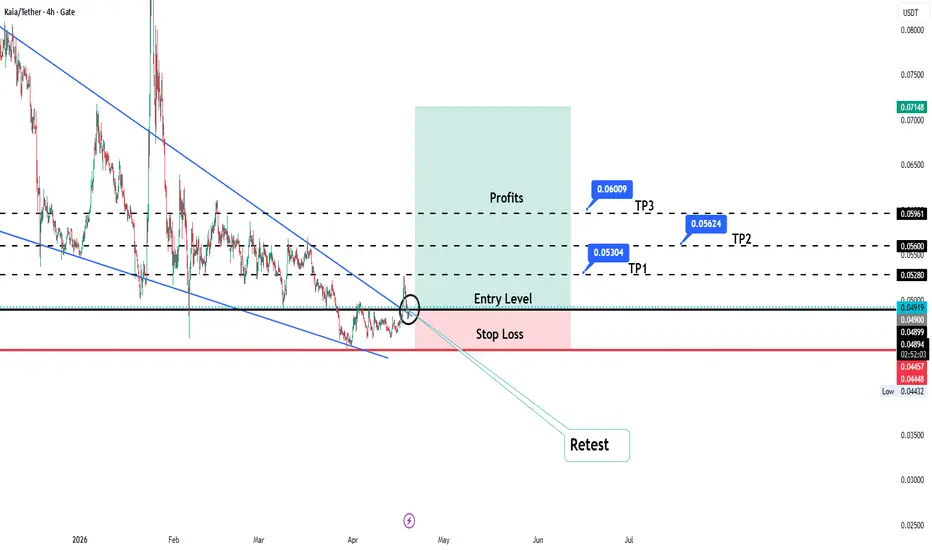
KAIA/USDT Long CRYPTOCAP:KAIA looks technically primed for a potential move based on the current chart structure. This is just a trading idea, not a signal to jump in blindly — patience is key. Ideally, wait for a clean pullback or a confirmed retest before considering any entries.
As always, manage your risk an
KAIA: are we in a range? key levels to watch for the days aheadKAIA
Who’s farming this range with me instead of chasing random green candles? KAIA has been quietly grinding higher while the market rotates back into L1/L2 names, and according to industry sources there’s growing interest around its ecosystem upgrades. Today price poked into a local supply zone
KAIA: ready for a bounce? key levels and targets aheadKAIA. Tired of watching this thing sleep on support while headlines keep hyping the project? According to the market, KAIA is back in the news on ecosystem expansion, but with alts under pressure after the latest BTC dominance push, price is still stuck in this sideways swamp.
On the 4H chart price
KAIAUSDT Forming Bullish MomentumKAIAUSDT is shaping up into a promising technical structure that indicates the potential for a strong bullish breakout. The chart reflects a tightening price action, forming a pattern that often precedes significant moves in the crypto market. With good trading volume supporting the structure, the p
KAIA’s CMF Points to Growing Bullish MomentumThe KAIA/USD one-day chart reveals a notable uptick in the altcoin’s Chaikin Money Flow (CMF), currently sitting at 0.15. This indicates a steady inflow of capital and heightened investor demand. The CMF, which blends price and volume data, serves as a gauge of accumulation or distribution in the ma
KAIA Bullish DivergenceBINANCE:KAIAUSDT
Trade Setup:
Target 1: 0.1472 (0.786 Fibonnaci Golden Zone).
Target 2: 0.1544 (0.618 Fibonnaci Golden Zone).
Target 3: 0.1594 (0.5 Fibonnaci Golden Zone).
Target 4: 0.1808 (0 Fibonnaci).
Stop Loss: 0.1265 (1.272 Fibonnaci).
RSI Analysis: The RSI is showing a bullish divergence,
KAIAUSD Buy this level for a bullish continuation.Kaia (KAIAUSDT) is pulling back towards its 1W MA50 (blue trend-line) for a technical re-test of its natural long-term Support.
We think it will be a January 2024 type of test, with a breach and subsequent rebound to test the Resistance and potentially a 1W MA200 (orange trend-line) test. Target 0.
See all ideas
Summarizing what the indicators are suggesting.
Oscillators
Neutral
SellBuy
Strong sellStrong buy
Strong sellSellNeutralBuyStrong buy
Oscillators
Neutral
SellBuy
Strong sellStrong buy
Strong sellSellNeutralBuyStrong buy
Summary
Neutral
SellBuy
Strong sellStrong buy
Strong sellSellNeutralBuyStrong buy
Summary
Neutral
SellBuy
Strong sellStrong buy
Strong sellSellNeutralBuyStrong buy
Summary
Neutral
SellBuy
Strong sellStrong buy
Strong sellSellNeutralBuyStrong buy
Moving Averages
Neutral
SellBuy
Strong sellStrong buy
Strong sellSellNeutralBuyStrong buy
Moving Averages
Neutral
SellBuy
Strong sellStrong buy
Strong sellSellNeutralBuyStrong buy
Displays a symbol's price movements over previous years to identify recurring trends.
Frequently asked questions
The current price of Kaia/USDT (KAIA) is 0.02636 USDT — it has risen 0.04% in the past 24 hours. Try placing this info into the context by checking out what coins are also gaining and losing at the moment and seeing KAIA price chart.
Kaia/USDT price has fallen by −11.86% over the last week, its month performance shows a −25.99% decrease, and as for the last year, Kaia/USDT has decreased by −81.66%. See more dynamics on KAIA price chart.
Keep track of coins' changes with our Crypto Coins Heatmap.
Kaia/USDT (KAIA) reached its highest price on Dec 2, 2024 — it amounted to 0.42050 USDT. Find more insights on the KAIA price chart.
See the list of crypto gainers and choose what best fits your strategy.
Kaia/USDT (KAIA) reached the lowest price of 0.02526 USDT on Jul 29, 2026. View more Kaia/USDT dynamics on the price chart.
See the list of crypto losers to find unexpected opportunities.
The safest choice when buying KAIA is to go to a well-known crypto exchange. Some of the popular names are Binance, Coinbase, Kraken. But you'll have to find a reliable broker and create an account first. You can trade KAIA right from TradingView charts — just choose a broker and connect to your account.
Crypto markets are famous for their volatility, so one should study all the available stats before adding crypto assets to their portfolio. Very often it's technical analysis that comes in handy. We prepared technical ratings for Kaia/USDT (KAIA): today its technical analysis shows the sell signal, and according to the 1 week rating KAIA shows the strong sell signal. And you'd better dig deeper and study 1 month rating too — it's sell. Find inspiration in Kaia/USDT trading ideas and keep track of what's moving crypto markets with our crypto news feed.
Kaia/USDT (KAIA) is just as reliable as any other crypto asset — this corner of the world market is highly volatile. Today, for instance, Kaia/USDT is estimated as 2.56% volatile. The only thing it means is that you must prepare and examine all available information before making a decision.
You can discuss Kaia/USDT (KAIA) with other users in our public chats, Minds or in the comments to Ideas.