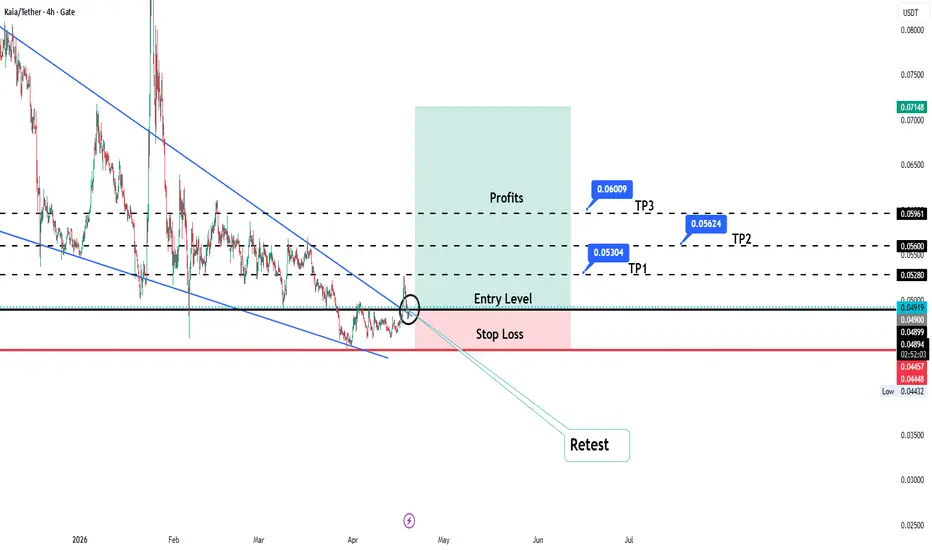
KAIAUSDT Forming Falling WedgeKAIAUSDT is forming a clear falling wedge pattern, a classic bullish reversal signal that often indicates an upcoming breakout could be approaching soon. The price has been consolidating within a narrowing range, suggesting that selling pressure is gradually weakening while buyers are beginning to regain control around key support levels. This structure is commonly seen when the market transitions from bearish pressure into early accumulation.
The projected move from this falling wedge pattern could lead to an impressive gain of around 20% to 30% once the price breaks above the wedge resistance with strong confirmation. This type of pattern typically appears at the end of downtrends or corrective phases and signals a possible shift in market sentiment from bearish to bullish.
Traders closely watching KAIAUSDT are noticing strengthening momentum as the price approaches a key breakout zone. The steady trading volume adds confidence to the setup, suggesting that buyers are gradually stepping in in anticipation of a reversal.
Growing interest in KAIAUSDT reflects improving sentiment and increasing confidence in its technical structure. If the breakout confirms with sustained volume, this could mark the beginning of a fresh bullish recovery phase.
✅ Show your support by hitting the like button and
✅ Leaving a comment below! (What is your opinion about this coin?)
Your feedback and engagement keep me inspired to share more insightful market analysis with you!
In-depth trading ideas
KAIA/USDT Long CRYPTOCAP:KAIA looks technically primed for a potential move based on the current chart structure. This is just a trading idea, not a signal to jump in blindly — patience is key. Ideally, wait for a clean pullback or a confirmed retest before considering any entries.
As always, manage your risk and do your own research before making any decisions. This analysis is shared for educational purposes only and should not be taken as financial advice.
KAIA: are we in a range? key levels to watch for the days aheadKAIA
Who’s farming this range with me instead of chasing random green candles? KAIA has been quietly grinding higher while the market rotates back into L1/L2 names, and according to industry sources there’s growing interest around its ecosystem upgrades. Today price poked into a local supply zone and instantly got slapped back, so the 4H is screaming “range trader’s paradise” for now.
On the 4H chart I see clean demand sitting in the green zone and supply in the red above, with price currently hovering near the midrange. Volume is thinning at the highs and RSI is rolling just under overbought, so I’m leaning toward a pullback first, then a bounce. As long as we hold that green block, the structure stays bullish and I expect another attempt at the upper resistance over the next few sessions.
My plan: I’m stalking longs from the demand zone with invalidation just below it and targets back toward the recent wick high and the top of the red area. If price rips straight through resistance with strong volume, I’ll look for a breakout retest instead. And yeah, I might be wrong, but if demand fails and we lose the green box, I step aside and let the knife find the next buyer.
KAIA: ready for a bounce? key levels and targets aheadKAIA. Tired of watching this thing sleep on support while headlines keep hyping the project? According to the market, KAIA is back in the news on ecosystem expansion, but with alts under pressure after the latest BTC dominance push, price is still stuck in this sideways swamp.
On the 4H chart price is sitting right on the big orange value zone, with RSI already near oversold and volume showing this area as the main battlefield. I’m leaning to the long side: a bounce from the orange/green zone can easily send price to test the red supply bands above. Locally I see a tight range compression - think of a spring getting pressed down.
My base plan: look for longs on a dip into the green box around the recent lows, with targets at the first red band, then the upper red zone where previous sellers stepped in ✅. If KAIA loses that green support with a clean 4H close, I’ll flip the script and expect a fast slide to the lower green zone. I might be wrong, but for now this looks more like accumulation than a breakdown.
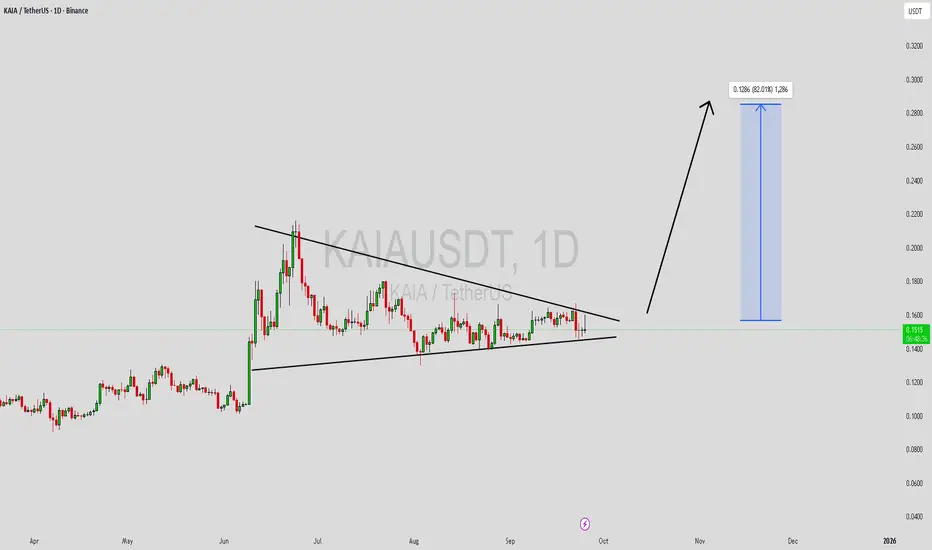
KAIAUSDT Forming Bullish MomentumKAIAUSDT is shaping up into a promising technical structure that indicates the potential for a strong bullish breakout. The chart reflects a tightening price action, forming a pattern that often precedes significant moves in the crypto market. With good trading volume supporting the structure, the probability of an upside continuation is gaining strength, and a breakout could potentially deliver gains of 70% to 80%+.
The consolidation phase has created a solid base, and such formations typically act as launchpads for the next impulsive move. Traders and investors are closely monitoring this zone, as any breakout above resistance could trigger a wave of new buying interest. The healthy volume profile confirms growing market participation, which further supports the bullish outlook.
Investor interest in KAIAUSDT continues to build, making this setup even more attractive for medium-term positioning. With the overall sentiment and technical indicators aligning, this crypto pair could become a strong candidate for impressive upward momentum in the near future.
✅ Show your support by hitting the like button and
✅ Leaving a comment below! (What is You opinion about this Coin)
Your feedback and engagement keep me inspired to share more insightful market analysis with you!
KAIA’s CMF Points to Growing Bullish MomentumThe KAIA/USD one-day chart reveals a notable uptick in the altcoin’s Chaikin Money Flow (CMF), currently sitting at 0.15. This indicates a steady inflow of capital and heightened investor demand. The CMF, which blends price and volume data, serves as a gauge of accumulation or distribution in the market.
Positive CMF readings above zero suggest that KAIA has been closing more frequently in the upper range of its recent price action, a sign of sustained buying pressure.
With the indicator steadily climbing, bullish momentum appears to be strengthening, potentially setting the stage for the next leg higher in price.
KAIA Bullish DivergenceBINANCE:KAIAUSDT
Trade Setup:
Target 1: 0.1472 (0.786 Fibonnaci Golden Zone).
Target 2: 0.1544 (0.618 Fibonnaci Golden Zone).
Target 3: 0.1594 (0.5 Fibonnaci Golden Zone).
Target 4: 0.1808 (0 Fibonnaci).
Stop Loss: 0.1265 (1.272 Fibonnaci).
RSI Analysis: The RSI is showing a bullish divergence, suggesting potential bullish momentum. The current RSI is around 21.23, approaching oversold territory, so caution is advised.
KAIAUSD Buy this level for a bullish continuation.Kaia (KAIAUSDT) is pulling back towards its 1W MA50 (blue trend-line) for a technical re-test of its natural long-term Support.
We think it will be a January 2024 type of test, with a breach and subsequent rebound to test the Resistance and potentially a 1W MA200 (orange trend-line) test. Target 0.32000.
-------------------------------------------------------------------------------
** Please LIKE 👍, FOLLOW ✅, SHARE 🙌 and COMMENT ✍ if you enjoy this idea! Also share your ideas and charts in the comments section below! This is best way to keep it relevant, support us, keep the content here free and allow the idea to reach as many people as possible. **
-------------------------------------------------------------------------------
💸💸💸💸💸💸
👇 👇 👇 👇 👇 👇
KAIA/USDTKey Level Zone: 0.1600 - 0.1615
LMT v2.0 detected.
The setup looks promising—price previously trended upward with rising volume and momentum, then retested this zone cleanly. This presents an excellent reward-to-risk opportunity if momentum continues to align.
Introducing LMT (Levels & Momentum Trading)
- Over the past 3 years, I’ve refined my approach to focus more sharply on the single most important element in any trade: the KEY LEVEL.
- While HMT (High Momentum Trading) served me well—combining trend, momentum, volume, and structure across multiple timeframes—I realized that consistently identifying and respecting these critical price zones is what truly separates good trades from great ones.
- That insight led to the evolution of HMT into LMT – Levels & Momentum Trading.
Why the Change? (From HMT to LMT)
Switching from High Momentum Trading (HMT) to Levels & Momentum Trading (LMT) improves precision, risk control, and confidence by:
- Clearer Entries & Stops: Defined key levels make it easier to plan entries, stop-losses, and position sizing—no more guesswork.
- Better Signal Quality: Momentum is now always checked against a support or resistance zone—if it aligns, it's a stronger setup.
- Improved Reward-to-Risk: All trades are anchored to key levels, making it easier to calculate and manage risk effectively.
- Stronger Confidence: With clear invalidation points beyond key levels, it's easier to trust the plan and stay disciplined—even in tough markets.
Whenever I share a signal, it’s because:
- A high‐probability key level has been identified on a higher timeframe.
- Lower‐timeframe momentum, market structure and volume suggest continuation or reversal is imminent.
- The reward‐to‐risk (based on that key level) meets my criteria for a disciplined entry.
***Please note that conducting a comprehensive analysis on a single timeframe chart can be quite challenging and sometimes confusing. I appreciate your understanding of the effort involved.
Important Note: The Role of Key Levels
- Holding a key level zone: If price respects the key level zone, momentum often carries the trend in the expected direction. That’s when we look to enter, with stop-loss placed just beyond the zone with some buffer.
- Breaking a key level zone: A definitive break signals a potential stop‐out for trend traders. For reversal traders, it’s a cue to consider switching direction—price often retests broken zones as new support or resistance.
My Trading Rules (Unchanged)
Risk Management
- Maximum risk per trade: 2.5%
- Leverage: 5x
Exit Strategy / Profit Taking
- Sell at least 70% on the 3rd wave up (LTF Wave 5).
- Typically sell 50% during a high‐volume spike.
- Move stop‐loss to breakeven once the trade achieves a 1.5:1 R:R.
- Exit at breakeven if momentum fades or divergence appears.
The market is highly dynamic and constantly changing. LMT signals and target profit (TP) levels are based on the current price and movement, but market conditions can shift instantly, so it is crucial to remain adaptable and follow the market's movement.
If you find this signal/analysis meaningful, kindly like and share it.
Thank you for your support~
Sharing this with love!
From HMT to LMT: A Brief Version History
HM Signal :
Date: 17/08/2023
- Early concept identifying high momentum pullbacks within strong uptrends
- Triggered after a prior wave up with rising volume and momentum
- Focused on healthy retracements into support for optimal reward-to-risk setups
HMT v1.0:
Date: 18/10/2024
- Initial release of the High Momentum Trading framework
- Combined multi-timeframe trend, volume, and momentum analysis.
- Focused on identifying strong trending moves high momentum
HMT v2.0:
Date: 17/12/2024
- Major update to the Momentum indicator
- Reduced false signals from inaccurate momentum detection
- New screener with improved accuracy and fewer signals
HMT v3.0:
Date: 23/12/2024
- Added liquidity factor to enhance trend continuation
- Improved potential for momentum-based plays
- Increased winning probability by reducing entries during peaks
HMT v3.1:
Date: 31/12/2024
- Enhanced entry confirmation for improved reward-to-risk ratios
HMT v4.0:
Date: 05/01/2025
- Incorporated buying and selling pressure in lower timeframes to enhance the probability of trending moves while optimizing entry timing and scaling
HMT v4.1:
Date: 06/01/2025
- Enhanced take-profit (TP) target by incorporating market structure analysis
HMT v5 :
Date: 23/01/2025
- Refined wave analysis for trending conditions
- Incorporated lower timeframe (LTF) momentum to strengthen trend reliability
- Re-aligned and re-balanced entry conditions for improved accuracy
HMT v6 :
Date : 15/02/2025
- Integrated strong accumulation activity into in-depth wave analysis
HMT v7 :
Date : 20/03/2025
- Refined wave analysis along with accumulation and market sentiment
HMT v8 :
Date : 16/04/2025
- Fully restructured strategy logic
HMT v8.1 :
Date : 18/04/2025
- Refined Take Profit (TP) logic to be more conservative for improved win consistency
LMT v1.0 :
Date : 06/06/2025
- Rebranded to emphasize key levels + momentum as the core framework
LMT v2.0
Date: 11/06/2025
KAIA/USDT - Potential ReversalThe KAIA/USDT pair on the 4-hour timeframe is displaying a compelling technical setup following its recent correction from the 0.21 highs. After a strong rally from 0.11 to 0.21 in mid-June, the pair has pulled back to test the critical support confluence around 0.16-0.17, where multiple technical factors are converging to potentially halt the decline.
Current Market Structure:
Price is currently consolidating around 0.1823, sitting just above the lower boundary of the Ichimoku cloud and near the 10-day VWAP (green line). This area represents a crucial decision point for the pair's next directional move. The recent price action shows signs of stabilization after the sharp pullback, with diminishing selling pressure evident in the latest candlesticks.
Technical Indicators Analysis:
The RSI has cooled from overbought levels and is now in neutral territory around 45, providing room for upward movement without immediate resistance from momentum indicators. The Ichimoku cloud structure suggests the bullish trend remains intact on higher timeframes, with the current pullback potentially representing a healthy correction within the larger uptrend.
Trade Setup:
Entry: Consider long positions on a break above 0.185 with volume confirmation
Target Levels:
1st Target: 0.195-0.200 (previous support turned resistance)
2nd Target: 0.210-0.215 (recent highs retest)
Risk Management:
Stop Loss: Below 0.165 to protect against a breakdown of the support confluence
Risk-Reward: Favorable 1:2+ ratio given the proximity to support levels
Alternative Scenario:
A break below 0.165 would signal continuation of the correction toward 0.14-0.15 levels, where longer-term support may emerge. Monitor volume and momentum for confirmation of any breakdown.
KAIA PERPETUAL TRADE ,Perfect Short from here $0.17KAIA PERPETUAL TRADE
KAIA SELL SETUP
Currently $0.17
Sold From $0.17
(Trading plan If KAIA go up to $0.18
will add more shorts)
Expecting target $0.14 OR DOWN
Even expecting below $0.13 soon
Final watch area around $0.12
In the event of an early exit,
this analysis will be updated.
Its not a Financial advice
Unlocking Long-Term value KAIA Klaytn-Finschia MergerThe recent merger between Klaytn and Finschia to form KAIA significantly enhances its value as a long-term investment by unifying two established blockchain ecosystems under one powerful, scalable Layer 1 network. This consolidation not only streamlines development and governance but also expands KAIA’s reach to over 250 million users through integrations with KakaoTalk and LINE—two of Asia’s most dominant messaging platforms. With this strategic alignment, KAIA is positioned to become the core blockchain infrastructure for real-world applications in finance, messaging, and digital identity, transforming the merger into a catalyst for mass adoption and sustainable utility-driven growth.
KAIA represents a rare convergence of technological utility, mass adoption potential, and institutional credibility in the crypto space. Born from the merger of Klaytn (by Kakao) and Finschia (by LINE), KAIA is now backed by two of Asia’s largest tech ecosystems—giving it immediate access to over 250 million users through native integrations with KakaoTalk and LINE messenger. With support for USDT, upcoming plans for a Korean won–pegged stablecoin, and a unified development platform, KAIA is positioning itself not just as a speculative asset, but as a foundational layer for real-world blockchain applications in gaming, finance, and communication. This level of real user integration and regulatory alignment is something very few blockchains offer.
For long-term investors, KAIA offers significant upside potential driven by fundamental adoption, not hype alone. The project’s focus on secure, low-latency transactions; expanding smart contract utility; and alignment with South Korea’s pro-crypto regulatory trends makes it uniquely poised to benefit from mainstream crypto adoption across Asia. As blockchain increasingly becomes embedded into messaging, payment systems, and digital identity, KAIA’s early partnerships and infrastructure give it an edge. Volatility may persist in the short term, but for those seeking a credible Layer 1 with real-world adoption, KAIA is not just a token—it’s a gateway to Asia’s Web3 future.
⸻
🕒 1D Chart Context: Macro Perspective
• Current Price: 0.1714 USDT
• Recent Daily Move: Strong breakout from ~0.10 → 0.17
• This surge broke months of accumulation and a long downtrend that began above 0.38 USDT
⸻
🔍 Chart Structure & Price Action
• Massive descending wedge or base formation between $0.10–$0.14
• Recent daily candle shows a bullish breakout with high momentum and volume
• This breaks the prior lower high structure, confirming a trend reversal is in play
⸻
📉 Key Moving Averages
• Orange MA (longer-term): Was acting as dynamic resistance; now broken
• Red MA (likely 50-day): Also breached decisively
• Both MAs curling upward — signals a shift from bearish to bullish regime
⸻
🧱 Major Support/Resistance Zones
Here’s a quick Fibonacci-style breakdown of levels you’ll likely see price react to:
Zone Price (approx) Note
Resistance 1 0.180–0.185 Next logical challenge post-breakout
Resistance 2 0.24–0.26 Key cluster zone from prior breakdown
Resistance 3 0.28–0.32 Historical congestion + high-volume zone
Support 1 0.145 Broken resistance, now flipped to support
Support 2 0.100 Base of prior accumulation (key floor)
⸻
⚠️ Volatility Warning
• This breakout has occurred on a high-momentum, vertical move — often followed by:
• A brief retest (pullback to 0.145–0.150)
• OR a continuation squeeze into 0.185–0.20 before retracing
⸻
🧠 Strategic Takeaways
Bullish Bias IF:
• Price holds above 0.145 on daily closing basis
• Consolidation or flags occur between 0.165–0.185 with rising volume
Bearish Traps to Watch For:
• A false breakout above 0.18–0.20 with no follow-through
• Closing back under 0.145 would invalidate the momentum move
⸻
🧭 Combined Signal (5m + 1D)
Timeframe Signal Interpretation
5-min ✅ Bullish Momentum continuation, but nearing near-term resistance (~0.1707)
Daily ✅ Bullish Breakout of long base, multi-week upside potential. ibb.co
Kaia Very Easy 235% & 392% Profits TargetsLook at the price action on this chart, this is a classic. KAIAUSDT goes extremely bullish as soon as it opens for trading. The bu-wave peak leads to a correction, steep decline. The decline slows down but still going lower. Then the trend changes completely, instead of lower the pair in question starts to rise from its base, a reversal.
Just as we had a steep decline, there will be a strong rise after the end of the bullish consolidation phase.
The targets can be seen on the chart. We have two very easy targets with more possible if you are focusing on the long-term.
Make sure to do your own numbers and planning. I am only reading the chart for you, you have to take care of the rest.
Thank you for reading.
Namaste.
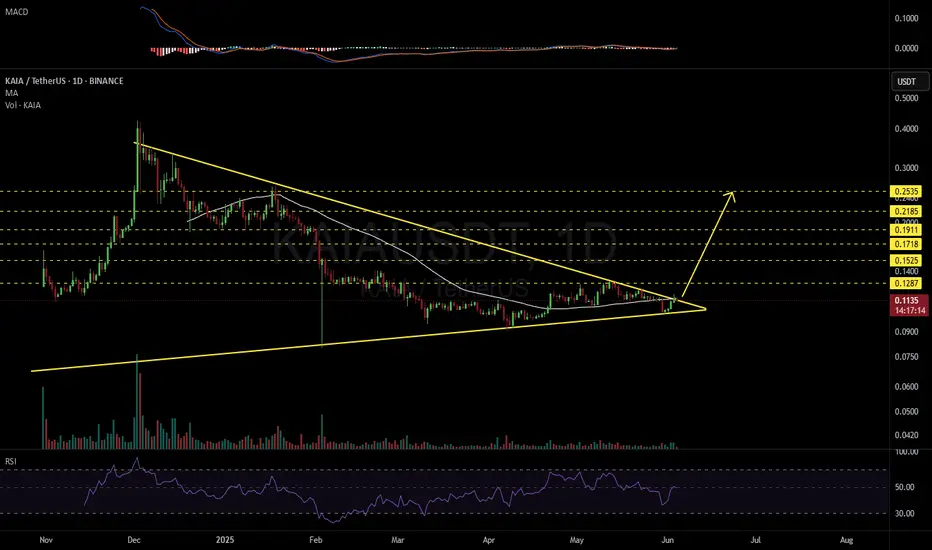
KAIAUSDT 1D#KAIA — Breakout Loading? 🔄
#KAIA is on the verge of breaking out above the symmetrical triangle resistance and the MA50 on the daily chart.
A confirmed breakout could trigger a strong upside move. Eyes on the daily close! 👀
Targets after breakout:
🎯 $0.1287
🎯 $0.1525
🎯 $0.1718
🎯 $0.1911
🎯 $0.2185
🎯 $0.2535
⚠️ Always use a tight stop-loss to manage risk and protect your capital.
KAIA Buy/Long Setup (12H)It seems that a large symmetrical pattern has completed, and the price has broken out above the resistance line. We are looking for Buy/Long positions on pullbacks.
We have identified two entry points for this asset. If the price reaches these entry zones, we will enter a position.
The targets are also marked on the chart.
A daily candle closing below the invalidation level will invalidate this analysis.
For risk management, please don't forget stop loss and capital management
When we reach the first target, save some profit and then change the stop to entry
Comment if you have any questions
Thank You