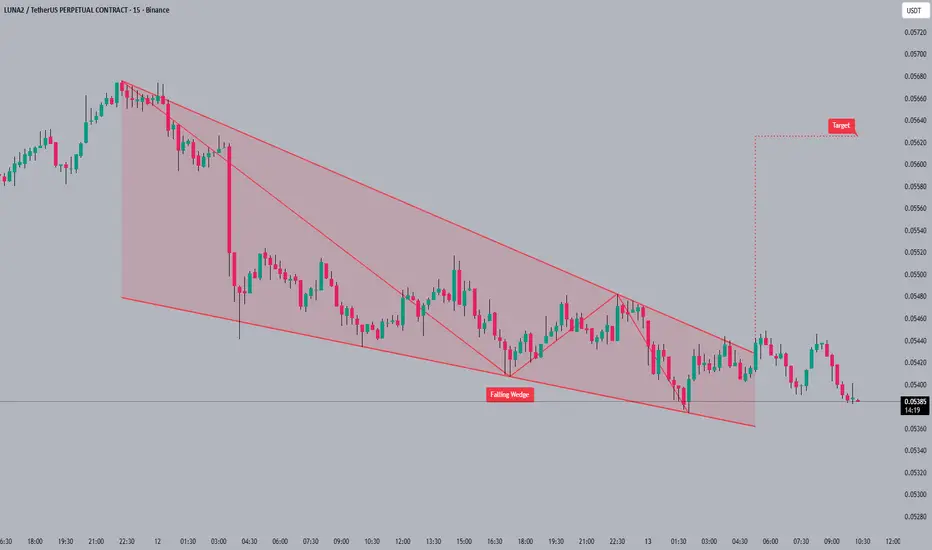
#LUNA/USDT Bottom & Bullish Reversal#LUNA
The price is moving within a descending channel on the 1-hour timeframe and has reached the lower boundary. It is now poised for a bounce and is expected to retest this boundary.
The Relative Strength Index (RSI) indicates a downward trend, which is likely to continue given the overbought co
#LUNA/USDT Bottom & Bullish Reversal#LUNA
The price is moving within a descending channel on the 1-hour timeframe and has reached the lower boundary. It is now poised for a bounce and is expected to retest this boundary.
The Relative Strength Index (RSI) indicates a downward trend, which is likely to continue given the overbought co
LUNAUSDT Forming Bullish MomentumLUNAUSDT is forming a clear bullish momentum pattern, a classic bullish continuation signal that often points toward a strong breakout in the near future. The price has been consolidating within a tightening range, suggesting that selling pressure is gradually weakening while buyers continue to rega
LUNAUSDT Forming Bullish MomentumLUNAUSDT is forming a clear bullish momentum pattern, a classic bullish wave signal that often indicates an upcoming breakout. The price has been consolidating within a narrowing range, suggesting that selling pressure is weakening while buyers are beginning to regain control. With consistent volume
LUNA 1H: Support-to-Resistance FlipPrice was squeezed into a triangle. It has now broken below the bottom support line, signaling a move down.
The Trend: The red line (Moving Average) is above the price, acting as a "ceiling" that keeps pushing it lower.
The Plan:
Entry: You are entering "Short" at $0.0594.
Stop Loss (Red): If it
LUNAUSDT – 4H Chart Analysis (Supply-based Short Setup)
BINANCE:LUNAUSDT is currently trading in a bearish market structure on the 4-hour timeframe, with price consistently forming lower highs and lower lows, confirming sustained selling pressure.
🔴 Key Technical Observations
Supply Zone: $0.0693 – $0.0731
Price will retrace into a well-defined supp
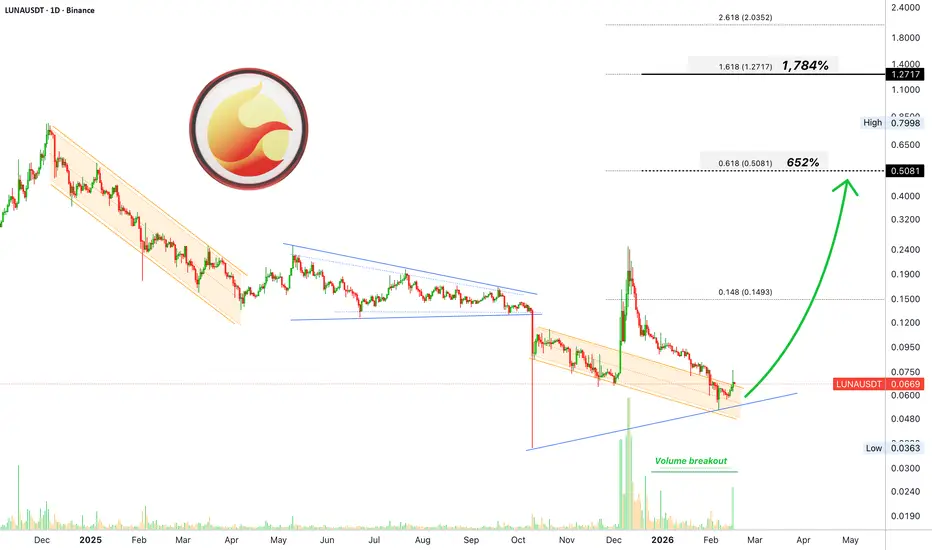
Terra (LUNA) —Second wave aims at $0.51 (652% profits potential)We have a very dynamic chart here. Resistance being challenged through a major jump, a rejection and lower low/higher low. A volume breakout opens new possibilities... A repeat of early December 2025, a new bullish phase.
Good evening God, how are you feeling today?
Godlike, love like, life like;
#LUNA/USDT Bottom & Bullish Reversal#LUNA
The price is moving in a descending channel on the 1-hour timeframe. It has reached the lower boundary and is heading towards a breakout, with a retest of the upper boundary expected.
We are seeing a bearish trend in the Relative Strength Index (RSI), which has reached near the lower boundar
See all ideas
Summarizing what the indicators are suggesting.
Oscillators
Neutral
SellBuy
Strong sellStrong buy
Strong sellSellNeutralBuyStrong buy
Oscillators
Neutral
SellBuy
Strong sellStrong buy
Strong sellSellNeutralBuyStrong buy
Summary
Neutral
SellBuy
Strong sellStrong buy
Strong sellSellNeutralBuyStrong buy
Summary
Neutral
SellBuy
Strong sellStrong buy
Strong sellSellNeutralBuyStrong buy
Summary
Neutral
SellBuy
Strong sellStrong buy
Strong sellSellNeutralBuyStrong buy
Moving Averages
Neutral
SellBuy
Strong sellStrong buy
Strong sellSellNeutralBuyStrong buy
Moving Averages
Neutral
SellBuy
Strong sellStrong buy
Strong sellSellNeutralBuyStrong buy
Displays a symbol's price movements over previous years to identify recurring trends.