#LUNA/USDT Bottom & Bullish Reversal#LUNA
The price is moving within a descending channel on the 1-hour timeframe and has reached the lower boundary. It is now poised for a bounce and is expected to retest this boundary.
The Relative Strength Index (RSI) indicates a downward trend, which is likely to continue given the overbought conditions.
There is a key support zone in green at 0.0448. The price has bounced off this zone several times, making it a strong support level.
The price is trending towards the 100-period moving average, which we are approaching. This trend supports an upward move.
Entry Price: 0.0480
Target 1: 0.0486
Target 2: 0.0494
Target 3: 0.0503
Stop Loss: At the resistance zone in green
Remember this simple rule: Money management.
Any questions? Please leave a comment.
Thank you.
In-depth trading ideas
#LUNA/USDT Bottom & Bullish Reversal#LUNA
The price is moving within a descending channel on the 1-hour timeframe and has reached the lower boundary. It is now poised for a bounce and is expected to retest this boundary.
The Relative Strength Index (RSI) indicates a downward trend, which is likely to continue given the overbought conditions.
There is a key support zone in green at 0.0450. The price has bounced off this zone several times, making it a strong support level.
The price is trending towards the 100-period moving average, which we are approaching. This trend supports an upward move.
Entry Price: 0.0513
Target 1: 0.0485
Target 2: 0.0498
Target 3: 0.0513
Stop Loss: At the resistance zone in green
Remember this simple rule: Money management.
Any questions? Please leave a comment.
Thank you.
LUNAUSDT Forming Bullish MomentumLUNAUSDT is forming a clear bullish momentum pattern, a classic bullish continuation signal that often points toward a strong breakout in the near future. The price has been consolidating within a tightening range, suggesting that selling pressure is gradually weakening while buyers continue to regain control around key support levels. This type of setup is commonly associated with accumulation phases before a major bullish move begins.
The projected breakout from this bullish momentum structure could lead to an impressive gain of around 90% to 100% if the price confirms above the resistance zone with strong volume support. This pattern is frequently observed after corrective phases and may signal a transition from bearish sentiment into a fresh bullish trend.
Traders closely watching LUNAUSDT are noticing strengthening momentum as the price approaches a critical breakout area. The consistent trading volume adds confidence to the setup, showing that buyers may already be accumulating positions in anticipation of a bullish continuation move.
Growing investor interest in LUNAUSDT reflects increasing confidence in both its technical structure and long-term upside potential. If the breakout confirms with sustained buying pressure and strong follow-through momentum, this could mark the beginning of a powerful bullish wave.
✅ Show your support by hitting the like button and
✅ Leaving a comment below! (What is your opinion about this coin?)
Your feedback and engagement keep me inspired to share more insightful market analysis with you!
LUNAUSDT Forming Bullish MomentumLUNAUSDT is forming a clear bullish momentum pattern, a classic bullish wave signal that often indicates an upcoming breakout. The price has been consolidating within a narrowing range, suggesting that selling pressure is weakening while buyers are beginning to regain control. With consistent volume confirming accumulation at lower levels, the setup hints at a potential bullish breakout soon. The projected move could lead to an impressive gain of around 50% to 60% once the price breaks above the wedge resistance.
This bullish momentum pattern is typically seen at the end of downtrends or corrective phases, and it represents a potential shift in market sentiment from bearish to bullish. Traders closely watching LUNAUSDT are noting the strengthening momentum as it nears a breakout zone. The good trading volume adds confidence to this pattern, showing that market participants are positioning early in anticipation of a reversal.
Investors’ growing interest in LUNAUSDT reflects rising confidence in the project’s long-term fundamentals and current technical strength. If the breakout confirms with sustained volume, this could mark the start of a fresh bullish leg. Traders might find this a valuable setup for medium-term gains, especially as the wedge pattern completes and buying momentum accelerates.
✅ Show your support by hitting the like button and
✅ Leaving a comment below! (What is your opinion about this coin?)
Your feedback and engagement keep me inspired to share more insightful market analysis with you!
LUNA 1H: Support-to-Resistance FlipPrice was squeezed into a triangle. It has now broken below the bottom support line, signaling a move down.
The Trend: The red line (Moving Average) is above the price, acting as a "ceiling" that keeps pushing it lower.
The Plan:
Entry: You are entering "Short" at $0.0594.
Stop Loss (Red): If it hits $0.0628, the trade failed; get out to protect your money.
Take Profit (Green): Your target is $0.0432, where you expect the price to land.
Bottom Line: You are betting the price will fall. The potential profit is much larger than the potential loss , which makes this a mathematically sound setup.
LUNAUSDT – 4H Chart Analysis (Supply-based Short Setup)
BINANCE:LUNAUSDT is currently trading in a bearish market structure on the 4-hour timeframe, with price consistently forming lower highs and lower lows, confirming sustained selling pressure.
🔴 Key Technical Observations
Supply Zone: $0.0693 – $0.0731
Price will retrace into a well-defined supply (sell) zone, which previously acted as a strong rejection area. This zone is now acting as dynamic resistance, aligning with prior distribution.
VWAP Confluence:
The VWAP indicator is positioned above price, reinforcing bearish bias. Every attempt by price to reclaim VWAP has resulted in rejection, indicating sellers remain in control.
Entry Zone: $0.0711
The marked entry sits within the supply zone, offering a favorable risk-to-reward short opportunity if bearish confirmation persists.
🛑 Risk Management
Stop Loss: $0.0771
Placed above the supply zone high, invalidating the setup if price breaks and holds above this level.
🎯 Downside Targets
Target 1: $0.0636
First support and partial profit zone, aligned with recent consolidation lows.
Target 2: $0.0531
Major downside target near higher-timeframe liquidity and previous demand, suitable for full profit booking.
📌 Trade Bias Summary
Trend: Bearish
Setup Type: Supply-zone rejection + VWAP resistance
Bias: Short on pullbacks into resistance
As long as price remains below the supply zone and VWAP, bearish continuation toward lower targets remains the higher-probability scenario. A clean break and acceptance above the supply zone would invalidate this short bias.
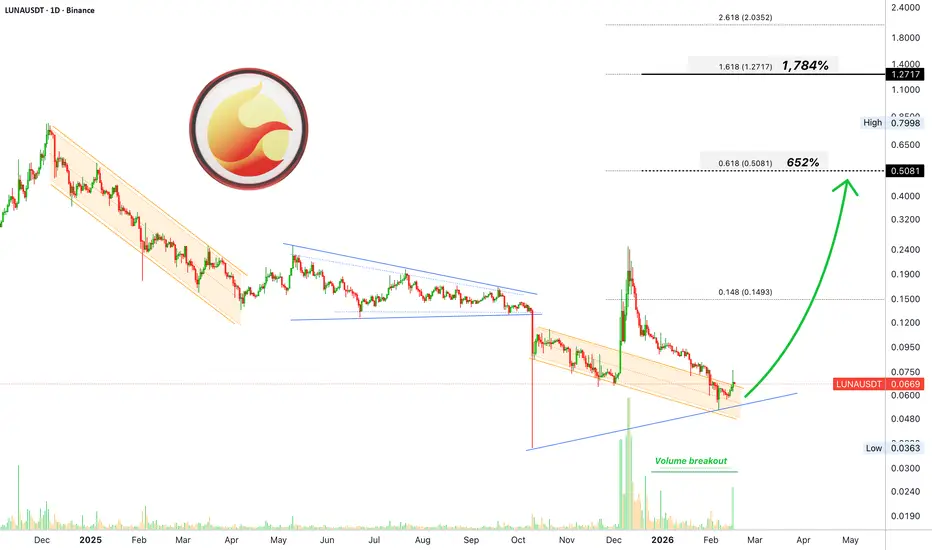
Terra (LUNA) —Second wave aims at $0.51 (652% profits potential)We have a very dynamic chart here. Resistance being challenged through a major jump, a rejection and lower low/higher low. A volume breakout opens new possibilities... A repeat of early December 2025, a new bullish phase.
Good evening God, how are you feeling today?
Godlike, love like, life like; alive and well. What about you?
The previous move in December ended as a double-top vs May 2025. Then we have this lower low and the start of a new bullish move.
Obviously, LUNAUSDT wasn't strong enough to break resistance so prices move lower to build-up strength. Ok, the retrace is complete so, here we go again.
The dates are the same as with Bitcoin and most of the altcoins: A low 6-February followed by a recovery and then some consolidation, a bullish resumption in the last three days.
The question remains, can Terra (LUNAUSDT) produce a higher high compared to December 2025?
It is possible. The move in December lasted only 9 days, that's a very short time. Most likely just a whale buying made the market jump. If we get a bullish wave now rather than a bullish jump, then a higher high is certainly possible, the most likely scenario.
The target we are aiming for on this chart and pair is $0.51.
Nine days of bullish action gave us a 275% positive move. 1-2 months of bullish action can do many times better. Makes sense? The rest is to wait.
We analyze the data, track the prices and the chart, the market takes care of the rest.
Find the bottom, buy and hold and then, we pray... Amen!
Namaste.
#LUNA/USDT Bottom & Bullish Reversal#LUNA
The price is moving in a descending channel on the 1-hour timeframe. It has reached the lower boundary and is heading towards a breakout, with a retest of the upper boundary expected.
We are seeing a bearish trend in the Relative Strength Index (RSI), which has reached near the lower boundary, and an upward bounce is expected.
There is a key support zone in green at 0.0922, and the price has bounced from this level several times. Another bounce is expected.
We are seeing a trend towards stabilizing above the 100-period moving average, which we are approaching, supporting the upward trend.
Entry Price: 0.0939
First Target: 0.0958
Second Target: 0.0980
Third Target: 0.1007
Remember a simple principle: Money Management.
Place your stop-loss order below the green support zone.
For any questions, please leave a comment.
Thank you.
#LUNA/USDT Bottom & Bullish Reversal#LUNA
The price is moving in a descending channel on the 1-hour timeframe. It has reached the lower boundary and is heading towards breaking above it, with a retest of the upper boundary expected.
We have a downtrend on the RSI indicator, which has reached near the lower boundary, and an upward rebound is expected.
There is a key support zone in green at 0.1016. The price has bounced from this zone multiple times and is expected to bounce again.
We have a trend towards consolidation above the 100-period moving average, as we are moving close to it, which supports the upward move.
Entry price: 0.1030
First target: 0.1043
Second target: 0.1065
Third target: 0.1092
Don't forget a simple principle: money management.
Place your stop-loss order below the support zone in green.
For any questions, please leave a comment.
Thank you.
LUNA2USDT may continue to dumpThe pump was stopped in the 0.25 zone. Seller strength is beginning to dominate due to profit-taking. The coin is stopping near buyers at 0.1564, but based on market behavior, the bulls have no chance.
Volumes are declining. The reaction to support is weakening, as is buyer strength. A closing price below 0.1564 could mark the beginning of a new phase of decline.
Scenario: consolidation below the nearest key support level. Further decline to 0.1397 - 0.1216
#LUNA/USDT Bottom & Bullish Reversal#LUNA
The price is moving within a descending channel on the 1-hour frame, adhering well to it, and is heading for a strong breakout and retest.
We have a bearish trend on the RSI indicator that is about to be broken and retested, supporting the upside.
There is a major support area (in green) at 0.2617, which represents a strong basis for the upside.
For inquiries, please leave a comment.
We are in a consolidation trend above the 100 moving average.
Entry price: 0.2823
First target: 0.3000
Second target: 0.3133
Third target: 0.3331
Don't forget a simple matter: capital management.
When you reach the first target, save some money and then change your stop-loss order to an entry order.
For inquiries, please leave a comment.
Thank you.
LUNA – Multiple Touches on the Long-Term Downtrend Line. LUNA has been moving within a consistent long-term downtrend , confirmed by several clean touches of the descending trendline over the past few years. Each retest has reinforced the strength of this resistance zone, but the recent volatility spike suggests that momentum may finally be shifting.
Price once again approached the trendline after an extended period of decline, and the reaction here will be crucial. If bulls manage to break above this multi-year structure, the chart opens a path toward a much deeper recovery.
The key target to watch is the $1.00 area , which aligns with the 0.618 Fibonacci retracement of the entire downside move. This level acts as a natural magnet during strong corrective rallies and could become the primary mid-term objective if the breakout confirms.
In short, the market has spent a long time suppressed under the trendline, and it may finally be time for some upside revival . A confirmed break and retest could trigger a strong relief rally toward the $1 zone.
LUNA Short Setup Loading
LUNA is approaching a major resistance at $0.2974, a level that has historically rejected price with strong selling pressure.
A liquidity grab + rejection from this zone could trigger a multi-week correction.
🎯 Short Targets:
T1 → $0.1689
T2 → $0.1006
Structure shows a clear lower-high formation before a potential breakdown — high-probability short zone ahead🚨
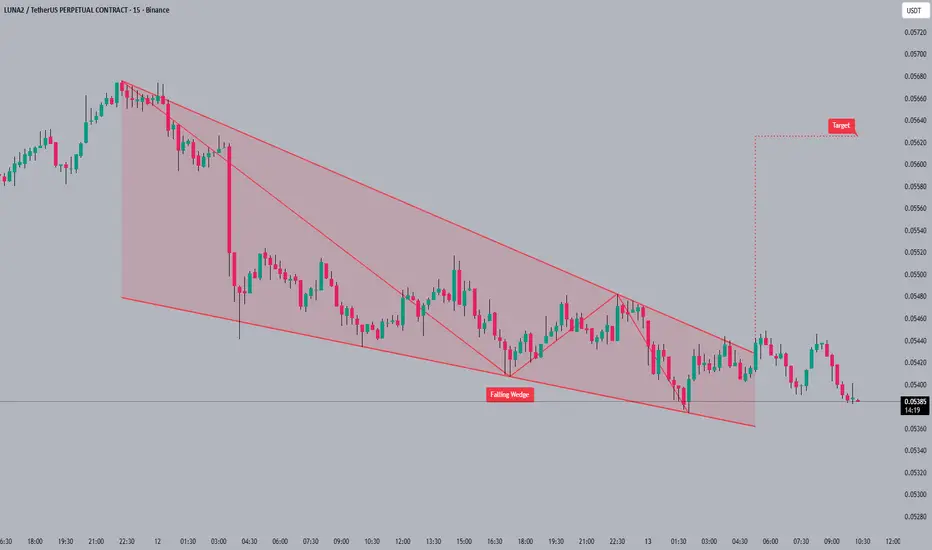
LUNAUSDT Forming Falling WedgeLUNAUSDT is forming a clear falling wedge pattern, a classic bullish reversal signal that often indicates an upcoming breakout. The price has been consolidating within a narrowing range, suggesting that selling pressure is weakening while buyers are beginning to regain control. With consistent volume confirming accumulation at lower levels, the setup hints at a potential bullish breakout soon. The projected move could lead to an impressive gain of around 90% to 100% once the price breaks above the wedge resistance.
This falling wedge pattern is typically seen at the end of downtrends or corrective phases, and it represents a potential shift in market sentiment from bearish to bullish. Traders closely watching LUNAUSDT are noting the strengthening momentum as it nears a breakout zone. The good trading volume adds confidence to this pattern, showing that market participants are positioning early in anticipation of a reversal.
Investors’ growing interest in LUNAUSDT reflects rising confidence in the project’s long-term fundamentals and current technical strength. If the breakout confirms with sustained volume, this could mark the start of a fresh bullish leg. Traders might find this a valuable setup for medium-term gains, especially as the wedge pattern completes and buying momentum accelerates.
✅ Show your support by hitting the like button and
✅ Leaving a comment below! (What is your opinion about this Coin?)
Your feedback and engagement keep me inspired to share more insightful market analysis with you!
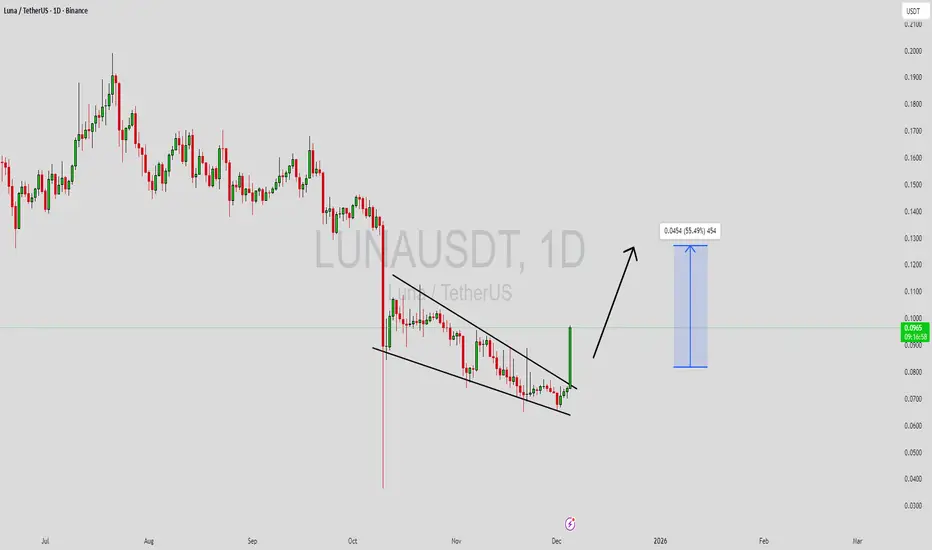
LUNAUSDT Forming Falling WedgeLUNAUSDT is forming a clear falling wedge pattern, a classic bullish reversal signal that often indicates an upcoming breakout. The price has been consolidating within a narrowing range, suggesting that selling pressure is weakening while buyers are beginning to regain control. With consistent volume confirming accumulation at lower levels, the setup hints at a potential bullish breakout soon. The projected move could lead to an impressive gain of around 40% to 50% once the price breaks above the wedge resistance.
This falling wedge pattern is typically seen at the end of downtrends or corrective phases, and it represents a potential shift in market sentiment from bearish to bullish. Traders closely watching LUNAUSDT are noting the strengthening momentum as it nears a breakout zone. The good trading volume adds confidence to this pattern, showing that market participants are positioning early in anticipation of a reversal.
Investors’ growing interest in LUNAUSDT reflects rising confidence in the project’s long-term fundamentals and current technical strength. If the breakout confirms with sustained volume, this could mark the start of a fresh bullish leg. Traders might find this a valuable setup for medium-term gains, especially as the wedge pattern completes and buying momentum accelerates.
✅ Show your support by hitting the like button and
✅ Leaving a comment below! (What is your opinion about this Coin?)
Your feedback and engagement keep me inspired to share more insightful market analysis with you!
$LUNA/USDT ANALYSISOn the 1-day chart of **LUNA/USDT**, price recently broke out of a descending channel that had been forming since early October. The breakout candle closed strongly above the channel resistance with a noticeable surge in volume, confirming renewed bullish momentum after an extended downtrend. The breakout also coincides with a retest of the EMA resistance area and the lower edge of the Ichimoku cloud, showing early signs of trend reversal strength. As long as price holds above the breakout level near **$0.074–0.075**, buyers could target the next resistance levels around **$0.087** and **$0.090**, where the 200-day EMA and cloud resistance converge. A daily close back inside the channel would invalidate this bullish bias. Overall, the structure suggests a potential shift from bearish to bullish sentiment, with the breakout supported by volume and momentum confirmation.