Gold Hints at Quiet Accumulation as Bulls Seek DipsGold made a mild attempt to reverse its trend and break above its bearish trendline, although falling volumes suggest the move lacks strong bullish conviction for now. However, the sharp rejection of $4,100 ahead of the bounce suggests quiet accumulation may be underway, with bulls potentially seeking dips while prices hold above $4,082.
The 4-hour chart shows support around the weekly pivot point and monthly VWAP, potentially paving the way for a minor bounce. However, with the US dollar remai
In-depth trading ideas
Tools of the Trade: Bar ReplayTools of the Trade – Session 1: Backtesting / Bar Replay
In this first Tools of the Trade session, we dive into one of the most important habits a trader can build: backtesting.
This session is designed to help traders move beyond guessing and start developing confidence through repetition, observation, and deliberate practice. Using TradingView Bar Replay, we walk through how to study price action, review market behavior, and begin testing ideas against the hard right edge — where decisions hav
5 Ways to Build Better Trading DisciplineMarkets move quickly. Prices change, volatility expands, and opportunities can appear to arrive all at once.
But the traders who last are often not the ones chasing every move. They are the ones who build a process, define their rules, manage their risk, and know when patience is the better trade.
In this idea, we’ll look at five simple ways to build more discipline into your trading routine.
(For illustrative purposes)
📌 1. Research Each Trade
A thesis is simply your reason for ta
Gold Futures (MGC) Breakout Plan — Week of 12 October 2026Gold Futures (MGC) Breakout Plan — Week of 12 October 2026
11 Oct 2026 ·
Summary
This week's plan is a breakout bracket on Micro Gold futures. I'll buy above 4,232.40 if price breaks out of Friday's range, or sell into the 4,204.30–4,186.30 zone if it breaks down. Only one side should trigger, so the two orders are one-cancels-the-other.
The sell side has stronger support. A Fibonacci retracement lines up almost exactly with the sell zone, and the short-term rising trendline had already broke
GOLD Struggles To Hold Support. CPI Data Looms!In this Weekly Market Forecast, we will analyze Gold for the week of Oct 12-16th.
Gold (XAU/USD) is showing bearish momentum for the immediate short term, despite maintaining a structurally bullish posture over the longer horizon. Despite finding a slight relief rebound to end last week around $4,216.30, the continued reduction in speculative open interest points to an uphill battle for bulls. Analysts note that unless gold can firmly claim a weekly close back above the $4,300 threshold, the n
Gold Futures (MCX) | 1H — Channel Resistance Rejection
Gold Futures faced rejection near the descending channel resistance. If the selling pressure continues, the next downside target is around **₹144,000**.
A sustained move above channel resistance would invalidate this bearish setup.
#GoldFutures #MCX #TechnicalAnalysis #TradingView
Trading Craft 101 · Lesson 07 - Review & Iterate🔵 THE LOOP
Edge is not found, it is built - and it is built in a loop: trade, record, review, adjust, trade again. Most traders break the loop at the review step. They trade, they record (sometimes), and they never close the circle. This lesson is about the step that makes everything else pay.
🔵 PROCESS, NOT OUTCOME
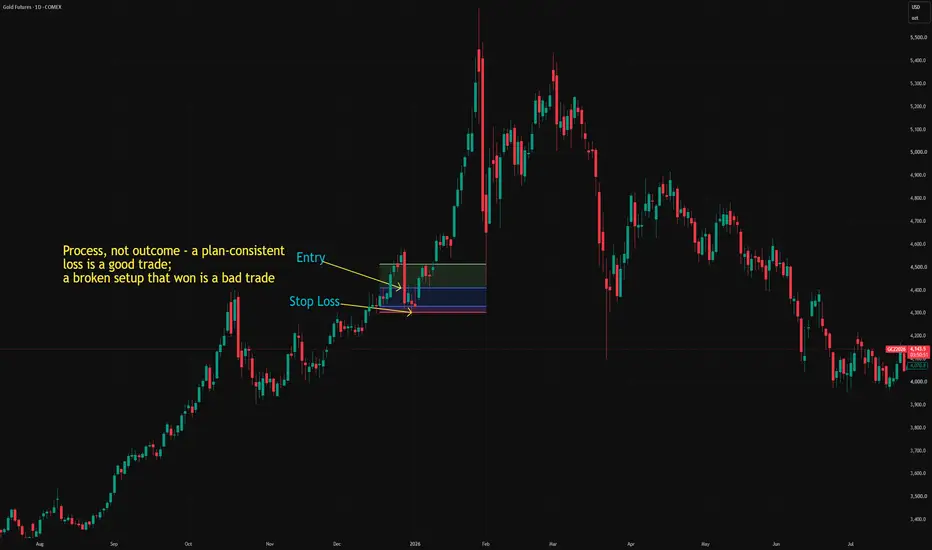
Judge the process, not the result. A perfect setup that loses was a good trade; a broken setup that wins was a bad trade. If you grade by outcome, you will repeat mistakes that
Gold Under Pressure: War, Fed and Real Yields
Gold is about 25% below its late-January record, and most of the fall came after the war began on February 28. Gold is typically supported by geopolitical uncertainty, yet it has fallen since the war began. The key explanation is that the war has also pushed up oil prices, strengthening inflation concerns and expectations of further Fed tightening. Since the war began, real yields and the dollar have both risen, and gold has fallen.
Real yields are nominal interest rates minus inflation. Risi
GOLD: Bearish! Wait For Confirmation, Then Sell It!In this Weekly Market Forecast, we will analyze Gold for the week of Oct 5-9th.
Gold (XAU/USD) carries a dominant bearish institutional order flow and narrative heading into the coming week, but is currently trading inside a W -iFVG where the price has consolidated in the lower half of array. This is supported by the overlapping Daily -FVG price is currently finding resistance inside of.
Enjoy!
May profits be upon you.
Leave any questions or comments in the comment section.
I appreciate any
Gold Update 05OCT2026: Double Three Correctionprice is charting possible double three corrective structure WXY (white)
we have three waves down from the all-time high in wave W
I assume the wave X could be a triangle as zigzags gets narrower over time
wave ABC are done, wave D is about to be completed
final wave E is expected to hit between $4,500 (61.8% of wave D) and $4,650 (trendline barrier)
after that, the wave Y is expected to unfold in three waves down to potentially hit
the valley of the lower degree wave 4 at $3,300
Potential Bullish flip on MGC Daily Demand ZoneGold — Daily Demand Zone Is the Main Area I’m Watching
My short-term bias on Gold remains bearish into the Daily Demand Zone at 4031.5–3935.4.
Before reaching that Demand, I see potential for temporary shorts from the 4205.3–4259.0 Supply Zone if price reacts there. However, I’m not looking at those shorts as the larger directional idea, they’re part of the move I’m watching into demand.
Once Gold reaches 4031.5–3935.4, I’ll be looking to flip bullish, assuming the demand zone holds and price co
Gold futures chart trade idea for the coming week 04/10/26GOLD FUTURES (COMEX Micro Gold MGC1!) - WEEKLY SELL SETUP ANALYSIS
Week of Mon 5 Oct - Fri 9 Oct 2026 | Prepared Sun 4 Oct 2026, 13:52 UTC
Last price 4,171.90 (Friday close). All times UTC.
All numbers computed from the chart's weekly / daily / 4H / 1H / 15M data.
=====================================================================
1. LEVELS ON THE CHART
---------------------------------------------------------------------
Sell zone 4,213.28 - 4,299.31 (orange box)
Sell level
Gold (GC) Analysis, Key-Zones, Setup for Tue (Oct 6)Bias: The December gold contract settled Monday at 4,156.8, down 5.5 points or 0.13 percent, after trading between 4,198.9 and 4,150.4, a 48.5 point daily range. The settle finished 13.2 percent of the way up from the low. Those extremes are the completed-session inputs behind the published pivot ladder, and they match the chart's daily bar. The range was 0.55 times the 14-day average daily range of 87.8 points, the narrowest since 05/22, and the settle was the lowest since 08/04. The preserved
High Yields And A Strong USD Continue To Pressure GOLDIn this Weekly Market Forecast, we will analyze Gold for the week of Sep 28 - Oct 2nd.
Gold is currently facing a short-term bearish bias due to surging U.S. Treasury yields, a stronger U.S. dollar, and hawkish Federal Reserve rate expectations.
Markets are watching upcoming reports like JOLTS job openings, consumer confidence, ISM manufacturing PMI, and the September non-farm payrolls report for direction.
Enjoy!
May profits be upon you.
Leave any questions or comments in the comment section
Gold ReversalTo me, the downside directional energy is exhausted and this market is ready to go up or for it to be viable to buy a pullback at support.
At the same time, I doubt it will reach the gap and drop back down.
At least now with this information I maintain a "bullish" outlook that "promises" to have chances of reaching the upper red line.
Gold (GC) Analysis, Key-Zones, Setup for Fri (Oct 2)Bias: The December gold contract settled Thursday at 4,202.3, up 15.6 points or 0.37 percent, after trading between 4,222.8 and 4,169.4, a 53.4 point daily range. The settle finished 61.6 percent of the way up from the low. Those extremes are the completed-session inputs behind the published pivot ladder, and they match the chart's daily bar. It was a third consecutive higher settle and the largest one-day gain since 09/25, while the range was 0.60 times the 14-day average daily range of 88.3 p
Gold (GC) Analysis, Key-Zones, Setup for Thu (Oct 15)Bias: The December gold contract settled Wednesday at 4,107.9, down 69.4 or 1.66 percent, for a third consecutive lower settle. The session traded between 4,193.5 and 4,095.0, a 98.5 point daily range with a lower high and a lower low against Tuesday, and the settle finished 13.1 percent of the way up from the low. Those extremes are the completed-session inputs behind the published pivot ladder, and they match the chart's daily bar. The settle was the lowest since 08/03 and the decline the lar
Gold: hedge funds cut longs 24% while ETFs hit a recordGold has two very different buyers this autumn, and the weekly COT report shows one of them walking away.
The exit. In the CFTC report dated August 25, Managed Money (hedge funds and CTAs) was net long 151,315 COMEX gold contracts. In the report dated October 6 it was 114,820. That is a cut of 36,495 contracts, or 24 percent, in six weeks, and the smallest net long since June 23.
Closing longs, not betting on a fall. Long contracts fell by 32,970 while shorts rose by only 3,525, so about 90 pe
Gold Buy
Liquidity Sweep: Price executed a clean sweep below the 1H Sell-Side Liquidity ($4,169.7) and 4H Sell-Side Liquidity ($4,173.7) levels, taking out retail stops to engineer liquidity.
Market Structure: Following the liquidity hunt, price shifted momentum with a clear Change of Character (CHOCH) on lower timeframes, indicating institutional accumulation / smart money buying.
Key Targets:🎯 TP 1: 1H Buy-Side Liquidity @ $4,214.5 🎯 TP 2: 4H Buy-Side Liquidity / Supply Zone @ $4,224.8 – $4,2
Gold (GC) Analysis, Key-Zones, Setup for Wed (Oct 14)Bias: The December gold contract settled Tuesday at 4,177.3, down 13.3 points or 0.32 percent. The session traded between 4,224.8 and 4,169.7, a 55.1 point daily range with a lower high and a lower low against Monday. The settle finished 13.8 percent of the way up from the low, the second consecutive lower settle and the lowest settle since 10/08. Those extremes are the completed-session inputs behind the published pivot ladder, and they match the chart's daily bar. Gold fell on a day the dolla