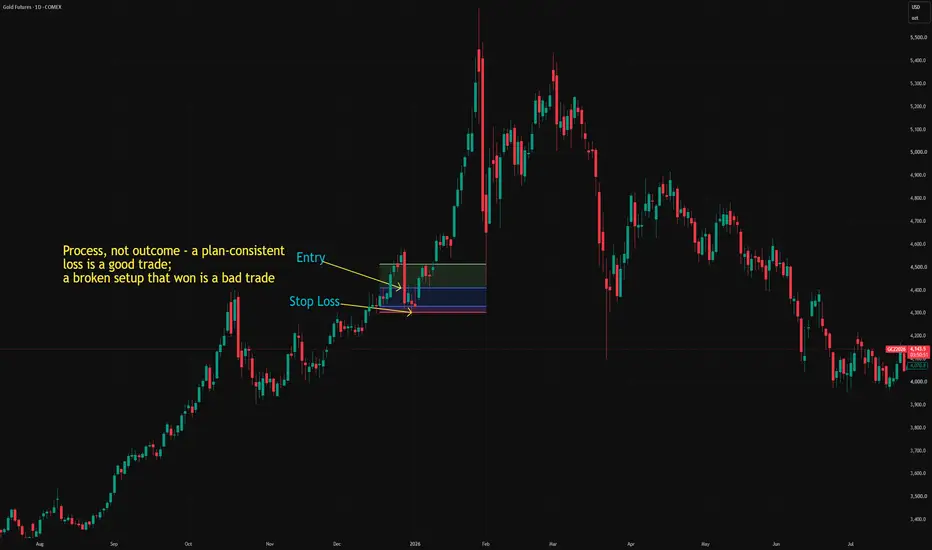
Potential Bullish flip on MGC Daily Demand ZoneGold — Daily Demand Zone Is the Main Area I’m Watching
My short-term bias on Gold remains bearish into the Daily Demand Zone at 4031.5–3935.4.
Before reaching that Demand, I see potential for temporary shorts from the 4205.3–4259.0 Supply Zone if price reacts there. However, I’m not looking at those
Sorry, this is only available to registered users
MCX provides data to our registered users only, so to get it you'll need to sign up for a TradingView account.
Compare with Gold Futures
5 Ways to Build Better Trading DisciplineMarkets move quickly. Prices change, volatility expands, and opportunities can appear to arrive all at once.
But the traders who last are often not the ones chasing every move. They are the ones who build a process, define their rules, manage their risk, and know when patience is the better trade.
The Power of RSI: Bullish and Bearish DivergencesGuys, on the chart, price moves down while RSI moves up.
That’s called a “bullish divergence” — price is falling but the indicator shows recovery.
It usually means the downtrend is losing strength.
On the other hand, if price moves up while RSI moves down, that’s a “bearish divergence.”
It
Gold Update 05OCT2026: Double Three Correctionprice is charting possible double three corrective structure WXY (white)
we have three waves down from the all-time high in wave W
I assume the wave X could be a triangle as zigzags gets narrower over time
wave ABC are done, wave D is about to be completed
final wave E is expected to hit between $4
GOLD: Bearish! Wait For Confirmation, Then Sell It!In this Weekly Market Forecast, we will analyze Gold for the week of Oct 5-9th.
Gold (XAU/USD) carries a dominant bearish institutional order flow and narrative heading into the coming week, but is currently trading inside a W -iFVG where the price has consolidated in the lower half of array. This
Gold (GC) Analysis, Key-Zones, Setup for Tue (Oct 6)Bias: The December gold contract settled Monday at 4,156.8, down 5.5 points or 0.13 percent, after trading between 4,198.9 and 4,150.4, a 48.5 point daily range. The settle finished 13.2 percent of the way up from the low. Those extremes are the completed-session inputs behind the published pivot l
Gold Under Pressure: War, Fed and Real Yields
Gold is about 25% below its late-January record, and most of the fall came after the war began on February 28. Gold is typically supported by geopolitical uncertainty, yet it has fallen since the war began. The key explanation is that the war has also pushed up oil prices, strengthening inflation
Gold Futures (MGC) Breakout Plan — Week of 12 October 2026Gold Futures (MGC) Breakout Plan — Week of 12 October 2026
11 Oct 2026 ·
Summary
This week's plan is a breakout bracket on Micro Gold futures. I'll buy above 4,232.40 if price breaks out of Friday's range, or sell into the 4,204.30–4,186.30 zone if it breaks down. Only one side should trigger, so
Trading Craft 101 · Lesson 07 - Review & Iterate🔵 THE LOOP
Edge is not found, it is built - and it is built in a loop: trade, record, review, adjust, trade again. Most traders break the loop at the review step. They trade, they record (sometimes), and they never close the circle. This lesson is about the step that makes everything else pay.
🔵
Gold futures chart trade idea for the coming week 04/10/26GOLD FUTURES (COMEX Micro Gold MGC1!) - WEEKLY SELL SETUP ANALYSIS
Week of Mon 5 Oct - Fri 9 Oct 2026 | Prepared Sun 4 Oct 2026, 13:52 UTC
Last price 4,171.90 (Friday close). All times UTC.
All numbers computed from the chart's weekly / daily / 4H / 1H / 15M data.
=================================
See all ideas
Summarizing what the indicators are suggesting.
Neutral
Neutral
Neutral
A representation of what an asset is worth today and what the market thinks it will be worth in the future.
Sorry, this is only available to registered users
MCX provides data to our registered users only, so to get it you'll need to sign up for a TradingView account.
Frequently asked questions
The nearest expiration date for Gold Futures is Apr 5, 2027.
Traders prefer to sell futures contracts when they've already made money on the investment, but still have plenty of time left before the expiration date. Thus, many consider it a good option to sell Gold Futures before Apr 5, 2027.
Open interest is the number of contracts held by traders in active positions — they're not closed or expired. For Gold Futures this number is 33.00. You can use it to track a prevailing market trend and adjust your own strategy: declining open interest for Gold Futures shows that traders are closing their positions, which means a weakening trend.
Buying or selling futures contracts depends on many factors: season, underlying commodity, your own trading strategy. So mostly it's up to you, but if you look for some certain calculations to take into account, you can study technical analysis for Gold Futures. Today its technical rating is sell, but remember that market conditions change all the time, so it's always crucial to do your own research. See more of Gold Futures technicals for a more comprehensive analysis.