SI UpdateSIlver is rallying with chip stocks again, I think it'll hit overbought on the daily chart like it did last time before it tanked. Waiting a few days before shorting it.by hungry_hippo221
Silver (SI1!) | Elliott Wave Structure and the Paths AheadSilver (SI1!) | Elliott Wave Structure and the Paths Ahead Silver’s long-term structure remains focused on the aggressive Elliott Wave scenario, shown by the blue path. Under this count, Silver may have completed a major Wave 1 at the 2011 peak, followed by a deep and complex Wave 2 correction. The current advance may now be the early stage of a larger Wave 3. However, a bullish structure does not mean price must move higher without corrections. From here, Silver may form a small short-term correction or develop a larger and more complex corrective pattern. The structure, depth, and relationship of that correction to the previous impulsive advance will help determine the more probable path. Gold and the U.S. Dollar Index (DXY) may provide additional context. Silver often moves positively with Gold and inversely with DXY, but Silver’s own price structure remains the primary basis for this analysis. Previous Weekly Analysis — Published May 17 | TradingView Editor’s Pick This previous analysis is not included as proof of a guaranteed forecast. It shows how Elliott Wave rules and guidelines can help organize market structure, define probable paths, and follow price as new information develops. A break above Silver’s historical peak may provide important confirmation of the bullish market structure. Until then, the wave count will continue to be evaluated through price behavior, wave relationships, Fibonacci levels, channels, and clearly defined validation or invalidation points. The blue path remains the aggressive scenario under consideration. The black path represents the more conservative alternative, allowing for a broader corrective development before the next major advance. Elliott Wave does not predict the future with certainty. It provides a structured framework for identifying probable paths and adapting to the market as new price information appears. Price is the result; structure reveals the probable paths. — Mr. Nobody | Elliott Wave PrincipleLongby Mehdi_Abbasi_EWP10
Silver Edges Higher - Bearish Targets Remain!Primary Scenario We continue to view silver as being in a downward move within a broader correction. The price is expected to break below support at $48.05 before extending its decline into our blue Long-Term Entry Range ($39.41–$25.75) and establishing a final low there. Once a bottom is reached, we anticipate a renewed uptrend. Alternative Scenario In our alternative scenario, silver would soon break above resistance at $90.11, setting a new interim high before also turning sharply lower from there (probability: 25%). Long-Term Outlook The weekly chart suggests the current downward move still has room to run. Alternatively, there is a chance of an imminent rally that could push silver above resistance at $121.79 and to a new all-time high (probability: 30%).Short01:57by HKCM_Global1
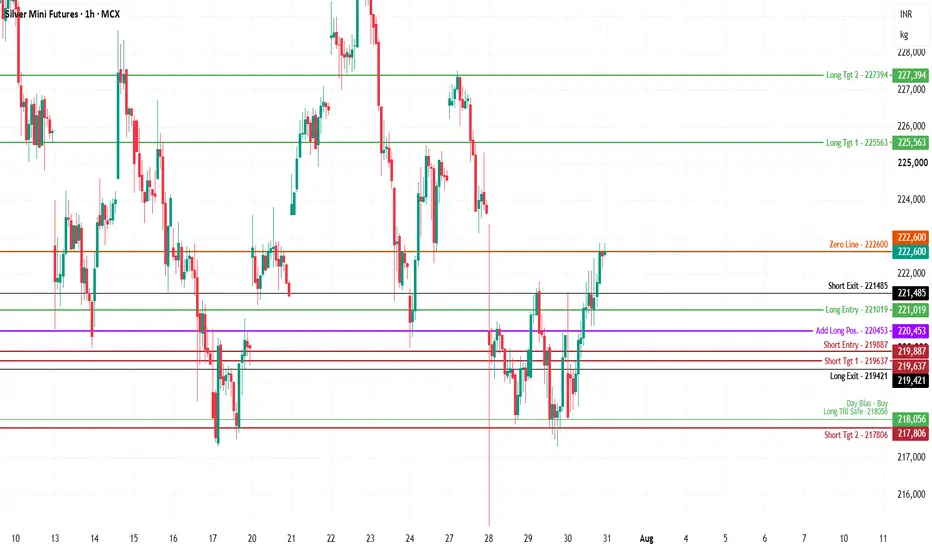
Silver Mini MCX Fut Intraday Technical Analysis for 31st July,26MCX:SILVERM1! Silver Mini Futures (MCX) | Technical Structure | July 31, 2026 Silver Mini is trading around 222,600, sitting directly on the 222,600 Zero Line. The contract has staged a solid multi-candle recovery off its lower structural demand zone near 218,056, pushing back up to test the central benchmark pivot. Price enters the session holding near its key decision level after absorbing recent selling pressure. Buyers are attempting to sustain momentum above this boundary to unlock higher targets, while sellers look to defend the Zero Line to trigger a pullback back toward the consolidation range. Wait for a high-volume candle to confirm acceptance away from this cluster before committing capital. Bullish Triggers Long Entry: Above 221,019 (strongly validated while price holds structural footing above the 220,453 Add Long Pos. band). Targets: 225,563 - 227,394 Risk Control: Structure weakens below 220,453. Hard exit below 219,421. Bearish Triggers Short Entry: Below 219,887 (validated if liquidity flushes push price back below the 222,600 Zero Line, establishing it as a strict supply ceiling). Targets: 219,637 - 217,806 Risk Control: Cover immediately above 221,485. Day Bias remains structurally protected above 218,056. No-Trade Chop Zone: 219,421 - 221,019 Expect rotational, choppy price action inside this decision range as commercial participants balance risk. Avoid over-trading early whipsaws inside this block; let a clean structural candle breakout provide true execution validation. Execution Rule: Structure first, confirmation next. Zero anticipation. Hit Boost and drop your view in the comments if you're tracking these levels today. #SilverMiniby ChartPathik1
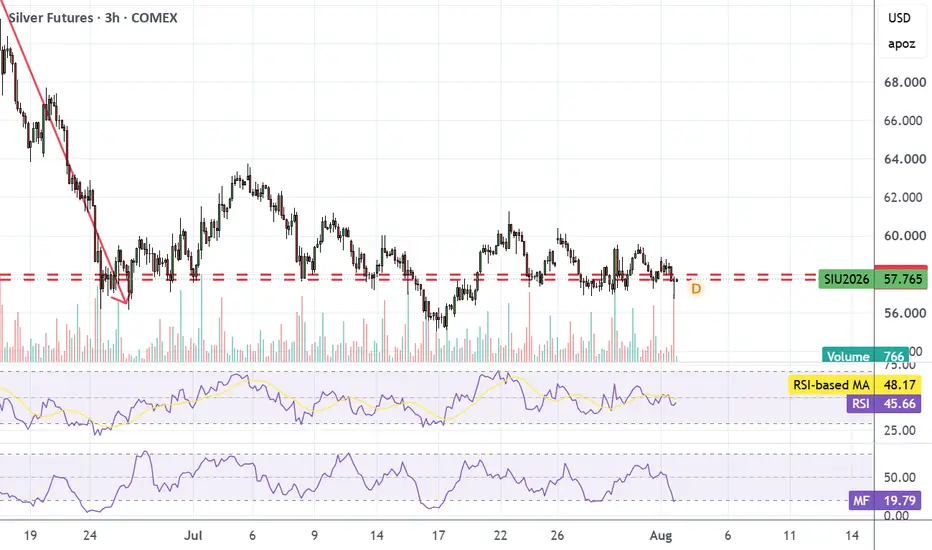
Silver UpdateMFI went oversold so I assume up. I'm not bullish on silver so don't yell at me if it doesn't go up, lol.by hungry_hippo112
Silver updateRIght back to $57, gold to $4k. I think I'm just gonna short any pumps, lolby hungry_hippo2
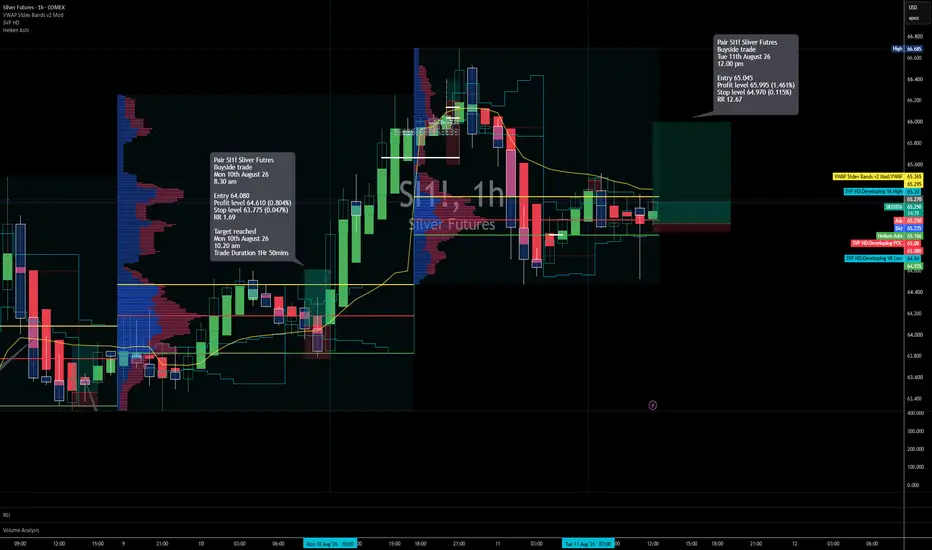
Long trade SI1! Silver Futures — SRL Trade Idea Tuesday 11 August 2026 Entry time: 12:00 PM Direction: 🟢 Buyside Timeframe: 15-minute Trade ticket Entry: 65.045 Stop: 64.970 Target: 65.995 Potential return: +1.461% Risk: 0.115% Risk-to-reward: 12.67R SRL market read Silver is attempting to build a buyside reversal from the lower end of the current intraday value structure. Price has already rotated down from the prior upper range and is now reacting around the 65.00 area, close to the lower developing value references. The entry at 65.045 is positioned near that lower-value zone rather than chasing price higher. The core SRL thesis is: lower-value test → sell-side rejection → reclaim → return to value → expansion toward upper session liquidity Key references Entry: 65.045 Invalidation: 64.970 Developing POC: around 65.09 Developing Value Area Low: around 64.91 Previous Session Close: around 65.27 VWAP: around 65.36 00:00 Opening Range Low: 65.58 00:00 Opening Range High: 66.035 Target: 65.995 The target sits just below the 00:00 Opening Range High at 66.035, which gives the setup a clear opposing-liquidity objective. Confirmation logic The trade strengthens if: 64.970 remains protected price reclaims the developing POC around 65.09 acceptance develops above 65.20–65.27 VWAP around 65.36 is recovered momentum then expands through 65.58 toward the upper opening-range objective The stop is very tight, so the lower reference must hold cleanly. Main risk The setup is still below several important overhead references. If price cannot reclaim 65.09–65.27, the market may remain balanced or seek the deeper developing value-area low near 64.91. That makes this a high-asymmetry setup, but the 12.67R projection only matters if the reclaim sequence confirms. Final read This is a strong-location SI1! buyside idea with a very tight structural stop and a logical target just beneath the upper opening-range liquidity. SRL Status: 🟡 Developing Buyside Invalidation: 64.970 Primary confirmation: reclaim 65.09 → 65.27 → VWAP 65.36 Target: 65.995 Planned RR: 12.67R @SNAPTradingFrameworkLongby davidjulien369Updated 0
SI UpdateMarket down big, silver not moving. Looks to me like $57 is the happy spot for silver, $4k for gold. We'll see if the Fed can tank gold, if not then there's no trade here.by hungry_hippo0
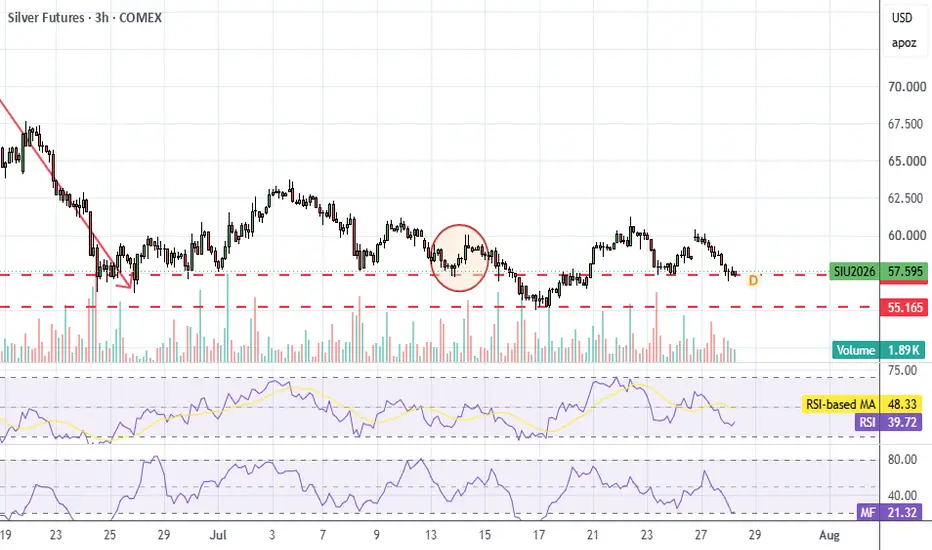
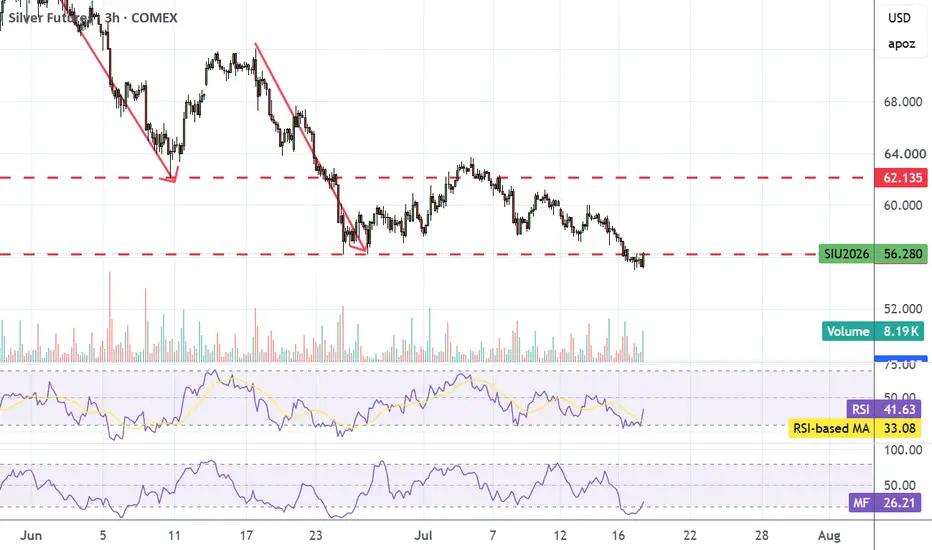
SI (silver) UpdateMFI hit oversold so we probably see a bounce like the circled spot. I'm still bearish for the Fed meeting tomorrow though.by hungry_hippo112
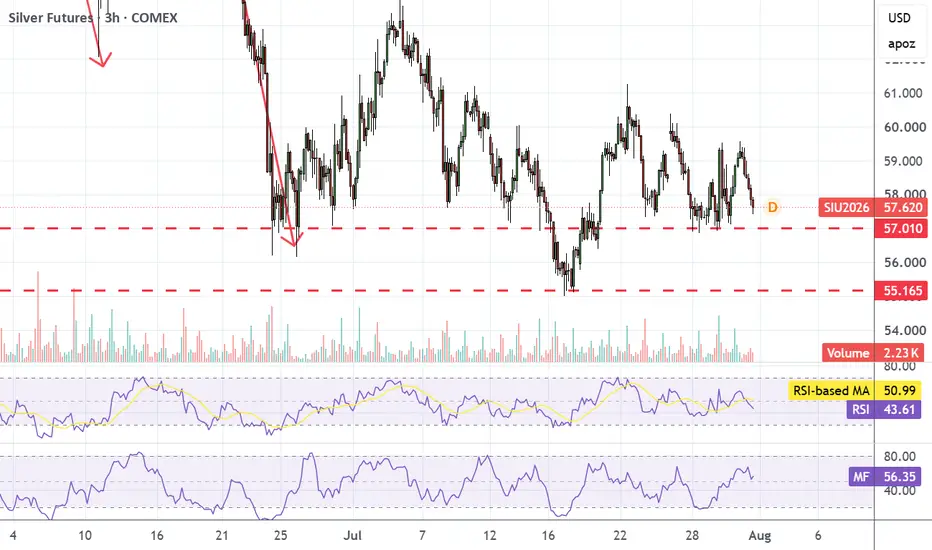
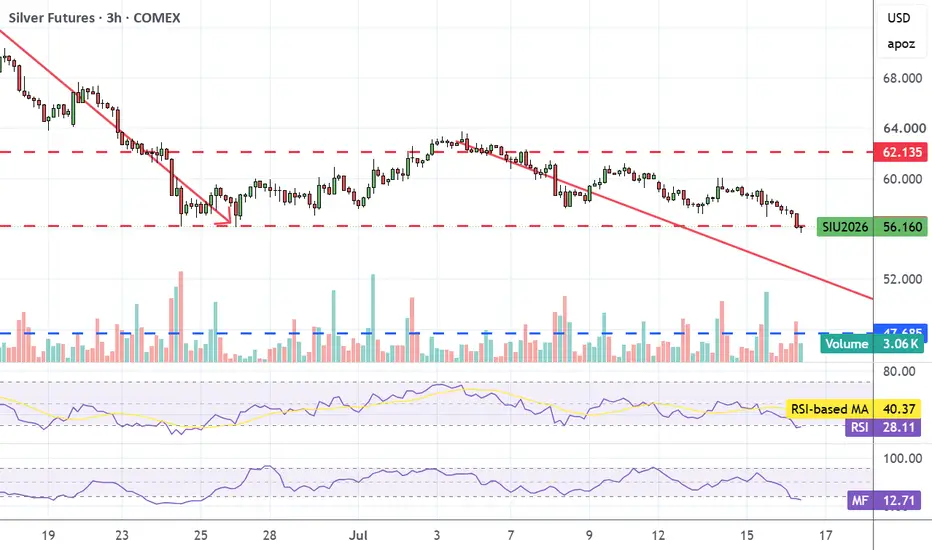
SI UpdateTesting support from last week, if it breaks then it's headed to the next one down, I've got it marked. Probably gonna retest that support anyways on Wed with teh Fed meeting coming up. Indicators are not oversold yet unlike BTC.by hungry_hippo1
Silver UpdateSilver and gold gapped up like index futures, the gap needs to fill. Looks like silver is already headed that way. Fed meeting Wed.by hungry_hippo1
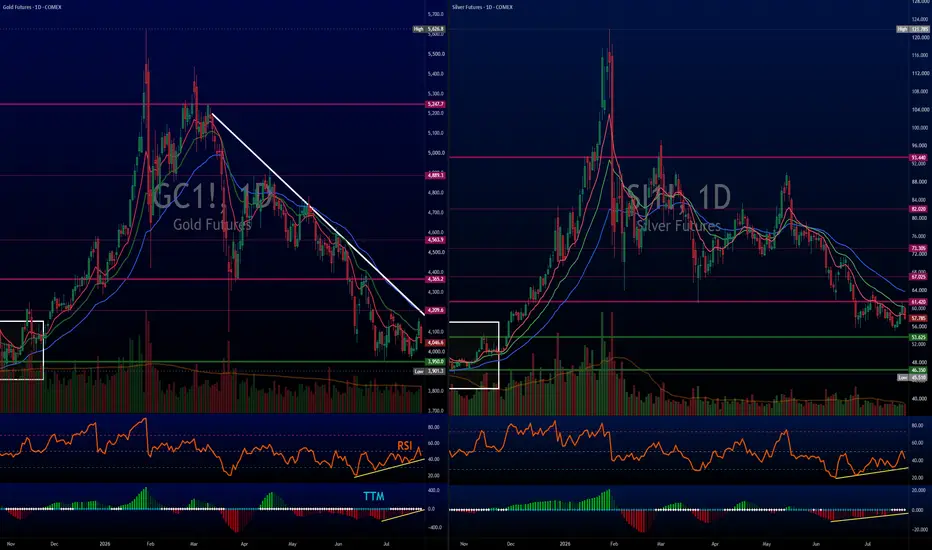
Short Term Gold Rally over?RSI and TTM are looking better while price continues to sag. This is a classic bullish divergence in a strong down trend. In other words, selling momentum is slowing down—the bears are running out of aggressive velocity. But price requires capital inflows to actually turn. Until price breaks above that daily white descending trendline on Gold, momentum is just an early warning system, not a buy signal. Do Interest Rates Have an Effect? Opportunity Cost: Neither Gold nor Silver pays a yield or dividend. When the 10 year Treasury yields climb toward 4.80% and potentially target 5.20%, institutional capital gets guaranteed nominal returns in Treasuries. The "Real Rate" Clamp: If nominal bond yields rise faster than inflation expectations, real yields rise. High real yields make holding non yielding metals expensive to hold on balance sheets, triggering fund outflows out of Gold and Silver. The Double Whammy: When both TVC:DXY $ and TVC:TNX break out simultaneously (as we mapped out on previous high timeframe charts), precious metals face a double barreled headwind: 1) A stronger dollar makes metals more expensive for foreign buyers. 2) Higher yields raise the opportunity cost of holding metals over cash/bonds. The Takeaway If TVC:DXY pushes cleanly above 101 and $ TVC:TNX breaks out above 4.80% toward 5.20%, precious metals will likely break down through these support zones, regardless of how nice the daily RSI divergence looks. For the momentum divergence to turn into a real price bottom, we need to see either rates or the dollar hit their overhead macro resistance and turn lower. Until then, the trendline and macro headwinds remain in control.by ROW_Partners2
SI UpdateGeez I wish I had shorted this yesterday when it hit oversold. Looks like it was just a gap fill trade and not a rally. RSI headed to oversold then you'll see a bounce. Expecting market to bounce todayby hungry_hippoUpdated 0
Silver UpdateWell, looks like I was right, it did fill the gap. I figured it would go down after it filled, so I did not place a long bet on it. Looks to me like it's gonna go down until MFI hits oversold then bounce again. It's probably gonna trade in this range for a while since gold appears to be stuck around $4k.by hungry_hippo112
Mcx SILVER forecast MCX Silver (1D): Price Action View ### 🔥 Market Structure * **Primary trend:** Bearish. * **Current structure:** Relief rally within a downtrend. * This is **not a confirmed trend reversal yet**. ### 📍 Critical Observation The rally has **just reclaimed the 78.6% Fibonacci level (₹222,730)**. This level is now the **line in the sand**. * Above it = bulls retain short-term control. * Below it = today's breakout becomes a bull trap. ### 📉 Channel Analysis The price is still trading **inside the descending blue channel**. Until a **daily close above the channel** occurs, every rally should be treated as a **counter-trend bounce**, not a new bull market. ### 📊 Candle Psychology Today's candle shows: * Strong buying after multiple indecisive sessions. * Buyers absorbed supply around ₹220k. * No long upper wick → sellers haven't shown aggression yet. What matters now is **follow-through**, not today's candle alone. ### 🎯 Resistance Map 1. **₹224,100** – Immediate hurdle. 2. **₹231,640** – Swing resistance. 3. **₹240,337 (61.8% Fib)** – Decision zone. * Expect heavy profit booking here. * A rejection would keep the larger downtrend intact. 4. **₹252,703** – Trend reversal confirmation only above this level. ### 🛡️ Support Map * ₹222,730 (must hold) * ₹219,500–220,000 (demand) * ₹215,000 * ₹200,300 (major swing low) ### 📈 Bullish Trigger I would turn aggressively bullish only if: * Daily close above **₹231,640**, **and** * Breakout from the descending channel with rising volume. Targets: * ₹240,300 * ₹252,700 * ₹265,000 ### 📉 Bearish Trigger If price fails near ₹224k–232k and closes back below ₹222,730: * It becomes a classic **false breakout**. * Likely targets: * ₹219,000 * ₹215,000 * ₹200,300 ## 📌 Trader's Verdict * **Short-term bias:** Bullish while above **₹222,730**. * **Intermediate trend:** Still bearish. * **Best trade:** Buy dips above ₹222,730; avoid chasing strength into ₹231,640–240,337 unless the channel breaks. * **Trend reversal:** Not confirmed until a decisive daily close above **₹252,703**. ### ⭐ Probability * Bullish continuation to **₹231,640:** **70%** * Break to **₹240,337:** **55–60%** * Full trend reversal above **₹252,703:** **30–35%** **One thing I'd add:** If the next daily candle opens above today's high and closes strong with above-average volume, it would increase confidence that this is the start of a larger recovery rather than just a technical bounce. by ktra_commodities1
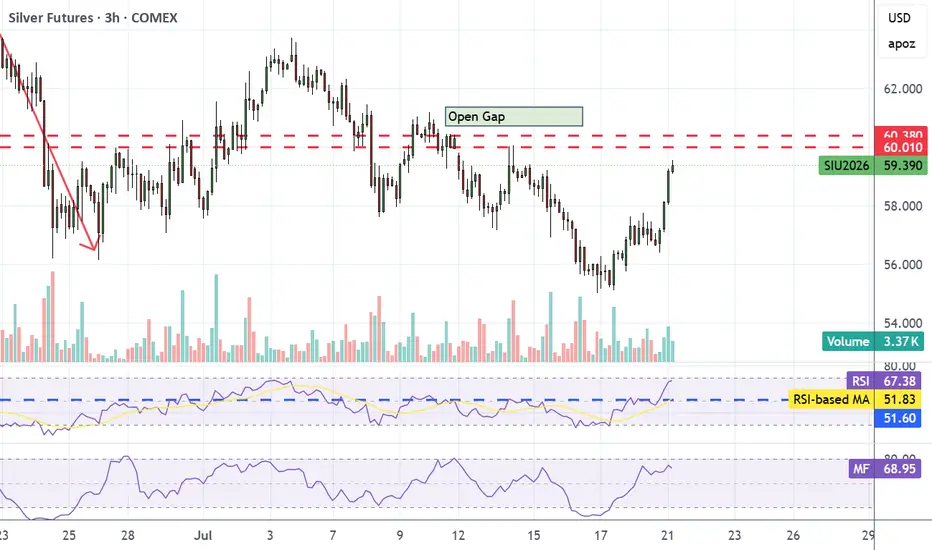
Silver UpdateAlmost overbought on RSI, but there's an open gap that needs to be filled. I was wondering what this pump was bout until I saw the gap. Don't short it until it fills the gap. Quite frankly, I think silver and other metals will just go bounce sideways for a while. The next drop probably doesn't happen until chip stocks drop and this AI bubble bursts.by hungry_hippo1
Silver UpdateMFI almost overbought, and RSI hit the same level as the previous 2 selloffs. If it doesn;t bounce back this afternoon, we'll probably see a gap down tomorrow.by hungry_hippoUpdated 2
SI UpdateI figured SI would bounce up since the whole market went oversold. Dumped my puts while it was in teh red, should've done it on open. Anyways, gonna wait until Monday to short again.by hungry_hippo2
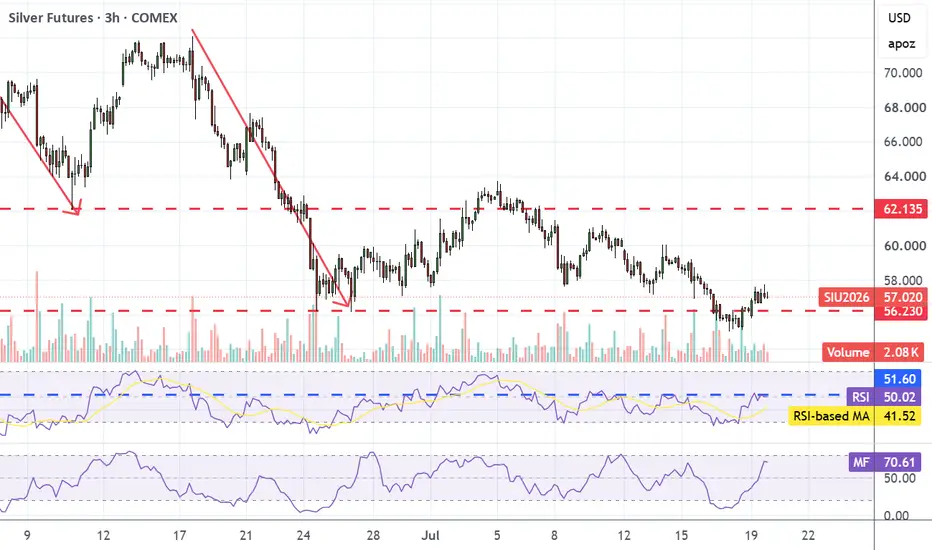
Silver WatchSI is oversold on RSI and MFI, but indicators can go lower just like the last dump. If it breaks support, it definitely will. Got SLV Aug puts I bought last week and next week's puts that I bought Tuesday. Gonna just sit on that and see what happens. Not really sure I'd recommend shorting it with indicators oversold, but I think it's gonna drop.by hungry_hippoUpdated 0
Silver Update 16JUL2026: Final Wave DownThis is the remastered chart as market shows itself clearly over time Corrective structure of wave B transformed into ABCDE triangle It was completed at the end of May Large wave C is about to finish soon as it has 4 out of 5 waves completed Although wave 4 still might build some complex structure RSI confirmed wave 3 with Bullish Divergence Wave 5 of C should at least revisit the bottom of wave 3 of C at $55.8 Next downside target area is in the pink box starting with 61.8% Fibonacci ratio of wave A in wave C at $43.7 The bottom of current cycle at $27.5 is the next hard support Shortby aibek2
Silver Mega MCX Fut Intraday Technical Analysis for 14 July, 26MCX:SILVER1! Silver Futures (MCX) | Intraday Structure | July 14, 2026 Silver is trading around 217,419, sliding underneath the 217,718 Zero Line after an intense distribution phase that rejected higher expansion zones. The contract is currently accelerating into a high-momentum corrective leg as sellers aggressively flush weak hands out of the intermediate support clusters. Price action enters the session locked in a steep liquidation phase below the central pivot line. Institutional participants are pushing to see if demand steps in at the lower target thresholds or if distribution intensifies. Wait for a high-volume 15-minute candle breakout from the immediate cluster to confirm directional stabilization before putting capital to work. Bullish Triggers Long Entry: Above 219,746 (requires sustained acceptance above the 219,275 Add Long Pos. band). Targets: 220,187 - 221,713 Risk Control: Structure weakens below 219,275. Hard exit below 218,414. Bearish Triggers Short Entry: Below 218,803 (strongly validated if the 217,718 Zero Line floor solidifies as a strict supply ceiling). Targets: 215,249 - 213,723 Risk Control: Cover immediately above 220,135. Bias remains structurally protected below 221,272. No-Trade Chop Zone: 218,414 - 219,746 Expect highly rotational, volatile price action inside this wide structure block as industrial participants and commercial desks match order flows. Avoid over-trading early morning whipsaws; let a clean 15-minute structural candle provide execution validation. Execution Rule: Structure first, confirmation next. Zero anticipation. Hit Boost and drop your view in the comments if you're tracking these levels today. #Silverby ChartPathik1
Silver 4H Long: FVG Retest + VWAP Reclaim SetupHello guys, Silver is sitting in an interesting decision zone. After printing a double bottom around 55.65, price started to regain momentum to the upside. That low is important because sellers had multiple chances to continue lower, but price stopped accepting below that zone. Now we are seeing a cleaner structure. Price bounced from the lows, then came back to retest the previous FVG zone formed during the reversal leg. For me, that retest is important. I don’t want to chase the first bounce. I want to see if the market can come back into the imbalance, hold it, and start building continuation from there. There is also extra context from market profile. We have a 1D NPOC nearby and single prints from the TPO chart, which makes this area a real decision zone instead of a random support level. The key confirmation now is the VWAP cluster. Price still needs to break and hold above the WTD VWAP and MTD VWAP, which are sitting close together. When multiple VWAPs cluster in the same area, that zone often becomes a major decision level. A reclaim above that cluster would show buyers gaining control and strengthen the long setup. The trade idea: Entry: 60.32 Stop: 58.43 Target: 68.25 RR: 4.2R Target around 68.25 is the bigger confluence zone, where we have the Daily 50 EMA, Daily 200 EMA, and delta profile imbalances. The setup is simple: Double bottom at 55.65 Momentum shift to the upside Retest of previous FVG 1D NPOC + TPO single prints nearby WTD + MTD VWAP cluster as confirmation Targeting the 68.25 confluence zone Invalidation is below the FVG at 58.43. All the best,Longby Turttle_Trader3
Silver price forecast (mcx)This is a **4-hour MCX Silver Futures** chart with a **falling channel (bearish trend)** and **Fibonacci retracement levels**. Here's what it suggests: ### 1. Overall Trend: Bearish * Price is trading inside a **descending channel**, making lower highs and lower lows. * Until the price breaks above the upper channel line, the primary trend remains **bearish**. ### 2. Current Price * **Current Price:** **223,200** * This is sitting almost exactly at the **78.6% Fibonacci retracement level (222,376)**. * This zone is a **very important support**. ### 3. Important Levels **Support** * **222,376** (78.6% Fib) – Immediate support. * **219,500–220,000** – Minor support. * **199,806** (100% Fib) – Strong long-term support if selling intensifies. **Resistance** * **229,700–230,000** – First resistance. * **234,901** (61.8% Fib) – Strong resistance. * **252,540** (50% Fib) – Major breakout level. ### 4. What the Chart Indicates There are **two possible scenarios**: #### Bullish Scenario (Higher Probability if Support Holds) * If **222,376** holds and buyers step in, * Silver could rebound toward: * **230,000** * **235,000** * **240,000** * Later **252,500** This matches the upward dashed arrow shown on the chart. #### Bearish Scenario * If **222,376** breaks decisively, * Price may quickly fall toward: * **215,000** * **210,000** * **200,000** That would keep the downtrend intact. ### 5. Trading Strategy **For Bulls** * Watch for bullish candles or higher lows near **222,300–223,000**. * A close above **230,000** would strengthen the recovery. * A break above the channel and **235,000** would be a strong bullish confirmation. **For Bears** * If 222,376 is broken with strong volume, selling pressure may increase. * The next downside target becomes **210,000–200,000**. ### My Technical View At the moment, **223,200 is sitting at a make-or-break support**. Since this level coincides with the **78.6% Fibonacci retracement**, it has a good chance of producing a short-term bounce. However, **the trend remains bearish until the price breaks out of the descending channel and closes above 235,000**. For **KTRA Commodities**, I would summarize it as: > **MCX Silver is testing a crucial support at ₹2,22,376 (78.6% Fibonacci). Holding above this level could trigger a recovery toward ₹2.30–2.35 lakh. A breakdown below ₹2.22 lakh may accelerate selling toward ₹2.10–2.00 lakh. Traders should closely watch price action around this support before taking fresh positions.** by ktra_commodities2