Silver Hourly Chart: 1st Impulse Breakdown it might be the first impulse up (yellow large)
it has 3 waves done
wave 4 could be over as well as the price is testing the peak of wave b
and might trigger the 5th wave bullish trigger
target for wave 5 is $54.2
after that, the corrective wave 2 should unfold down to 38.2-61.8% Fibonacci retracement
area of the current first impulse, we will measure it once impulse is over
the peak of wave i of 1 at $50.6 should stay intact, else the impulse will be invalidated
Silver Micro Futures
In-depth trading ideas
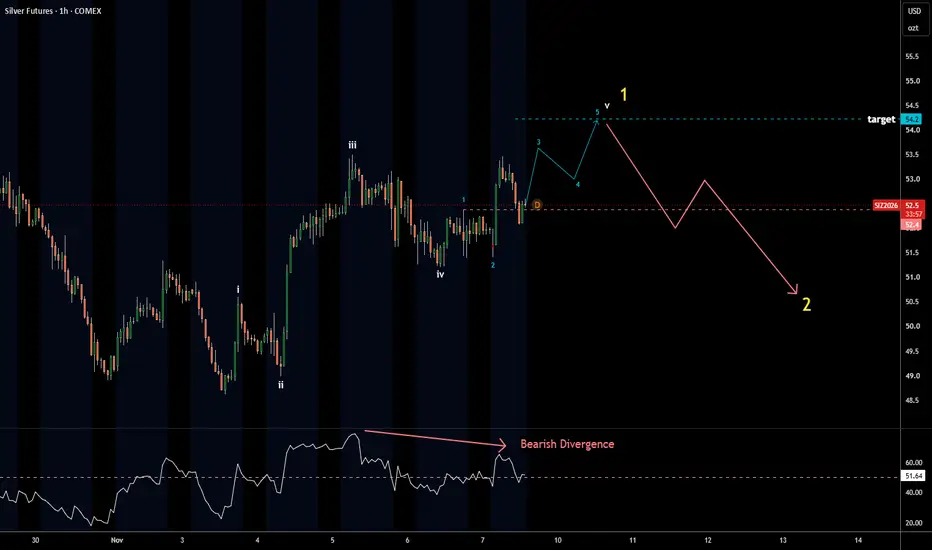
Silver Hourly Chart: 1st Impulse Almost Doneit an update of earlier chart
price follows that path
final 5th wave is in progress
we have waves 1-2 of
and waves 1-2-3-4 of 3 of
wave 5 of 3 of just kicked off
wave 4 of should keep above the top of wave 1 of at $52.4
RSI shows Bearish Divergence and its healthy as it confirms positions of waves 3 and 5
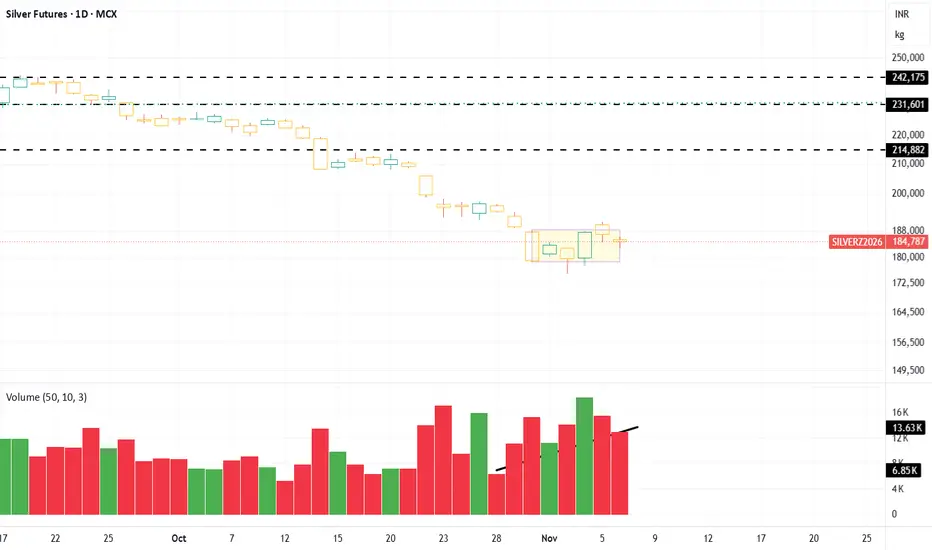
Chart Study | SILVER FUTURES | Daily Chart | MCX | 2 November 26The chart shows a SELL signal followed by a sustained downward price move. Silver has moved below both T1 and T2 reference levels and is now trading near 181,711, with T3 at 173,707 remaining as the next reference level.
Chart reference levels:
Entry reference: As indicated by the SELL label
Stop-loss level: 254,819
Target 1: 214,263
Target 2: 193,985
Target 3: 173,707
These are indicator-generated reference levels for technical analysis, not predictions or guaranteed outcomes. Price may
SILVER IS READY FOR ITS NEXT BIG MOVE!📊 SILVER – TECHNICAL VIEW | INTRADAY & SWING
Silver is currently showing signs of short-term recovery after taking support near the lower boundary of its descending channel. The recent bounce indicates improving buying momentum; however, the broader trend still requires breakout confirmation.
🔹 Key Support Zone: 171,500 – 172,500
🔹 Supertrend Support:Around 179,000 (as per current chart)
🔹 Breakout Level:182,000
🔹 Upside Potential: 187,000
📈 Bullish Scenario:
As long as Silver sustains above
Episode 14 — The Leading Diagonal# 🎬 The Chronicles of Mr. Nobody
## Season I — The History of the Elliott Wave Principle
### Episode 14 — The Leading Diagonal
*The First Sign of a New Move?*
⏱️ Reading Time: Approximately 3 minutes
---
# When a New Trend Doesn't Begin Like a Typical Impulse
Imagine a market that has been declining for an extended period. Then, for the first time, it begins showing signs of a possible change in direction.
Price starts moving higher, but the advance doesn't have the clean, powerful struc
Silver broke its July low. The idea: the break becomes the lowSilver closed Friday at 53.949, under its July low of 55.00. On my rules that ends the cycle that began in July. My base case is a lower low inside the window for silver's next intermediate low, Oct 30 to Feb 19 (typical: around New Year).
The other case is this week's idea, and I carry it on paper. Since 1988 silver has closed a week below a confirmed weekly low and closed back above it within two weeks 50 times, half of all such breaks. One reclaim in five (10 of 50) ran more than 20 pct ove
Silver: Reaction Possible, Trend Remains Bearish**Silver: Reaction Possible, Trend Remains Bearish**
Silver is testing a technically important support area on the daily chart. Following the peak near **$121.73**, price entered a well-defined descending channel and has continued to form lower highs and lower lows. The breakdown of the previous long-term rising trend line further confirms the deterioration in the broader technical structure.
The current price near **$49.32** is approaching the **0.786 Fibonacci retracement at $47.70**. The co
Silver short term longSilver short term is poised for a bounce.
After being depressed and reaching oversold levels, its approhing its cycle timing for a bounce.
A good setup is presented with a stop bellow the double bottom. RSI is diverging and with most people short, can creat a quick and sharp short squeeze.
Bellow the support, would be the death of the bullish thesis for a while.
If you like my ideas, subscribe. To learn more contat me in chat.
SILVER : Bearish BTF Blocks Are Compressing — Is Trend turning?Silver has undergone a substantial correction from above $61, reaching a recent low near $55.56.
Throughout that decline, BTF Daily Trend displayed a succession of bearish daily blocks, clearly illustrating the prevailing downside structure.
But look at what has happened since the initial selloff.
The large bearish blocks have given way to a series of much smaller, compressed bearish blocks.
Price is now consolidating around $57–58 rather than extending aggressively lower.
This is an intere
Silver Mini Futures (MCX) | Technical Structure | 26 October, 26Silver Mini Futures (MCX) | Technical Structure | October 26, 2026
MCX:SILVERM1!
Silver Mini is trading around 197,994, holding directly above the 197,781 Zero Line. The contract has absorbed heavy downward distribution following an extended slide from upper levels near 205,000, establishing a broad horizontal base around its central inflection pivot after absorbing sharp liquidity sweeps down to 194,800.
Price enters the session compressed right near the central benchmark. Institutional
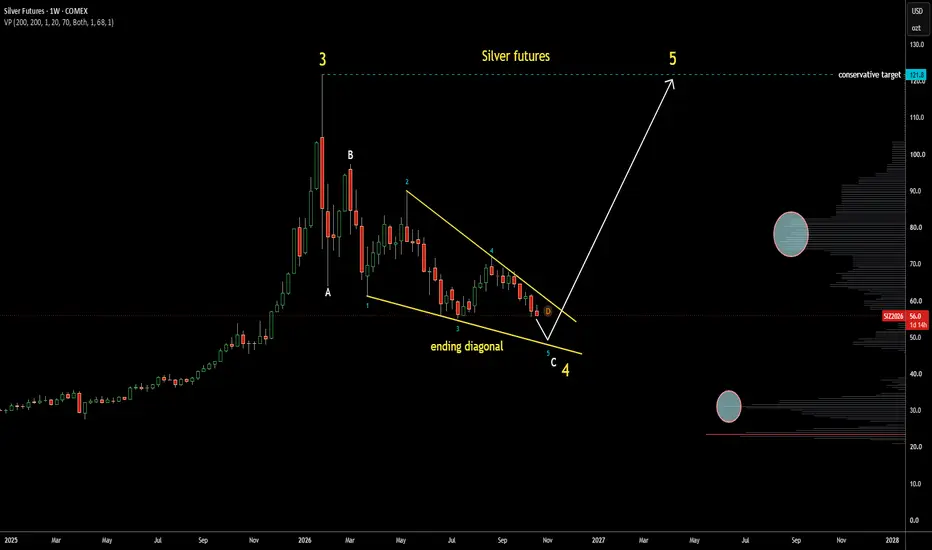
Silver Update 22OCT2026 the map has changed since summer update
as the price couldn't breakout further up
it is still ABC (white) correction in wave 4 (yellow)
however, the wave C is unfolding within the ending diagonal
we can see 4 waves within it are over
last wave is in progress to the downside
it can hit $48 level on the downside of diagonal
after that, the reversal to the upside in large wave 5 is expected
the conservative target could hit the all-time high around $121
there is a volume profile barrier det
Silver longterm plan bearishSilver longterm bearish.
Silver is due for a bounce, but by past cycle behaviour, like to trick traders into beliving the bull is alive and then goes lower for a final flush.
If you want to go long a short term bounce is due.
If you want to go short wait for the rally to the right level.
If you are long term, dont do anything, wait for lower price and stack physical-
The supply demand and monetary situation is bullish longterm.
To learn more contact me chat. Fallow me here to support my wo
Silver Mini Futures (MCX) | Technical Structure | October 21, 26Silver Mini Futures (MCX) | Technical Structure | October 21, 2026
MCX:SILVERM1!
Silver Mini is trading around 213,960, holding directly above the 213,847 Zero Line. The contract has experienced an aggressive recovery spike off its lower demand shelf near 210,550, pushing directly back into its central inflection pivot and attempting to establish structural stability above the central threshold.
Price enters the session heavily compressed near the central benchmark. Institutional desks ar
Silver Daily — Two Clues Within the Corrective StructureAlternation and Extension
Reading time: ~3 minutes
In our recent analysis of Gold, we discussed the guideline of alternation between Waves II and IV. The same concept may help us evaluate Silver’s current corrective structure on the daily chart. However, this is not the only Elliott Wave guideline worth examining.
1. Alternation — A Guideline for Evaluating Wave IV
In the current count, Wave II is interpreted as an Expanded Flat. One possibility, therefore, is that Wave IV may develop as a
Silver Mini Futures (MCX) | Technical Structure | October 20, 20Silver Mini Futures (MCX) | Technical Structure | October 20, 2026
MCX:SILVERM1!
Silver Mini is trading around 212,292, hovering directly underneath the 212,402 Zero Line. The contract has experienced steady distribution after failing to hold higher consolidation clusters near 215,255, pulling back straight into its primary central inflection pivot and stabilizing right above its baseline demand shelf.
Price enters the session heavily compressed near the central benchmark. Institutional d
Silver outran inflation. Then industry showed up.The grocery cart got 3.8× more expensive since 2002. Silver did ~12×.
Same quarter century. The metal outran the food.
Silver used to be held as money. Now solar panels, electronics and data centers consume it. A monetary metal turned into an industrial deficit.
The chart is logarithmic from 1976. The breakout is the fact. Everything above the current price is a scenario, not a forecast.
Silver : October 19–23, 2026 — Weekly AI Forecast OutlookSilver enters the new week with the model equilibrium centered around 58.0–58.4. The first major forecast boundaries are positioned at 60.8–61.5 on the upside and 54.6–55.3 on the downside, establishing the central decision structure for the week.
The closely positioned equilibrium anchors provide a central reference, while the predictive rails near 61.5 and 55.3 define the next important boundaries. Price behavior around these areas will help determine whether Silver remains within its central
Silver: hedge funds halve their long as new shorts move inSilver has gone quiet on the chart since the late September drop. Under the surface, hedge funds have cut their bet on it nearly in half.
The cut. In the CFTC report dated September 8, Managed Money (hedge funds and CTAs) was net long 14,176 COMEX silver contracts. By October 6 it was 7,608, down 46 percent in four weeks and the smallest net long since early March.
Not only exits. Over those four weeks long contracts fell by 4,669 while shorts rose by 1,899, so close to a third of the drop cam