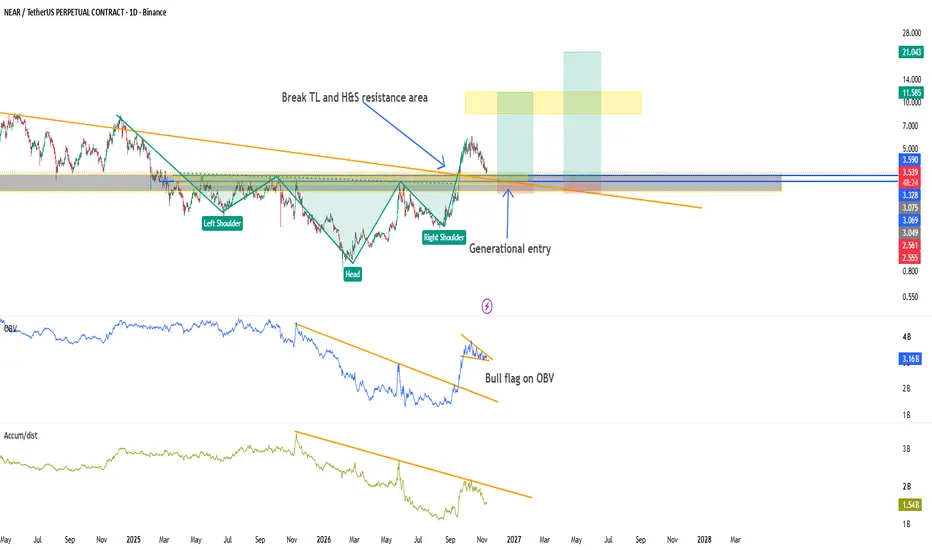
Near Generational Entry Price has broken above both the inverse Head & Shoulders neckline and the descending resistance trendline, signaling a potential shift from bearish to bullish market structure.
We are now witnessing a retest of the former resistance zone, which could act as support and provide an attractive accumulation opportunity.
OBV Confirmation: OBV has broken its major descending trendline and is currently forming a bullish flag. A breakout from this consolidation would strengthen the bullish continuatio
NEAR Protocol / Tether
No trades
No trades
In-depth trading ideas
NEARUSDT.P — bounce from 3.446; still below the 20-day MABINANCE:NEARUSDT.P · 4H. Education only — not a ticket.
NEAR bounced from the 3.446 monthly low and now trades near 3.57, back around the 3.563 support after tagging the 3.809 area earlier (session high 3.816). Above, the 20-day MA at 4.165 and the 4.27 weekly high are the next resistance. Still a counter-trend bounce until 4.165 is reclaimed.
Risk: Slipping back below 3.563 would fade the bounce toward 3.446. Not financial advice.
— ACX
NEAR/USDT – Channel Support Reopen 4.87🟢 BINANCE:NEARUSDT is approaching a potential recovery point on the H3 chart after an extended decline inside a descending channel. Price is reacting near the lower boundary, but the Ichimoku cloud and sequence of lower highs still favor sellers.
The recent rebound around $3.70–$4.03 is worth watching. If buyers can defend the channel floor and reclaim the $4.20 area, a stronger recovery toward the upper resistance zone could develop.
🎯 Target: 4.872
A sustained H3 break below the recent
NEAR voted to cut issuance and still lost 3.90. I sell a bounceNEAR's House of Stake approved a cut of the issuance ceiling from 2.5% to 1.6% today. NEAR was down 0.4% on the news and is down 6.5% in 24 hours at 3.84, off a low of 3.742. The cut still needs a Security Council review and a 90-day grace period before it is binding, so nobody is paying for it yet. X is split: some call this a Wyckoff distribution, others said it was never going under 4.
The chart: NEAR is under its 4H 200 average (4.51) and the daily 50 (4.30), and BTC is under both of its ow
NEAR/USDT: Macro Descending Trend Breakout & Retest WatchBINANCE:NEARUSDT is currently testing a pivotal technical juncture on the 1D timeframe, following a massive structural shift.
Key Technical Highlights:
Macro Trend Breakout: The multi-year descending ATH trendline originating from 2022 has officially been breached to the upside, signaling a potential shift in market structure.
The Retest Phase: Price is currently pulling back to retest the broken trendline and horizontal support alignment between the $2.80 - $3.30 zone. Holding this lev
NEAR: pullback to $3.27–$3.78 before next legNEAR Protocol is a layer 1 blockchain whose Intents product lets users swap across more than 25 chains. Intents earned about $8.5M in revenue over the last 12 months and $2.3M in the last 30 days alone, on about $4.5B of monthly volume. Since 23 February 2026 this revenue buys back NEAR on the open market, about $6.7M so far, and Q3 buybacks ($3.07M) were double Q2.
Technical view: bullish long term, but stretched. Price broke a three-month downtrend in late August, ran from about $2.30 to $6.0
Near Protocol super moon incoming.I see a full-blown recovery and super moon coming for NEAR Protocol. BINANCE:NEARUSDT
This is a perfect market cycle , very similar to the internet bubble example on the right, with the subsequent recovery that comes afterward.
This project has strong fundamentals, and the chart is impeccable.
Big things should be coming soon.
As always, Stay Profitable.
- Dalin Anderson
NEAR's Distribution Phase Is About to End (8H)NEAR: A Potential Bullish Reversal Setup
After forming a Swing High (SWH), NEAR created a bearish Change of Character (CHoCH) and subsequently swept the upper liquidity pool. However, the distribution phase does not appear to be complete yet.
The next potential move could involve sweeping the lower liquidity pool and reaching the fresh Order Block zone. If the price reacts positively to this area, NEAR could regain bullish momentum and begin moving toward the target levels marked on the chart.
NEARUSDT.P – Diamond Top (12H)Clear Diamond Top formation after the strong rally from the August–September base.
Price formed the classic expanding then contracting structure into the top, with the upper boundary near ~6.00 and the lower boundary of the diamond around the 4.60–4.70 zone.
Breakdown already occurred. The measured move from the height of the diamond projects toward the 3.20–3.40 area (red path shown).
Key levels:
• Invalidation / reclaim: sustained close back above 4.80–5.00 (blue box)
• Next support zone: 3
NEARUSDT: $3.916 Support Sweep Could Trigger a Bullish ReversalNEAR Protocol (NEAR/USDT) is trading around $4.04, down approximately 2%, following a pullback from its recent $6.00 high. Price is approaching the critical $3.916 support zone, which previously attracted buyers. With the RSI near 33 and MACD showing bearish momentum on the 4H chart, patience is essential before considering a potential reversal.
From a fundamental perspective, NEAR continues strengthening its AI and cross-chain ecosystem through NEAR Intents, chain abstraction, and growing bloc
NEARUSDT Forming A dropNEARUSDT looks like it is gearing up for another drop after slipping straight through a floor that had been keeping the whole rally alive since late summer. Instead of catching a quick bounce like it used to, price broke right beneath that band, which usually tells us buyers are exhausted and sellers are fully steering the ship.
Looking at the daily chart, all that choppy trading back in September and October really looks like distribution now. Every push to make fresh highs got smacked down, a
NEAR — Is This the Perfect Opportunity Before the Next Leg Up?💎 Coin: CRYPTOCAP:NEAR #NEAR
⌛ Time Frame: 3D (3 Days)
📈 Market Structure: Bullish Recovery
📉 Pattern: Breakout & Potential Support Retest
🎯 Key Support Zone: $3.20 – $3.55
🎯 Major Upside Target: $8.24
### 🔎 Market Overview
NEAR has demonstrated a strong recovery following an extended downtrend, successfully breaking above a major historical resistance zone around $3.20–$3.55.
After this breakout, price rallied significantly, reaching the $5.00–$5.50 region before experiencing a corrective
Wave Analysis - Near (2H)Price seems to be collecting liquidity around this consolidation zone, and based on the wave count, a downward movement seems more likely.
The last high of the price (shown as B) is a liquidity grab / bull trap for FOMO buyers. This wave also belongs to a flat family, which is tricky and dangerous to trade.
Considering the strong 0.87 correlation (4H) NEAR currently has with Bitcoin, the downside scenario has even more confluence.
The demand zone on the chart is where the price is expected to
#NEARUSDT #12h (Binance) Rising wedge breakdown [SHORT]NEAR Protocol printed an evening star and a bearish divergence on the RSI.
Seems likely to retrace down to 200MA support if gets rejected here again.
⚡️⚡️ #NEAR/USDT ⚡️⚡️
Exchanges: Binance Futures, Bitget Futures
Signal Type: Regular (SHORT)
Leverage: Isolated (4.0X)
Amount: 5.5%
Entry Targets:
1) 5.525 - 100.0%
Take-Profit Targets:
1) 4.018 - 50.0%
2) 2.509 - 50.0%
Stop Targets:
1) 6.028 - 100.0%
Trailing Configuration:
Stop: Breakeven -
Trigger: Target (1)
Published By: @Zblaba
CRYPTO
NEARUSDT Perpetual | Bearish Trend | 4H Analysis & 5M ExecutionTechnical Analysis (4H)
On the 4 hour timeframe, NEARUSDT exhibited a strong bearish trend, characterized by sustained selling pressure and a consistent formation of lower highs and lower lows in accordance with Dow Theory.
The recent significant selloff further reinforced the prevailing bearish market structure, suggesting continued downside momentum.
With no confirmed bullish reversal in the higher timeframe structure, my directional bias remained bearish.
Entry Confirmation (5M)
After es
HOW-TO: Read states before scores in Crypto Setup PlannerCan two rows with the same score require different interpretation?
This chart illustrates a practical reading sequence for Crypto Setup Planner . The example is Binance NEARUSDT spot on one hour, with Binance Spot Leaders Group 1 selected. The observations below describe the 2 November 2026 publication snapshot, not a forecast or a recommendation to trade these symbols.
1. Confirm the group before interpreting the shortlist
The panel shows 39 valid markets, six displayed rows and zero qualif
NEARUSDT Showing Bearish ReversalNEARUSDT is showing signs of a bearish reversal setup, with the recent price action developing into a descending triangle structure. After a strong upward move, the price started struggling to maintain higher levels and gradually formed lower highs, showing that buying strength was fading.
The key support area had been holding the price for some time, but the latest move below this zone suggests that sellers are finally gaining the upper hand. This breakdown is important because it can open the
Update on fundamental analysis
**What happened**
- Price flushed to about 4.40 on the 29th with the heaviest red delta in days. 15m CVD swung from +5.5M to -10.5M.
- Buyers then absorbed it. Price recovered about 0.23 off the low, back above the 15m MAs (4.51-4.54), and is now at 4.63.
- **1D:** The candle has a long lower wick, and the pullback again held above the 50 MA (4.34), which is the same spot as last time.
**Order flow**
- **Absorption at the low (4.40-4.48):** This is real buy-side absorption. The selling delta s
$NEAR Sitting On Make-Or-Break SupportContext: 4H chart. Price is back on the rising trendline and the 4.285 floor at the same time, while the falling trendline keeps pressing down from above. Something has to give.
🔴 5.952 (October high)
🔴 4.878 (falling trendline)
🟢 4.285 (horizontal and trendline support)
🟢 3.057 (next real floor)
My read: Bulls have defended 4.285 on every touch. Hold it and a push to 4.878 is on. A clean break above the trendline opens 5.952, with 6.494 as the bigger target.
The risk: A 4H close below 4.285
NEAR/USDT – Breakdown Wave, Buyers Strong Firm🟢 BINANCE:NEARUSDT has broken below the rising H2 trendline that supported several previous lows. Price is also trading beneath the Ichimoku cloud, keeping the short-term structure tilted toward sellers.
I’m watching the 4.773–5.092 sell zone for a rebound. A rejection from this area would confirm the former support is turning into resistance.
🎯 Target: 3.872
A sustained H2 recovery above 5.092 would weaken the bearish setup.
AURICVERSE View: the trendline break has shifted control to
NEAR SHORT SIGNAL: BREAKDOWN AND RETEST SETUP
NEAR is showing a bearish structure after breaking below the key support zone around $4.60.
Previously, NEAR traded within a consolidation zone between approximately $4.60 and $5.40 before breaking down. Price then dropped toward 4. 10 and is now presenting a potential retest opportunity around the broken support level.
Trade Setup: SHORT CRYPTOCAP:NEAR
🔴 Entry: $4.663 or enter at the market price
SL $4.778
🎯 TP1: $4.396
🎯 Final TP: $3.831
Technical Outlook: The strategy is based on the
NEARUSDT: Breakdown Keeps Sellers in ControlNEAR has broken below the rising trendline on the 2H chart, confirming a weaker short-term structure.
Price is also trading below both moving averages around 4.59 and 4.76. As long as NEAR stays under this area, rebounds are likely to remain corrective.
The next downside zone sits around 4.25–4.30. A clean break below that area could expose the psychological 4.00 level.
Macro remains cautious ahead of a heavy central-bank week. Bitcoin has slipped toward 79K, while investors remain defensive
Fundamental Analysis Nearusdt.pBias: neutral to slightly bullish short term, but still in chop. There's no confirmed breakout yet.
Higher timeframes
1D: NEAR ran from about 1.9 to a 6.0 peak and is now pulling back to 4.56. It's below the 20 MA (4.81) and held just above the 50 MA (4.30). Daily CVD is negative (-6.75M) and volume is fading. This looks like a healthy pullback, but with some distribution near the top.
4H: The MAs are bearishly stacked (4.84 / 4.76 / 4.62 / 4.60), and price is stuck under the 4.60–4.62 cluster.