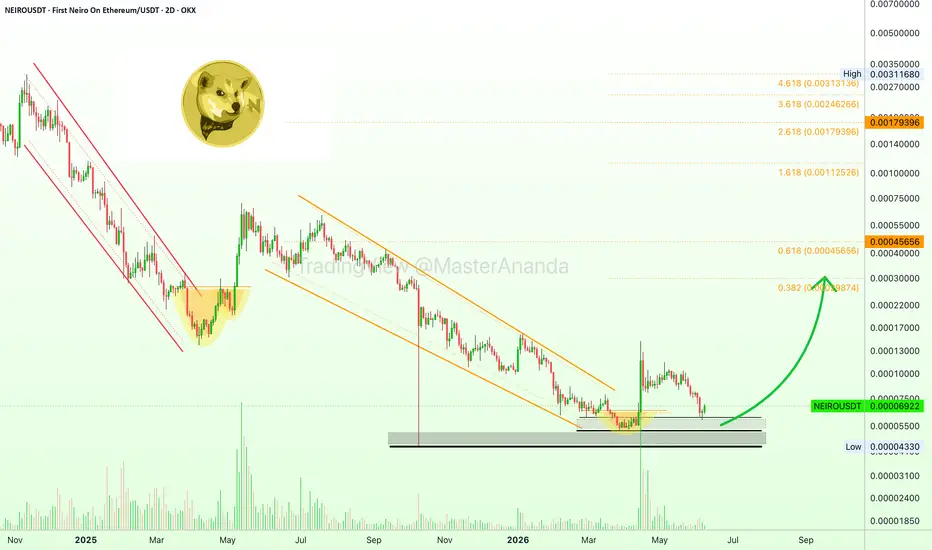
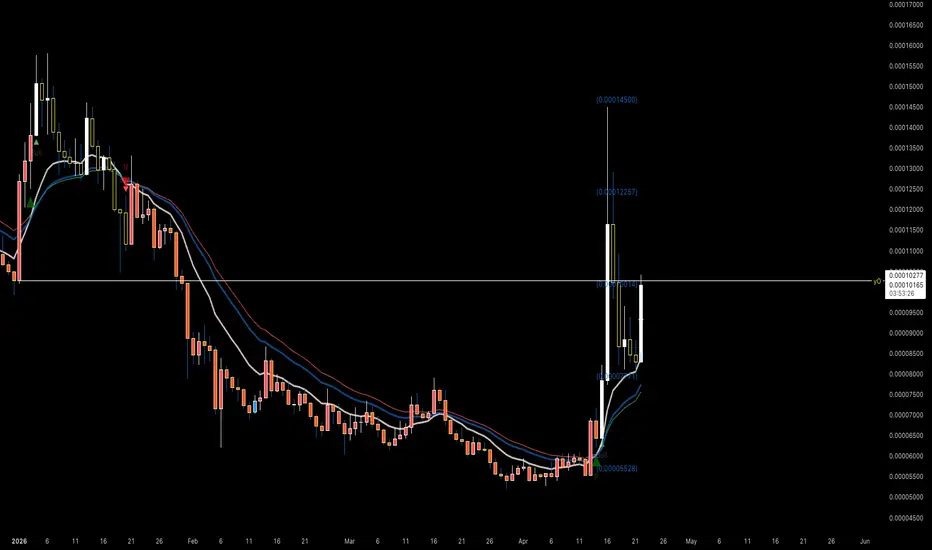
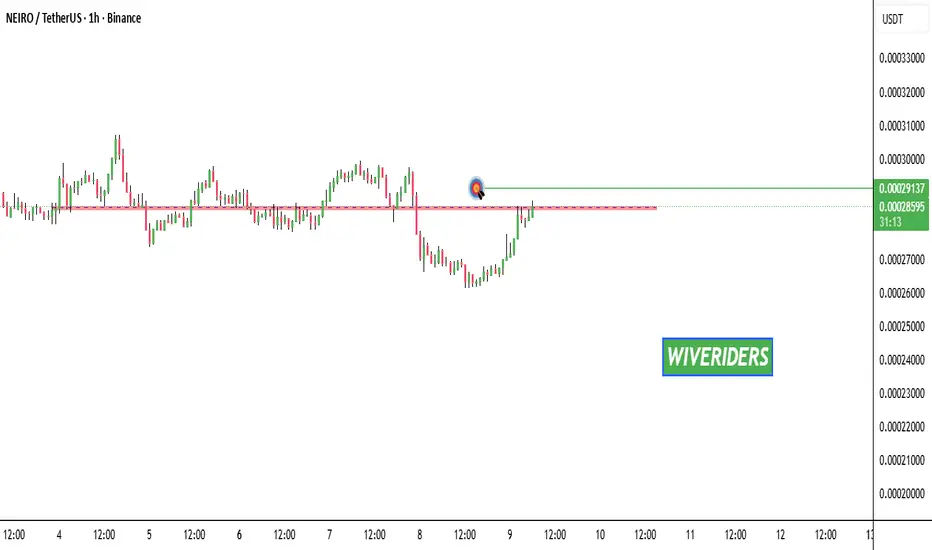
First Neiro on Ethereum: Easy 335% & 1,530% Long-TermHigher lows tend to lead to higher highs, and this simple fact alone, shown here through a sequence of candle patterns on a chart, opens for us the opportunity to secure a nice and easy 335% profits-trade. That is, the main resistance level that NEIROUSDT will hit as the continuation of the bullish move that started with the 29-March low, sits at $0.00029 and this gives us total profits potential of 335%.
The first move already produced +180% in a matter of days. The initial bullish breakout, the first jump, is never the biggest. It can be big but that is almost never the case. The second advance, which can be called the third-wave, tends to be really strong. We already have a bullish bias confirmed through the first move coupled with high volume, through market wide action and now a higher low. This is a very strong-high probability chart setup. The targets can be hit within 1-3 months, the first two.
335% is the easy target but we also have 552% as a high probability target for the bullish move that is developing today. Technically, the move starts with the 6-June low but today we are seeing a true bullish continuation; there will always be price fluctuations though on the way up.
The bullish market bias is also confirmed through zero trading volume on the retrace. There was no sellers pressure on the last drop and this is expected. From now on, we get only growth. The 1,500% target can be hit sooner than expected, it can happen within a 6 months time window, we are ready to wait though. Hope for the best, prepare for the best.
We are ready to wait long-term but we know the market is going up. The bearish trend already ended 5 months ago. The bear market bottom and all-time low happened 8 months ago. The market never stays the same.
A lack of new lows in more than eight months and the presence of bullish action supported by really high volume confirms the start of a new market phase. This is our chance. Hit it hard. Plan and focus. The best is right around the corner. The only constant in this life is change.
Thank you for reading, keep coming back.
Namaste.
In-depth trading ideas
๏ปฟFirst Neiro on Ethereum prepares for a new bullish waveNEIROUSDT looks right and ready for a new bullish wave. I shall described the classic price behavior and candles pattern that is present on this chart.
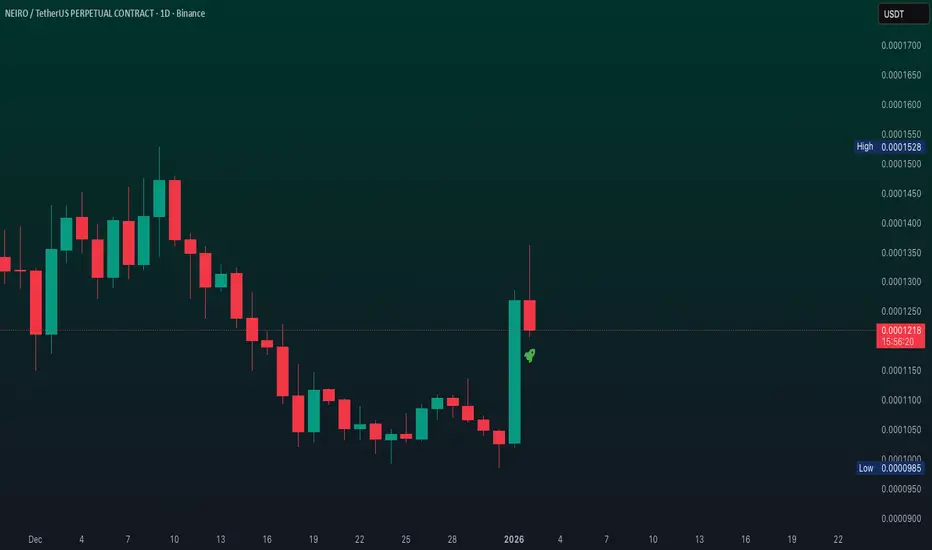
After a major low and also higher low vs the October 2025 flush, NEIROUSDT produces its first bullish jump as the initial bullish breakout. This move can be verified as the real deal due to really high volume. Real deal in the sense that it signifies the start of a new trend, an uptrend, a bull market.
Bullish conditions are confirmed because the recent retrace is ending as a higher low. This is the setup that will result in a new advance and this advance can be only days away. The retrace/correction lasted more than a month, so it was a long process. The next move can also last several months and that's the beautiful part.
While the initial bullish jump tends to happen fast, in a flash, lasting only a few days or weeks; the bullish continuation can last several months, it is a new uptrendโhigher highs and higher lows.
This is a strong bullish setup with all signals fully confirmed. Higher prices are coming next. Growth & green.
Thank you for reading.
Namaste.
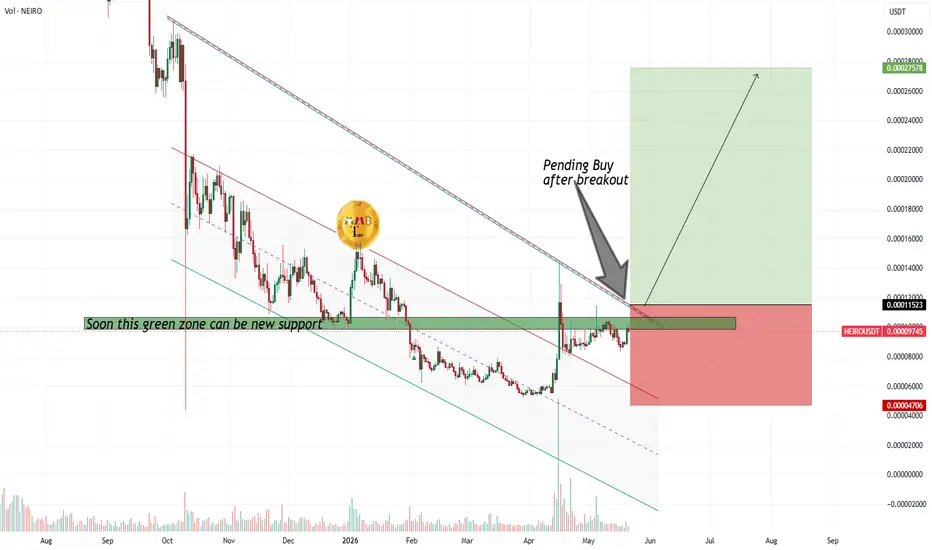
Neiro upcoming pump will cook only after a breakoutNEIRO has moved down from the falling trendline and may enter a short-term bearish or ranging phase. However, the anticipated direction remains bullish, with an expected breakout above the trendline. A pending buy order has been placed above the trendline, as shown on the chart, to capture the subsequent upward move.
Current Market Structure
NEIRO is currently trading below a key falling trendline. The price has pulled back from this resistance, suggesting a period of consolidation or minor bearish pressure. Despite this near-term weakness, the broader structure is not considered aggressively bearish; rather, it appears to be coiling for the next directional move.
Expected Path
Short-Term: Range-bound or slightly bearish price action as the market respects the falling trendline from below.
Catalyst: A confirmed breakout above the trendline, ideally supported by increasing volume.
Outcome: Once the breakout occurs, a strong bullish impulse (massive pump) is expected.
Trade Setup
Pending Buy Order: Placed above the falling trendline (exact level as marked on your chart).
Trigger: Price breaks and closes above the trendline, activating the long entry.
Stop-Loss: Below the recent swing low or the breakout level, depending on volatility.
Take-Profit: Measured move targets based on the height of the consolidation pattern or previous resistance levels.
Neiro Big chance ahead (++MASSIVE PUMP++)NEIRO has broken above its previous descending channel, establishing a slightly bullish market structure. Rather than rushing to enter, a pending buy order is set above the next trendline resistance. A confirmed second breakout above that level would trigger a long entry, targeting a high-volume, substantial upward move.
Current Market Structure:
NEIRO has successfully broken out of its prior descending channel, signaling a potential shift from bearish to early bullish momentum. The price is now consolidating or slowly drifting higher, but a decisive second breakout is still needed to confirm the reversal.
Key Levels & Expected Path:
First Breakout: Previous descending channel now acting as potential support
Pending Entry Level: Above the next trendline resistance (second breakout trigger)
Confirmation Needed: A decisive close above the second trendline resistance with increasing volume
Expected Outcome: Upon confirmation, a high-volume, massive upward move is anticipated
Technical Rationale:
Breaking one descending channel reduces selling pressure, but a second breakout above a higher trendline resistance provides stronger confirmation of trend reversal. By setting a pending buy above the second resistance, the strategy avoids false breakouts and ensures entry only when bullish momentum is confirmed. High volume accompanying the second breakout would validate genuine buyer interest.
Trade Consideration & Risk Management:
Entry Trigger: Pending buy order placed above the next trendline resistance
Confirmation: Second breakout must occur with clearly higher trading volume
Stop-Loss: Below the second breakout level or recent swing low
Take-Profit: Multiple targets based on measured moves and historical resistance levels
Patience Emphasis : No rush to enter; waiting for the second breakout reduces risk and improves probability
MMBT โ your eyes on the markets. If this helped, hit like and follow. ๐ฌโ
NEIRO still maintains a bullish structure !First of all you should know that this is a volatile meme coin so do not forget risk management when taking a position
After a bullish change of character NEIRO has made a strong move upward and still maintains a bullish swing structure so we are looking for buy long positions at support zones
We are watching the swap zone as a key support area to enter buy long positions with controlled risk and it is better to scale in using DCA in this zone
Targets are marked on the chart take partial profit at the first target and move your stop to breakeven
A daily candle close below the invalidation level will invalidate this setup
If you would like us to analyze a coin or altcoin for you, first like this post, then comment the name of your altcoin below.
What is your opinion about NEIRO?
23-04-26 Neiro, Stop guessing where the market is going"Stop trading like a gambler. Stop guessing where the market is going. Here is how you can actually start reading the charts like the institutions do."
"Most retail traders get trapped by looking at the same old support and resistance lines. But have you ever wondered why your stop loss gets hit just before the price goes in your direction? Itโs not bad luckโitโs liquidity. The market is designed to hunt your stop losses before making its real move."
"Iโve been analyzing the NEIRO/USDT pair using Smart Money Concepts (SMC). We saw a classic Liquidity Sweep above the 4H high, followed by a clear Market Structure Shift (MSS). Now, Iโm not chasing the move. Iโm waiting for the price to retrace back into the Premium Zone, specifically targeting that fresh Fair Value Gap (FVG) left behind during the shift. This isn't just a hunch; it's about identifying where the big players are loading their orders."
"Iโm setting my eyes on a short position once the price retests that supply zone. Check out my full breakdown on my TradingView and letโs discuss: do you see this dropping further or are we just preparing for another leg up? Drop a comment below!"
NEIROUSDT.P: short setup from daily support at 0.00008208The setup on this chart looks highly promising. The breakdown could have happened yesterday, but buyers managed to hold the price above the support. However, instead of a bounce, we got consolidation: thanks to this delay, the BINANCE:NEIROUSDT.P has built up even more energy for a strong downward move.
The level has been tested and confirmed multiple times. This makes the setup completely transparent from a risk management perspective โ the placement for the stop-loss is absolutely obvious and logical. Expecting a breakdown.
PRO-THESIS FACTORS:
trend alignment
liquidity vacuum beyond level
volatility contraction on approach
close retestโ ะะปะธะถะฝัะน ัะตัะตัั
precise level testing
price compression (Squeeze)
Leave your thoughts on the setup in the comments. Follow this profile to monitor all upcoming ideas.
First Neiro On Ethereum breaks out of bear market (PP: 1,600%)The first target on NEIROUSDT is $0.000459 with a total of 596% profits potential. This is the easy target and the one we are aiming for on the initial part of this bullish move.
Some projects are growing 8,000% in a matter of weeks. Others 4,000% and so on.
When we consider 400-600% as the target for the first move of this bullish wave we are being truly conservative, and I believe you already know how this works. When the action starts in full force, what tends to happen is the market moving beyond all targets.
Rather than us being too optimistic, it turns out we underestimated the market. For this reason, aim high and focus on the long-term. Develop a plan before buying; a well thought out exit strategy, profit taking; how much to sell and when should be the main question to answer to increase potential profits.
Once the energy starts to rise, it is hard to stay focused and concentrated. The time to prepare is now, the time to plan is now, the time to buy is now. Do everything now and make your life easier when prices start to grow too fast to keep up.
NEIROUSDT broke out of a major, long-term falling wedge pattern. This breakout confirms the start of the next market phase, always coupled with what is happening with the rest of the altcoins market, this is what gives this signal further strength.
There is also a higher low... It is still early. Everything changes in a flash, the build up process has been going for months.
Bitcoin just hit the highest price since 5-Feb, the entire last portion of the down move now being fully recovered. The ground gained is being maintained. There will be more.
Thank you for reading.
Namaste.
NEIRO โ Broadening Wedge Inside Macro Descending ChannelNEIRO is trading inside a large descending channel on the higher timeframe, clearly respecting lower highs and lower lows within a structured bearish trend.
Inside that macro channel, price has formed a Descending Broadening Wedge. Unlike a falling wedge that compresses, this one is expanding, meaning volatility is increasing while still trending downward. That usually signals unstable structure and repeated liquidity grabs on both sides.
Current Position
Price is sitting near the lower half of the broadening wedge and close to local demand. At the same time, it remains inside the larger descending channel, so the higher timeframe trend is still bearish.
Key Levels
โข 0.000091 โ 0.000120 โ Internal resistance / mid-wedge supply
โข 0.000134 โ Broadening wedge upper boundary
โข 0.001159 โ Major higher timeframe resistance
โข Below 0.000078 โ Risk of liquidity sweep toward lower channel support
What This Means
If price reclaims the internal descending resistance, we can see expansion toward the upper boundary of the broadening wedge.
But if rejection continues, market could sweep the lows first, possibly tagging the lower boundary of the macro descending channel before any meaningful bounce.
So structure is expanding short term, but macro trend is still down until the large channel breaks.
NEIRO such a low price here can cause 6xNEIRO/USDT has experienced a prolonged bearish trend over recent years, with price now consolidating at a critical technical confluence. This zone combines a major daily support level, a long-term trendline support, and a potential all-time low (ATL) regionโrepresenting a significant multi-layered support structure.
Such a convergence often precedes a strong corrective or reversal move. From a technical perspective, a sustained hold above this area could initiate a substantial recovery.
Given the magnitude of the preceding decline, a measured move projection suggests a potential upside range of +650% over a 6โ12 month period, should a confirmed breakout above immediate resistance occur. This would represent a partial retracement of the prior bear cycle, not necessarily a full recovery.
It is important to recognize that this scenario is probabilistic and relies on NEIRO maintaining this support zone, followed by a clear shift in market structure and momentum.
DISCLAIMER: ((trade based on your own decision))
<<press like๐ if you enjoy๐
NEIRO/USDT at Critical Level โ Breakout or Continue the Sell-OffNEIRO/USDT on the Daily (1D) timeframe remains in a medium- to long-term downtrend. Since the previous peak, price has consistently formed lower highs and lower lows, confirming strong bearish control. Currently, price is trading below a well-respected descending trendline, which continues to act as a major dynamic resistance.
---
Pattern Explanation
The dominant structure on the chart is a:
Descending Trendline / Bearish Market Structure
The descending trendline connects multiple lower highs.
Price has been rejected several times from this trendline, confirming it as a strong dynamic resistance.
As long as price stays below the trendline, the overall bias remains bearish.
Additional observations:
No valid trend reversal structure is present yet (no higher high).
Recent upward moves are considered pullbacks or retracements within the broader downtrend.
---
Key Levels
Major Resistance Levels:
0.00015100
0.00017850
0.00020300
0.00026500
0.00029800
0.00039500
0.00044400
0.00056300
Support Zone:
Current price area around 0.00012
A breakdown below this zone could trigger a continuation toward new lower lows.
These levels should be treated as reaction zones, not exact prices.
---
Bullish Scenario
The bullish scenario becomes valid only if clear confirmation occurs:
1. Price breaks and closes above the descending trendline on the daily timeframe.
2. A higher high and higher low structure is established.
3. Ideally, a retest of the broken trendline as support follows.
Potential bullish targets:
0.00015100
0.00017850
0.00020300
0.00026500
Without a confirmed breakout, any upward movement remains counter-trend.
---
Bearish Scenario
The bearish scenario remains the primary outlook if:
1. Price is rejected again at the descending trendline.
2. The current support zone fails to hold.
3. Price forms a new lower low.
Bearish continuation would confirm sustained selling pressure and continuation of the broader downtrend.
---
Conclusion
NEIRO/USDT is still trading within a well-defined bearish structure. The descending trendline is the key technical level that will determine the next major move.
Traders should remain patient and wait for clear breakout or breakdown confirmation before making decisions.
The trend remains bearish until proven otherwise.
#NEIRO #NEIROUSDT #CryptoAnalysis #TechnicalAnalysis #Altcoin #BearishTrend #Downtrend #Trendline #PriceAction
NEIRO WHALES ACCUMULATING๐ฅ Fortune AI Radar โ CRYPTOCAP:NEIRO
Fresh activity detected on CRYPTOCAP:NEIRO today.
Data suggests increasing market interest & buyers stepping in.
Technicals currently lean bullish, with momentum trending upward.
Whales showing hints of accumulation and hype rising among traders.
NEIRO/USDT โ Accumulation Before an Explosion or a Deeper Fall?NEIRO is currently sitting at a critical juncture that could define the next major move. The 2D timeframe structure shows a Descending Triangle pattern thatโs tightening โ a sign that selling pressure remains dominant, yet buyers are starting to show strong defense around the main demand area.
---
๐ Technical Overview
Primary trend: Mid-term downtrend with consecutive lower highs since early 2025.
Main Demand Zone: 0.00019 โ 0.00015, a strong accumulation area that has repeatedly held against heavy selling pressure.
Descending Trendline Resistance: Pressuring the price since March, marking a key level to confirm a potential breakout.
Volume: Gradually declining throughout the pattern โ often a precursor to a major volatility spike.
A long wick below the demand zone that quickly closed back inside indicates a liquidity grab โ a classic signal of smart money accumulation from panic sellers before a large move unfolds.
---
๐ข Bullish Scenario
If the price successfully breaks and closes above 0.00026 with rising volume, it would invalidate the descending trendline pressure.
A confirmed breakout from this pattern could trigger a mid-term reversal, with targets at:
0.00039 (first resistance),
0.00056, and
0.00081 as extended targets.
A 2D candle close above the trendline would strongly suggest that momentum is shifting to the bulls.
Such moves are often followed by short-covering rallies and a sharp volume increase.
---
๐ด Bearish Scenario
However, if a 2D candle closes below the demand zone at 0.00015, the Descending Triangle would confirm itself as a bearish continuation pattern.
A breakdown like this could drag NEIRO further down toward the 0.00012 โ 0.00009 range, or even lower if sell pressure intensifies.
This scenario would indicate a lack of strong buying interest at this level โ implying that the market might seek a new structural support area below.
---
๐งญ Conclusion
NEIRO is now in the final accumulation phase of a classical pattern that often precedes a major move.
The market is simply waiting for directional confirmation.
Breakout above โ potential reversal and rally ahead.
Breakdown below โ continuation of the bearish trend.
Be prepared for significant volatility โ when a descending triangle completes, the move that follows is often sharp and decisive.
---
#NEIRO #NEIROUSDT #CryptoBreakout #DescendingTriangle #CryptoSetup #AltcoinAnalysis #MarketStructure #AccumulationPhase #SwingTradeSetup #CryptoTrading
NEIRO on Reversal Watch #NEIRO
The price is moving within a descending channel on the 1-hour frame and is expected to break and continue upward.
We have a trend to stabilize above the 100 moving average once again.
We have a downtrend on the RSI indicator that supports the upward break.
We have a support area at the lower boundary of the channel at 0.00033500, acting as a strong support from which the price can rebound.
We have a major support area in green that pushed the price upward at 0.00032700.
Entry price: 0.000352560.
First target: 0.00036600.
Second target: 0.00038073.
Third target: 0.00029830.
To manage risk, don't forget stop loss and capital management.
When you reach the first target, save some profits and then change the stop order to an entry order.
For inquiries, please comment.
Thank you.
NEIRO/USDT โ Bullish Reversal Setup or Bearish Continuation?๐ Key Takeaways
NEIRO/USDT is currently sitting at a critical demand zone between 0.00030โ0.00044. This area has acted as a strong defensive level for buyers, preventing deeper declines multiple times in recent months.
While the macro trend remains bearish, the recent structure shows a consolidation phase (sideways range), which could either become a base for a relief rally or a continuation pattern for another leg down.
The market stands at a crossroad: Will buyers push for a breakout, or will sellers take control with a breakdown?
---
๐ Key Technical Levels
Demand Zone (Main Support): 0.00030 โ 0.00044
Additional supports (if breakdown occurs): 0.00022 and 0.00013
Key Resistance Levels (bullish targets):
R1: 0.00061749
R2: 0.00090443
R3: 0.00126321
R4: 0.00208555
R5: 0.00273117
R6: 0.00311729 (major swing high)
---
๐ Chart Structure & Pattern
The broader downtrend remains visible (lower highs & lower lows).
A sharp rebound in May 2025 indicates a possible liquidity sweep.
Current price action shows range-bound consolidation around the yellow demand box.
This setup resembles an accumulation base: strong demand could trigger a rally.
Failure to hold this zone would confirm a bearish continuation toward lower supports.
---
๐ Bullish Scenario
1. Breakout confirmation: Daily close above 0.00044182 with strong volume.
2. Upside targets:
Target 1: 0.00061749
Target 2: 0.00090443
Target 3: 0.00126321
Extended targets (if momentum builds): 0.00208555 โ 0.00273117
3. This zone could serve as the foundation for a strong relief rally if buyers step in.
4. Risk-to-reward is favorable: entries near support offer high potential upside vs. limited downside.
---
๐ป Bearish Scenario
1. Breakdown confirmation: Daily close below 0.00030.
2. This would invalidate the demand zone โ buyers lose control.
3. Downside targets:
Target 1: 0.00022
Target 2: 0.00013
4. Breakdown could trigger panic selling or a capitulation move.
---
๐ Trading Approach
Conservative traders: Wait for daily close confirmation (breakout or breakdown).
Aggressive traders: Consider entries inside the demand zone (0.00036โ0.00040) with tight stops below 0.000295.
Take profit gradually at key resistance levels to lock gains.
Always check volume and momentum indicators (RSI, MACD) for confirmation.
---
โ ๏ธ Risk Note
Crypto markets are highly volatile โ never go all-in.
This analysis is for educational purposes only, not financial advice.
Always apply stop-loss and proper risk management.
---
โจ Conclusion
NEIRO/USDT is currently trading at its most critical demand zone.
If it holds, buyers may fuel a significant rebound toward 0.00061749 โ 0.00090443 โ 0.00126321.
If it fails, a breakdown toward 0.00022 and 0.00013 becomes highly likely.
The market is at a major decision point: will this demand zone serve as the foundation for a bullish reversal, or will it lead to the next bearish leg down?
#NEIRO #NEIROUSDT #AltcoinAnalysis #CryptoTrading #SupportResistance #DemandZone #Breakout #BearishOrBullish #PriceAction #CryptoChart
NEIRO/USDT โ Accumulation Before Rally or Breakdown?โจ Overview:
NEIRO is now at a make-or-break level. Price has once again tested the daily demand zone (0.00033โ0.00038), the same area that fueled the strong rally back in May. This zone acts as the last line of defense for buyers to hold the structure and prevent deeper downside.
At the same time, the chart is shaping a descending triangle pattern โ consistent lower highs pressing down into a flat support zone. This signals compression and building pressure, ready to explode either upward (bullish breakout) or downward (bearish breakdown).
---
๐ข Bullish Scenario
1. A positive reaction from demand with a D1 close above 0.00040 could spark a recovery.
2. Stronger confirmation comes with a break above 0.0004402, opening the path to higher resistances:
๐ฏ Target 1: 0.0005109
๐ฏ Target 2: 0.0006198
๐ฏ Target 3: 0.0009048 (major supply retest)
3. If buyers can maintain a higher low above 0.00036โ0.00038, momentum shift toward reversal is likely.
---
๐ด Bearish Scenario
1. A daily close below 0.00033 confirms a breakdown, turning the demand zone into fresh supply.
2. Downside targets then extend to:
โ ๏ธ Target 1: 0.0002700
โ ๏ธ Target 2: 0.0001650
โ ๏ธ Final Extension: 0.0001390 (the chartโs marked low).
3. This would reinforce the broader bearish trend that has dominated since the January 2025 peak.
---
๐ Pattern & Context
Descending Triangle: lower highs compressing toward flat support โ a typical breakout setup.
Demand Zone: the yellow block is a historical base that once fueled a rally; now itโs the battleground.
Momentum: the longer price compresses here, the stronger the breakout reaction is expected.
---
๐ Trading Plan Summary
Bullish Play: look for entries near support with stop below 0.00033 โ targets 0.00044 / 0.00051 / 0.00062.
Bearish Play: wait for D1 close below 0.00033 โ sell on retest โ targets 0.00027 / 0.000165.
Key: The 0.00033โ0.00038 demand zone is the ultimate decision point.
#NEIROUSDT #Altcoin #CryptoAnalysis #DemandZone #DescendingTriangle #PriceAction #SupportResistance
NEIROUSDT that 300% is cooking The neckline of pattern which was 0.00068$ didn't break previous time and price is still range and dead but soon i think the 0.0007$ resistance zone will break with high volume and this signal can hit take profit.
DISCLAIMER: ((trade based on your own decision))
<<press like๐ if you enjoy๐