NEWT/USDT (1h) Testing Rising Wedge SupportNEWT/USDT is trading inside a rising wedge on the 1H chart, with both trendlines sloping higher while gradually converging. Price is forming higher highs and higher lows, but the narrowing structure can signal weakening bullish momentum.
Price is currently around $0.0483, testing the lower rising trendline. A confirmed 1H breakdown below roughly $0.0480–$0.0482 could validate the bearish wedge setup and open the way toward the $0.0447–$0.0448 measured target area.
A bounce from support would kee
NEWT / TetherUS
No trades
No trades
In-depth trading ideas
NEWT/USDT (1h) Testing a Falling Wedge BreakoutNEWT/USDT is consolidating inside a falling wedge on the 1H chart, with price forming lower highs while repeatedly holding the gradually descending support. The structure has been tightening, and price is now testing the upper trendline around $0.0412–$0.0415.
A confirmed breakout above the wedge resistance could trigger a bullish recovery toward the previous major resistance zone around $0.0455–$0.0463. A rejection from the upper boundary would keep the wedge active, while a breakdown below th
NEWTUSDT Forming Falling WedgeNEWTUSDT is forming a clear falling wedge pattern, a classic bullish wave signal that often indicates an upcoming breakout. The price has been consolidating within a narrowing range, suggesting that selling pressure is gradually weakening while buyers are beginning to regain control. With consistent trading volume confirming accumulation at lower levels, the current setup points toward the possibility of a strong bullish breakout in the near term. If the breakout is confirmed, the projected move
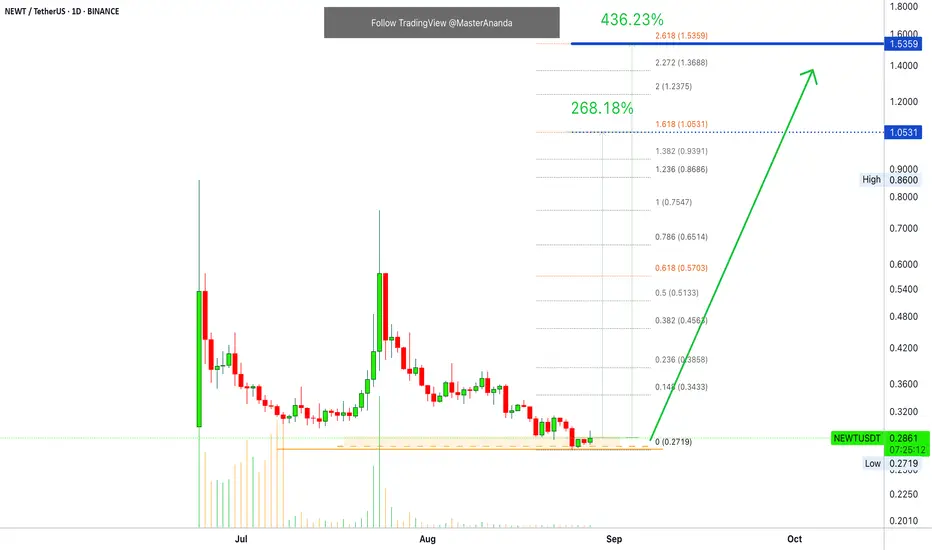
Newton Protocol (NEWT): 1,400% Profits Potential —The ExperimentThe market tends to move in unexpected ways... Wait. The market tends to move based on certain patterns and rhythms. The market tends to be highly predictable. This predictability can be exploited.
Imagine you are watching a crowd of people all enclosed in a room. 70% of the people have a green suit while 30% have a red suit. It is an experiment. There are at least 1,000 people in the room and you are looking from a high place, you can clearly see the green and red variations of their suits.
T
NEWTUSDT Extreme Bull With Both Squeezes Fired And Whale BuyNEWTUSDT 27/02/2026 19:10
💰 0.0860 | Fut: 0.0831 🔥 Extreme BULL 84.31%
🟢(92.2%) : 🔴(7.8%) ⏳Clarity: 46%
Retrace: -1.8% Bounce: 46.8% 25.6x 🚀 Parabolic
NEWT is trading at 0.0860 spot and 0.0831 futures with an extreme bullish structure reading 92.2 to 7.8 in favor of buyers across 47 bull signals against 4 bear out of 112 total. The counter-trend depth sits at 12 to 2 bullish. The spread at 84.3 percent with extreme conviction and a 25.6x bounce-to-retrace ratio in parabolic territory makes thi
NEWTUSDT Forming Falling WedgeNEWTUSDT is forming a clear falling wedge pattern, a classic bullish reversal signal that often indicates an upcoming breakout. The price has been consolidating within a narrowing range, suggesting that selling pressure is weakening while buyers are beginning to regain control. With consistent volume confirming accumulation at lower levels, the setup hints at a potential bullish breakout soon. The projected move could lead to an impressive gain of around 60% to 70% once the price breaks above th
Newton Protocol · Catching A Falling Knife While Earning 511%What do you do if things go wrong, keep trying or give up?
Personally, I never give up. What about you?
NEWTUSDT went beyond the previous low. Seeing this, I decided to buy more at the new low rather than selling at support. In this way I can a build a strong position and profit when the market turns. Will the market turn?
See how Bitcoin is doing today. There has been lots of sideways, lots of bearish action, but support continues to hold long-term. Today Bitcoin is moving above $110,000, alr
Newton Protocol Update · Futures Trading Trade-NumbersLast time didn't go that well and that's ok, we take the loss. The nice part is that this is a spot trade so we simply wait. I made the mistake of jumping in too early on the retrace. This position I let sleep and put my focus on something else; eventually, it recovers.
When we make a mistake with a spot position, we can take a small loss and make sure not to repeat the same mistake again; or, we can turn the mistake into a wait. Since we know the market is going up but the only thing off was m
Newton Protocol · Round 2 Goes Easy To $1.20The higher low is in now and the strong bullish breakout we witnessed just a few days ago reveals the massive force behind this pair. Traders are ready to trade.
The high volume is good because volume is needed for growth. The first jump was only a small taste of what is possible, and seeing the action as it is now, NEWTUSDT is already preparing to produce a higher high.
This is good news for a buyer now and also for the rest of the market. If NEWTUSDT is ready to move forward with strength, t
NEWT/USDT -Wave 3 NEWT/USDT is displaying a super bullish structure with a textbook wave formation. After completing its first impulsive leg (Wave 1) the price entered a healthy correction phase lasting over 25 days retracing approximately 50% a classic Wave 2 retracement.
The recent strong up move marks the beginning of Sub-Wave 1 of the larger Wave 3, which is often the most explosive part of the cycle. Currently, price is stabilizing and holding key levels that NEWT is preparing to complete the full Wave 3
Newton Protocol · Volume Signal · 150% PP Short-TermI will show you now a successful choice on a volume signal as we look at Newton Protocol (NEWTUSDT) on the daily timeframe.
Notice how trading volume is flat while NEWTUSDT is producing a rounded bottom with the daily candles. It reads "zero volume" on the chart.
Now notice the strong "volume jump" today, 23-July, as soon as the action moves outside the rounded bottom, also a Fib. extension resistance. The strong jump confirms the start of a bullish advance. Our short-term target gives us 150%
Breakout Play✅ Option 1: Early Accumulation Entry (Risky)
• Entry Zone: 0.3150 - 0.3180
• Target 1: 0.3350 - 0.3430 (Range High)
• Target 2: 0.3650+ (if breaks out of range)
• Stop Loss: Below 0.3050
✅ Option 2: Breakout Confirmation Entry (Safer)
• Entry: Above 0.3430 (On strong volume breakout)
• Target 1: 0.3650
• Target 2: 0.4000+
• Stop Loss: Below 0.3250 after breakout confirmation
Reasoning:
• Sideways structure between 0.3073 - 0.3430 indicates market indecision.
• A clean breakout abo