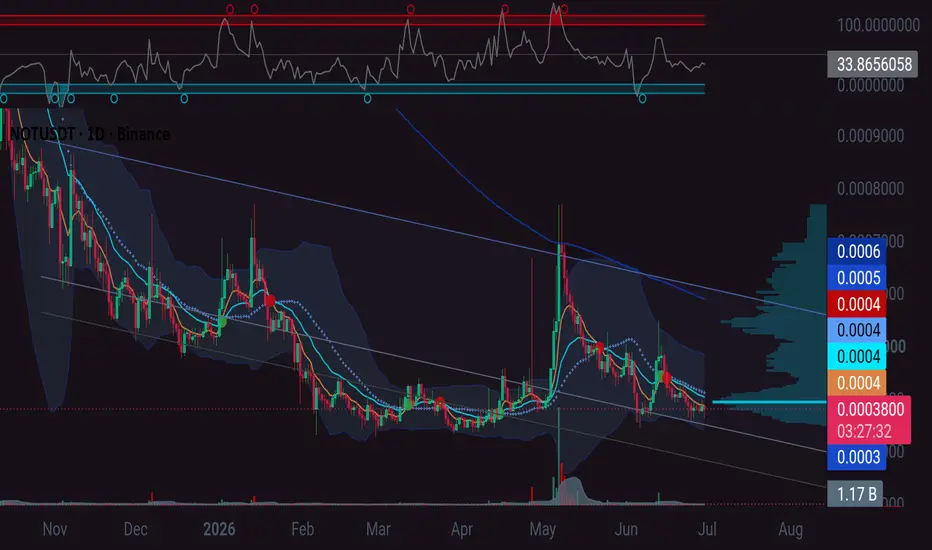
NOT / NOTUSDT Bullish Setup | Futures Trade Idea
SOMI / SOMIUSDT Long Setup | Breaker Block Reclaim
MARKET ANALYSIS
NOT is currently reacting from a key technical area highlighted on the chart.
As long as the protected support zone remains intact, the bullish market structure remains valid and higher liquidity targets may continue to attra
#NOTUSDT — Holding the Last Fortres, Recovery or Final Break#NOT
The price is moving within a descending channel on the 1-hour timeframe and has reached the lower boundary. It is now poised for a bounce and is expected to retest this boundary.
The Relative Strength Index (RSI) indicates a downward trend, which is likely to continue given the overbought con
#NOTUSDT — Holding the Last Fortres, Recovery or Final Break#NOT
The price is moving within a descending channel on the 1-hour timeframe and has reached the lower boundary. It is now poised for a bounce and is expected to retest this boundary.
The Relative Strength Index (RSI) indicates a downward trend, which is likely to continue given the overbought con
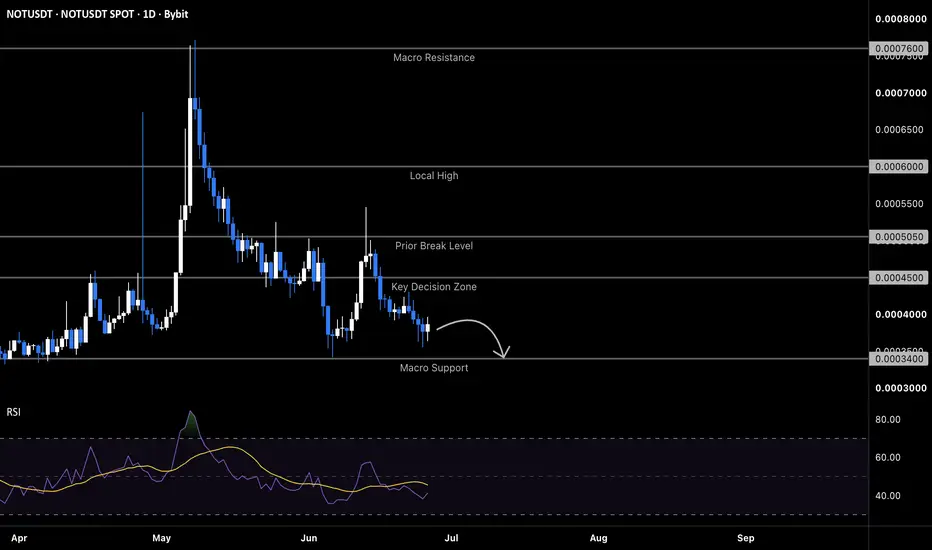
NOTUSDT: local squeeze with $0.000300 destinationThe Macro Picture 🗺️
Since the May peak, NOT has wound itself into a textbook Local Squeeze — a descending series of lower highs ($0.000600 → $0.000505 → $0.000490) pressing down on a perfectly flat $0.000340 floor. That structure is a coil, and coils store energy for one decisive release: each bo
NOTUSDT at macro floor: breakdown toward $0.000300The Macro Picture 🗺️
The June bounce off $0.000340 promised a reclaim but never delivered — price stalled at a lower high near $0.000505, got sold inside the supply band, and has spent the back half of the month grinding straight back down to the macro floor. That is the signature of a failed stru
NOTUSDT — Active Bearish Sequence With Liquidity ClearedOKX:NOTUSDT is showing a clean bearish continuation structure on the 30M.
The sequence is still active. B has not been invalidated, and the C target remains unreached. That matters because as long as B holds, the downside objective is still alive.
What makes this setup interesting is not just the
Notcoin bottom consolidation continues, bullish bias strengthensWith each day that passes with Notcoin trading above support, the bullish bias becomes stronger. With each day that passes with a lack of bearish action, the bulls become stronger.
Good afternoon my fellow Cryptocurrency trader, I hope you've been having a wonderful day.
NOTUSDT is looking good an
NOT Local trend. Sideways -98%. Reversal zones 27 01 26Logarithm. 3-day time frame.
The price in the main trend is still in a downward channel with a given volatility range.
Medium-term - locally , another sideways trend has formed (the third in a downward channel), but the decline is already -98% (not counting the futures long, which was previous
NOT Main Trend. Descending Channel -98% 01/27/2026Logarithm. Time frame: 1 week.
The price is in the main trend and remains in a downward channel with a given volatility range.
It's important to understand that the creators of this cryptocurrency always sell at any price (they're created for profit, fueled by hype). However, at low prices
See all ideas
Summarizing what the indicators are suggesting.
Oscillators
Neutral
SellBuy
Strong sellStrong buy
Strong sellSellNeutralBuyStrong buy
Oscillators
Neutral
SellBuy
Strong sellStrong buy
Strong sellSellNeutralBuyStrong buy
Summary
Neutral
SellBuy
Strong sellStrong buy
Strong sellSellNeutralBuyStrong buy
Summary
Neutral
SellBuy
Strong sellStrong buy
Strong sellSellNeutralBuyStrong buy
Summary
Neutral
SellBuy
Strong sellStrong buy
Strong sellSellNeutralBuyStrong buy
Moving Averages
Neutral
SellBuy
Strong sellStrong buy
Strong sellSellNeutralBuyStrong buy
Moving Averages
Neutral
SellBuy
Strong sellStrong buy
Strong sellSellNeutralBuyStrong buy
Displays a symbol's price movements over previous years to identify recurring trends.