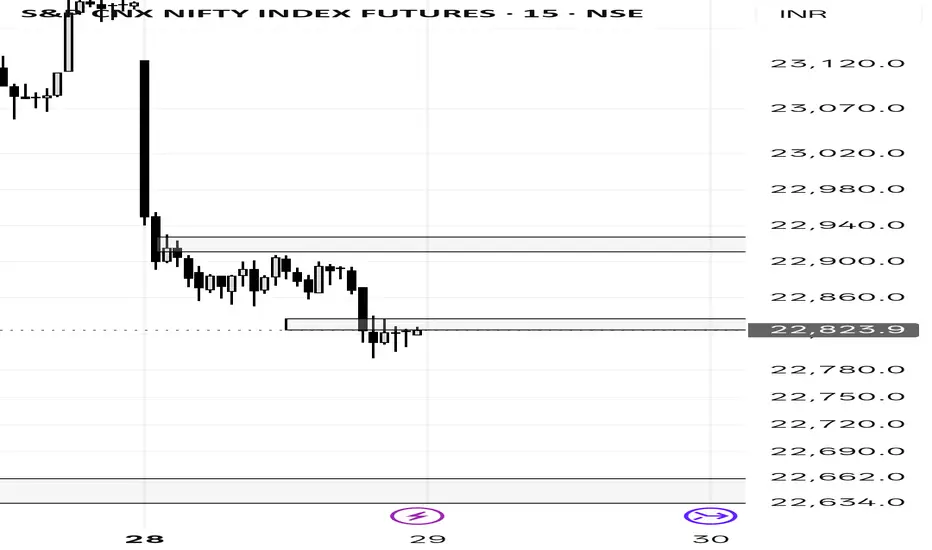
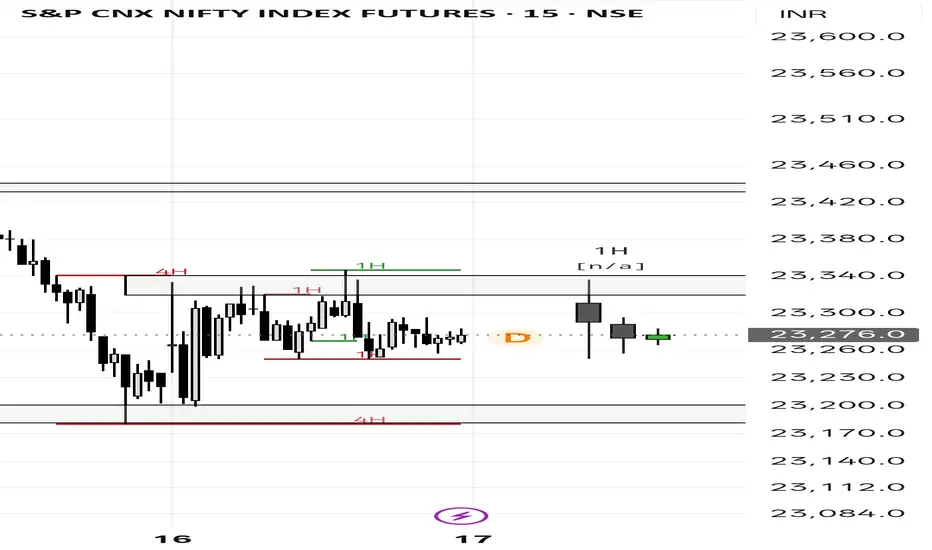
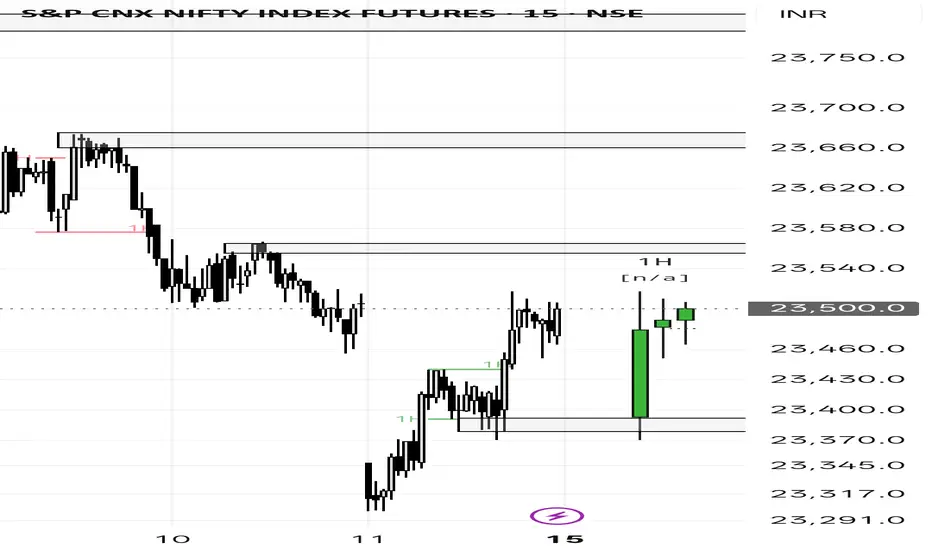
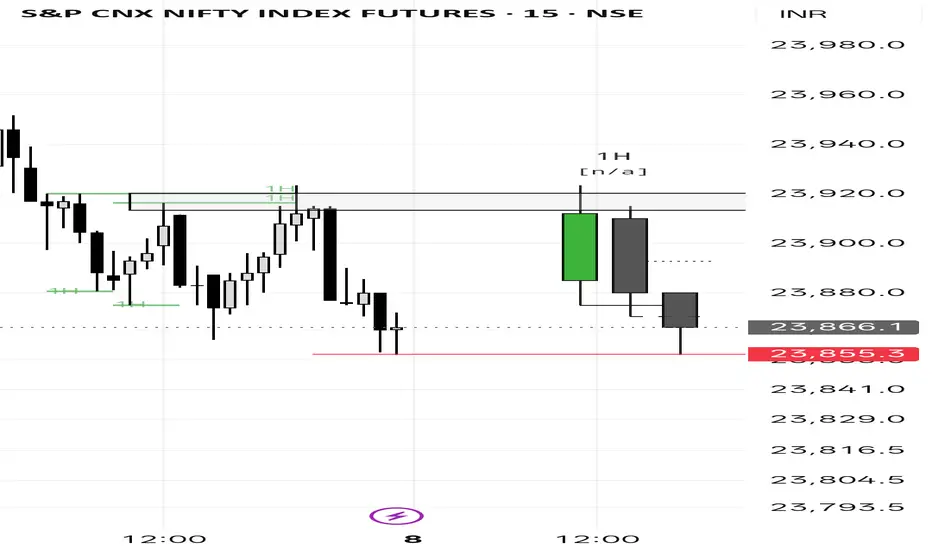
GIFT NIFTY – Major Support Breakdown SetupGIFT NIFTY is currently testing a major support zone around 23,000–23,050, which also coincides with the earlier gap-support area.
A long-legged spinning candle has formed around this support, indicating indecision at a critical level. However, the broader structure remains weak, with price having declined from the 24,800–25,000 region and subsequently forming lower highs.
The key level is 23,000.
If GIFT NIFTY breaks and sustains below 23,000, the current support structure would be violated
In-depth trading ideas
Plan for 1st October 2026 Nifty future and banknifty future analysis and intraday plan.
This video is for information/education purpose only. you are 100% responsible for any actions you take by reading/viewing this post.
please consult your financial advisor before taking any action.
----Vinaykumar hiremath, CMT
NIFTY Futures — Elliott Wave Count: Wave 5 Downside SetupThe chart presents a larger ABC corrective structure from the previous high, with the current decline developing as the next impulsive leg.
Short term - Bullish...
Elliott Wave Structure
* Wave A: The initial major decline from the ~26,500 area toward 22,050, completing the first leg of the correction.
* Wave B: A complex corrective recovery followed, forming an A-B-C structure and ultimately reaching the ~24,800 region.
* From the Wave-B peak, the market appears to be developing the final
Nifty positional Trade view by Pankaj Bagri📊 **NIFTY FUTURES – POSITIONAL SETUP**
**Support Zone:** 23,100
**Upside Targets:** 25,200 → 26,200
NIFTY Futures is approaching a **strong 23,100 support zone**. If this zone continues to hold and price shows a reversal/confirmation, it can provide an opportunity to build a **positional long position** in a staggered manner.
🎯 **Target 1:** 25,200
🎯 **Target 2:** 26,200
📌 **Trade Plan:**
• Accumulation near the 23,100 support zone
• Prefer staggered entry rather than entering the entire pos
NIFTY 50 – Breakout/Breakdown SetupNIFTY is currently trading around 23,443 after losing the short-term rising trendline, indicating that the recent bullish structure is weakening. The 23,500–23,580 zone marked on the chart is the key decision area; a sustained move back above this zone could invalidate the bearish scenario and open the possibility of a recovery toward 23,700–23,800. On the other hand, a comfortable break and close below the lower boundary of the box would strengthen the bearish setup and could trigger an impulsi
nifty or bank nifty range shifty analysisNifty index----all eyes on usa—iran tension let see rise on or not!!!!!!
Nifty have to watch 24250—300 if sustain above than looks 24390---499+++++ yes one spike may be possible above level. Where support 23900@ if sustain below than down side 23828—770 than after 23600-23500 range possible if gulf war escalate. Than 23000 soon no if and but.
Over all if find near rejection hurdle point or support level than will take to try entry
Now easy level giving below in table format
Major Resistan