Cup and Handle Setup in DieselApril last year (2025) marked the trough for both crude oil and diesel prices. February this year saw the beginning of the U.S.– Iran conflict. From that trough to the September high, diesel prices have risen significantly +169%, more than crude oil prices that was +94%.
What are the reasons that Diesel has broken its all-time high?
Not yet for the crude oil prices, but will it play a catch-up with diesel subsequently?
And what will be their long-term outlook?
Ticker: HO
Minimum fluctuation
New York Harbor Residual Fuel 1.0% (Platts) Futures (May 2027)
No trades
No trades
In-depth trading ideas
Is Diesel Truly Seeing a Top Here?A lot of traders are looking at the recent pause in diesel futures and calling for a massive top because momentum indicators are showing a divergence. But when you look beneath the surface and check the real fuel of the market which is volume, the story changes completely.
Let us compare where we are right, left , with the historical run on the right.
The Past Blueprint: Real Institutional Distribution
During the previous cycle on the right, the market gave clear warning signs before it rolle
HO1! Multiple Timeframe Alignment
Looking at both the Daily chart (LEFT) and the 4H chart (RIGHT), we can see that the price is trending upward on both timeframes, consistently forming higher highs and higher lows.
If the 4H timeframe is the trading timeframe, $4.8250 could be a potential entry level, as this zone previously acted as resistance and now has the potential to act as support.
Additionally, the Volume Profile shows that this level also represents a Low Volume Node (LVN).
HO1! - Squeezing HigherHeating oil has broken out of yet another pattern and is squeezing higher. This is occurring at the same time as the USOIL breakout. To review that post, view it here:
Now looking at heating oil futures, the first breakout occurred above the downtrend dating back to March 2026, where sellers rejected price at the trendline multiple times (red circles) before the actual breakout occurred in mid July.
Then, at the very beginning of August, old resistance flipped into new support (green circle)
The Diesel Crunch: Surge, Pullback, and the Path AheadRefined fuel markets have been on a tear since mid-October. Gasoline (RBOB) and distillates (HO) spiked on tight supplies, outages, and a diesel-driven squeeze, pushing the 3:2:1 crack spread to its 2025 high.
Margins have eased since, but they remain elevated — a clear sign that refining conditions are not normal.
This paper breaks down what drove the surge, why product prices have been so volatile despite subdued crude, and how these forces are shaping near-term refining margins and the b
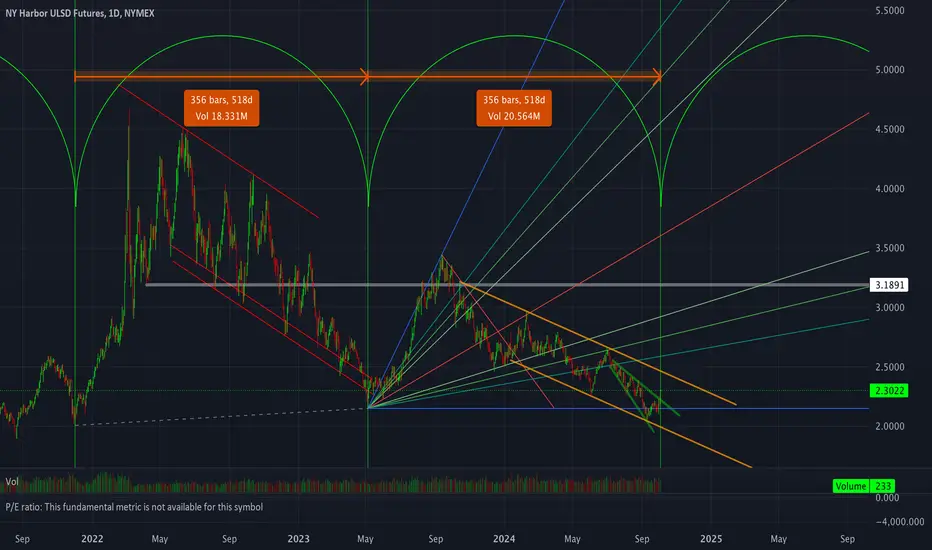
HO Time CycleThere’s a 518 day time cycle from the 2 previous major lows to today. There’s also a falling broadening wedge breakout, DMI cross (not shown), and escalating regional conflict in the Middle East. Iran has launched ballistic missiles at Israel. There is a major downtrend but it’s far enough overhead that there’s headroom for upside. The trend seems vulnerable to failure, all things considered. This analysis establishes a bullish daily bias. Intraday long setups may be necessary for a good e
Cyclical Analysis - Heating OilIf you follow my channel, you know that I am long Heating Oil, and am looking for more entries long, based on my COT strategy setup.
Today, we look at Heating Oil through the lens of cycles. Do cycles support the COT Buy Setup?
As you will see, there is some compelling cyclical data that is supportive of the idea for Oil to rise to October 10-20, and then decline before putting in a major cyclical low in December.
8/2/24 - VROCKSTAR portfolio snapshot bc mkt is cray craydon't really anticipate doing these so often really.
but so much has happened and i've been maxing out GDLC (as many of you know, then sizing it down), in and out of weird EPS stuff, semi's weren't really even in my portfolio prior, now they are. god knows what happens next. I like a cash buffer, but equally i had gotten pretty cash heavy the last week/s-ish as you know, so i've been deploying hard.
OTC:GDLC - 30%. Still trades at a massive discount. Would size the hell out of it if I didn't
7/11/24 - VROCKSTAR portfolio snapshot for start of 2Husing a rando ticker to do this lol
have been a lot of movements since i started writing maybe 2.5-3 mo at this pt. in out, size up, size down. so i'll need to figure out a rhythm to even give these periodic updates. but bc i enjoy the DMs so far and the comments/ interactions... this is probably the easiest way to show where i stand w a lot of things. mainly to be helpful to the guys who follow me more closely if this helps your process or you want to dig in on any of these topics or sizing th
May we fill up the gas tank of the car?Hello Traders
Jerome Powell has spoken and the economy seems to be not so "overheated" and the labor market seems calm after the "spikes" of 2020-2021. This could suggest that perhaps the much talked about interest rate cuts that have been mentioned may be coming. Powell spoke to the Senate informing them of the risks facing the economy. "risks on both sides" and with a labor market in apparent balance. He also made reference to the fact that if rate increases are implemented it will be based on
GLong
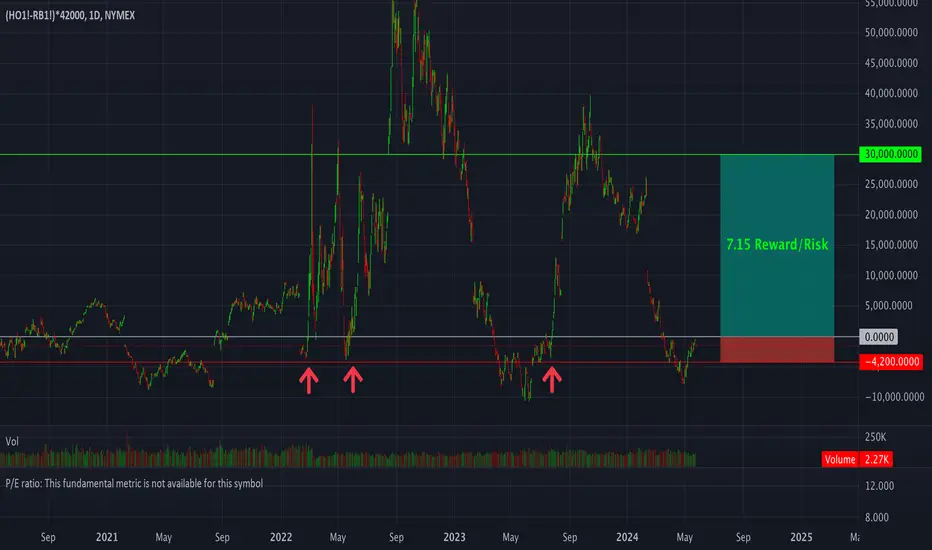
Dangerous TradeThis trade has bad idea written all over it. Don’t try this at home. Not investment advice. etc. It has come to my attention that HO i.e.. NY Harbor heating oil which is a proxy petroleum distillate for diesel has gotten more expensive than gasoline in recent years many times and that it has done so in an aggressive manner quite a few of those times. This aggression is easily captured by charting the spread between HO and RB. RB is refinery gasoline. The formula for the spread is HO1! - R
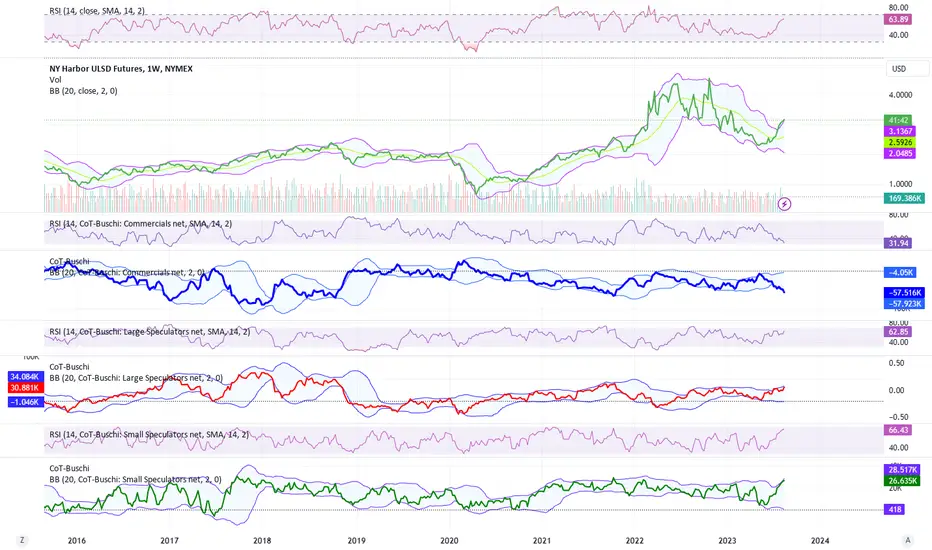
The down trend in heating oil startsWe got sell signals based on cot data from #cotreport in crude oil and gasoline. The heating oil is strong correlated with RB and CL. When the sell cot signal stats to work out, we will see also a down trend in HO. The HO is the weakest one in the energies sector, therefore I expect a down trend in HO. I am waiting for my entry pattern to open a short position in this market.
ULSD Gulf Coast, Technical AnalysisFor PEMEX Mexico's prices:
Throughout the year 2023, there has been a bearish trend in the international reference price. However, in the last weeks of July 2023, there was an increase in international reference prices. The Fibonacci retracement technique was used to assess potential support and resistance levels.
The analysis shows that the next price resistance level is at 2.6413 USD, equivalent to $24.98 MXN. However, it is unlikely to reach this level as the highest recorded price to date