NG1! Is Bullish! Long!
Please, check our technical outlook for NG1!.
Time Frame: 9h
Current Trend: Bullish
Sentiment: Oversold (based on 7-period RSI)
Forecast: Bullish
The market is approaching a key horizontal level 2.792.
Considering the today's price action, probabilities will be high to see a movement to 2.966.
Compare with Henry Hub Natural Gas Futures (Sep 2016)
Contract highlights
Natgas to fall further. Funds remain net short I called it earlier back in June that natural gas prices would start falling.
Hedge funds remain net short on natural gas as retail traders are net long.
There is an untapped demand zone since 2024 which is at approx $2.36.
Surprisingly, retail positions are still net long, which tells me that tra
Gold Price Forecast | Oil | Dollar | Silver | Natural Gas.0:00 - Weekly Commodities Market Introduction
0:29 - Natural Gas ( PEPPERSTONE:NATGAS ): Bear Flag Continuation & Daily RSI Oversold NYMEX:NG1!
1:19 - Natural Gas Trade Strategy: Waiting for Multi-Timeframe RSI Alignment
2:41 - Natural Gas Key Resistance Levels & Inverse Head & Shoulders Setup
3:3
NG (Natural Gas Futures) — Technical Structure Analysis📈 NG (Natural Gas Futures) — Technical Structure Analysis
Chart Visual & Pattern Layout: ChartsSpecialist (via TradingView)
🔍 Technical Observations
Major Resistance Rejection Zone: Price action encountered strong overhead supply around the 3.339 – 3.393 band ("Major Resistance"), forming multiple
Gold Price Forecast | Oil | Dollar | Silver | Natural Gas0:00 - Weekly Commodities Market Introduction
0:31 - Natural Gas (NATGAS): Bear Flag Breakdown & $2.80 Key Floor NYMEX:NG1!
1:39 - Natural Gas Bull vs. Bear Scenarios ($2.90 Resistance & $2.50 Target)
3:26 - RSI Data & Risk Management: Why Bottom-Fishing Is Risky
4:55 - Crude Oil (WTIC): Geopoliti
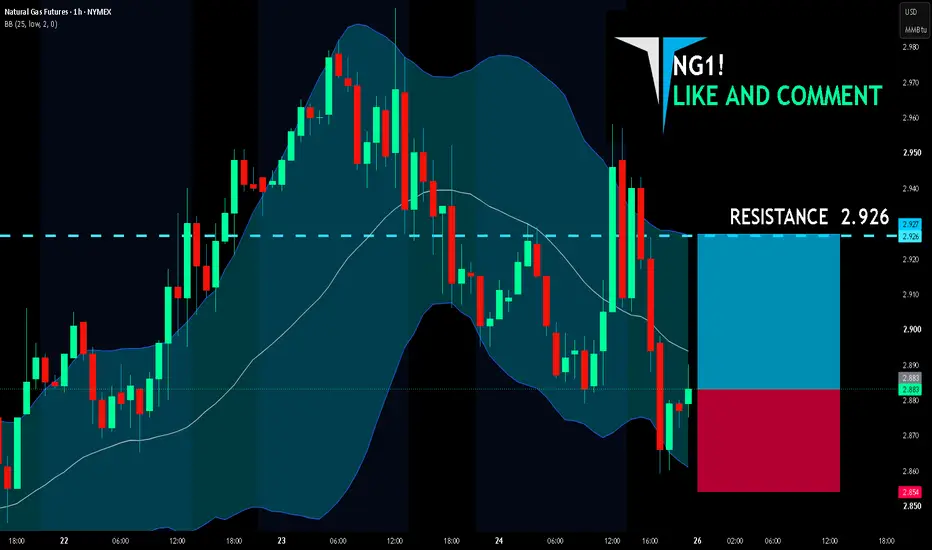
NG1! LONG FROM SUPPORT
NG1! SIGNAL
Trade Direction: long
Entry Level: 2.883
Target Level: 2.926
Stop Loss: 2.854
RISK PROFILE
Risk level: medium
Suggested risk: 1%
Timeframe: 1h
Disclosure: I am part of Trade Nation's Influencer program and receive a monthly fee for using their TradingView charts in my analysis.
✅LI
NG Short — Natural gas' short-covering bounce is running out of A recent short-covering bounce in natural gas has stalled, aligning with a broader bearish fundamental outlook driven by high storage and strong production. The failed breakout trigger confirms upside momentum exhaustion, offering a pullback short entry. With structural oversupply still dictating th
NG Short — Short-covering rally fizzles as strong production, amRecent upside is widely attributed to short-covering rather than a structural shift, setting up an ideal pullback short. Strong production, above-average storage, and cooler weather forecasts firmly confirm the bearish technical trend down to 2.62.
📍 Entry: 2.754
🛑 Stop: 2.802
🎯 Target: 2.620
⚖️ R:
Time To Buy Natural Gas? Natural gas is setting up its next move as we approach a Thursday inventory report.
So far for the month of July we have had 2 bearish reports and 1 bullish report.
Price action for July has been following a bearish trend and appears as if its likely going to see more bearish trend.
The Natura
See all ideas
A representation of what an asset is worth today and what the market thinks it will be worth in the future.
Displays a symbol's price movements over previous years to identify recurring trends.
Frequently asked questions
The nearest expiration date for Henry Hub Natural Gas Futures (Sep 2016) is Aug 29, 2016.
Traders prefer to sell futures contracts when they've already made money on the investment, but still have plenty of time left before the expiration date. Thus, many consider it a good option to sell Henry Hub Natural Gas Futures (Sep 2016) before Aug 29, 2016.