Middle East Geopolitics: Trading Roadmap for Micro WTINYMEX: MCL
Core Pricing Framework:
Futures Price = Intrinsic Supply-Demand Value + Market Sentiment + Geopolitical Premium
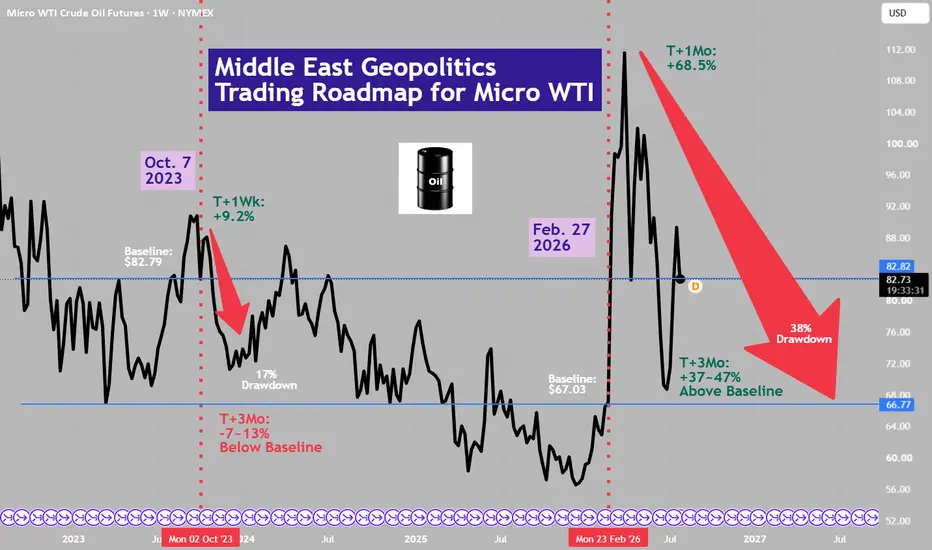
Based on historical Middle East conflict price patterns, we break down long-only, short-only and spread arbitrage trades for CME Micro WTI (MCL) futures across 3-month and 6-month holding windows, with hypothetical profit targets and risk limits.
Key Historical Benchmark (WTI Geopolitical Premium Cycle)
1. Isolated Gaza conflict (2023)
WTI spiked 9.7% short-term; 95% of crisis premium erased within 3 months; prices fully reverted to supply-demand fundamentals in 6 months. Sustained bull runs are unsustainable for standalone Palestinian-Israeli friction.
2. U.S.-Iran direct conflict + Gaza spillover (Current Market)
Dual risk chains create persistent premiums: Red Sea shipping disruptions from Houthi attacks + intermittent closure of the Strait of Hormuz (20% of global seaborne crude). The forward curve stays in backwardation, creating structured spread trading opportunities.
Core Contract Specs for MCL:
- Contract size: 100 barrels WTI; $100 P&L per $1 barrel price move
- Initial margin: ~$620 per contract, 1/10 of standard CL crude futures
- Holding windows: 3 months (90 days), 6 months (180 days)
Strategy 1: Long MCL (View on Conflict Escalation / Hormuz Blockade)
Trigger Scenario:
Continuous U.S.-Iran airstrikes, prolonged Hormuz shipping restrictions, no large-scale SPR releases from G7, OPEC+ refuses output hikes.
Hypothetical Profit Targets (Base WTI: $84.46):
• 3-month holding: Peak range $98–$118, single-contract profit $1,354 – $3,354
• 6-month holding: Sustained blockade lifts price floor to $95–$105, profit $1,054 – $2,054
Primary Risks:
• U.S.-Iran ceasefire restores full Hormuz shipping; WTI drops to $72–$76, max loss ~$1,246 per contract
• Recessionary demand destruction, hawkish Fed monetary policy cap oil upside
• Massive OPEC+ supply offsets geopolitical shortages
Trading Rules:
Enter on pullbacks to $78–$82; hard stop-loss below $70; take partial profits at $96 (3M) / $102 (6M). Cap position size at 15% of total capital.
Strategy 2: Short MCL (View on Geopolitical Premium Fade)
Trigger Scenario (Base High-Probability Case):
No permanent destruction of major oil infrastructure, no OPEC-wide oil embargo. Historical data confirms 70%–100% of wartime risk premiums vanish within 6 months under limited regional confrontation.
Hypothetical Profit Targets (Base WTI: $84.46):
• 3-month holding: Premium fades to $74–$78, single-contract profit $646 – $1,046; ceasefire could push prices to $70–$73 for $1,146 – $1,446 profit
• 6-month holding: Supply expansion + weak demand drag prices to $68–$75, profit $946 – $1,646
Primary Risks:
• Full Hormuz blockade sends WTI above $110, single-contract drawdown over $2,500
• Summer refinery maintenance cycle temporarily supports crude prices
Trading Rules:
Initiate short positions above $90; hard stop-loss above $120; fully close all shorts before 6-month contract expiry.
Strategy 3: Backwardation Spread Arbitrage (Long Near-Term MCL + Short 6M Deferred MCL)
Core Logic:
Near-term MCL prices price immediate Hormuz/Red Sea supply fears; deferred contracts price long-run supply recovery and soft demand. Backwardation creates spread opportunities with muted directional risk.
- Current spread: Near-month trades $4–$6 premium over 6-month deferred contract (spread P&L: $400–$600 per spread pair)
Hypothetical Profit Breakdown:
• 3-month hold: Escalation widens backwardation to $7–$9 for $300–$500 spread profit; de-escalation narrows spread to $1–$2 with limited loss of $200–$400
• 6-month hold: Geopolitical premium fades, backwardation collapses to $0–$1; lock in average $200–$400 profit by exiting at the 3-month peak
Advantages vs. Directional Trades:
• Hedged against extreme single-sided price shocks; crude rallies/crashes move near/far contracts in tandem
• Margin usage ~70% of single-sided positions, higher capital efficiency
Key Risks:
• Rapid full ceasefire flips curve to contango, erasing backwardation premium
• Roll costs and liquidity slippage during contract roll cycles
Takeaways
• The standalone 2023 Gaza conflict only generated short-lived price spikes; short trades hold strong edge over 3–6 months. U.S.-Iran direct confrontation adds persistent shipping risk premiums, creating tactical long opportunities, though long-only holdings underperform over a full 6-month cycle.
• For 3-month horizons, backwardation spread arbitrage is preferred for stable, low-volatility returns. For 6-month horizons, fading geopolitical risk premiums via short MCL is the core baseline allocation.
• Critical monitoring metrics: Hormuz tanker throughput, OPEC+ output policy, G7 SPR release schedules, U.S.-Iran diplomatic negotiation progress. These variables directly dictate the lifespan of crisis premiums.
Disclaimers
*Trade ideas cited above are for illustration only, as an integral part of a case study to demonstrate the fundamental concepts in risk management under the market scenarios being discussed. They shall not be construed as investment recommendations or advice. Nor are they used to promote any specific products, or services.
CME Real-time Market Data help identify trading set-ups and express my market views. If you have futures in your trading portfolio, you can check out on CME Group data plans available that suit your trading needs www.tradingview.com
E-mini Crude Oil Futures (Jun 2027)
No trades
No trades
In-depth trading ideas
Can CL Sell off to Fibonacci Extension? -4,614 Ticks to targetCL Daily time frame is in a down trend. The market
is making lower lows and lower highs. There is a
down Fibonacci with an extension price point 42.38
about -4,614 ticks below the market. As long as the
market does not take out the one boundary price
point 110.93 it is expected the market to fall towards
the Fibonacci target.
Entry: Counter trend line break bearish in the sell zone.
STOP: 113.05
LIMIT: 42.38
Another entry idea: If the risk is too large off the daily
time frame. It will be a good idea to turn to the smaller
time frames and look for selling ideas with less risk.
WTI Crude Oil (CLU2026) — 4HR Update — July 29, 2026
Current Setup
Price bounced at 0.5–0.618 Fib retracement of the recent leg up
4HR hidden bullish divergence confirmed — price forming HL while RSI forming LL, with Stoch RSI oversold. Primed for a bounce which I didnt find an entry for a short term trade.
Divergence supports the B wave bounce thesis — momentum realigning short term
Area of Interest — Short Entry
Primary AOI: potential gap fill zone ~$86–88, confluencing with 0.618–0.786 Fib retracement
Secondary watch: $84 resistance (previous structure level) for early rejection signs
Entry trigger: overbought indicators + rejection price action at either zone
No entry yet — waiting for confirmation at AOI
Bias: Short term bullish bounce (B wave) — medium term bearish watching for C wave down.
Why the Best Mean Reversion Exit May Not Be the MeanMean reversion has fascinated traders for decades because it is built on a simple observation: markets rarely move in straight lines forever. Periods of unusually strong buying or selling are often followed by a move back toward a more balanced price level. That concept has inspired countless trading strategies across futures, equities, currencies, and commodities.
Among the many tools used to identify these statistical extremes, Bollinger Bands® remain one of the most recognized. They expand and contract with volatility, creating dynamic envelopes around price that can highlight when a market has moved significantly away from its average.
Yet one of the biggest misconceptions about mean reversion trading is that a touch—or even a pierce—of a Bollinger Band automatically creates a trading opportunity. In reality, markets can remain stretched much longer than many traders expect.
This is where confirmation becomes important.
In this article, we'll explore a hypothetical case study using WTI Crude Oil Futures. The focus isn't on predicting where prices will go next. Instead, it's about examining how Bollinger Bands® and the Commodity Channel Index (CCI) can work together to identify potential mean reversion setups—and more importantly, why the exit chosen for those trades may deserve even more attention than the entry itself.
Understanding Mean Reversion
At its core, mean reversion assumes that unusually extended price moves may eventually migrate back toward a more typical trading level.
One of the simplest ways to visualize this behavior is with Bollinger Bands®.
The indicator surrounds a moving average with upper and lower bands that adjust according to recent market volatility. As volatility expands, the bands widen. As volatility contracts, they narrow.
When price trades beyond either band, it suggests that the market has reached a statistically unusual level relative to recent price action.
However, "unusual" does not necessarily mean "ready to reverse."
Strong trends can continue producing multiple Bollinger Band piercings before any meaningful reversal develops. This is one reason why experienced traders often avoid treating Bollinger Band touches as standalone trading signals.
Instead, they frequently seek additional confirmation before considering a potential mean reversion opportunity.
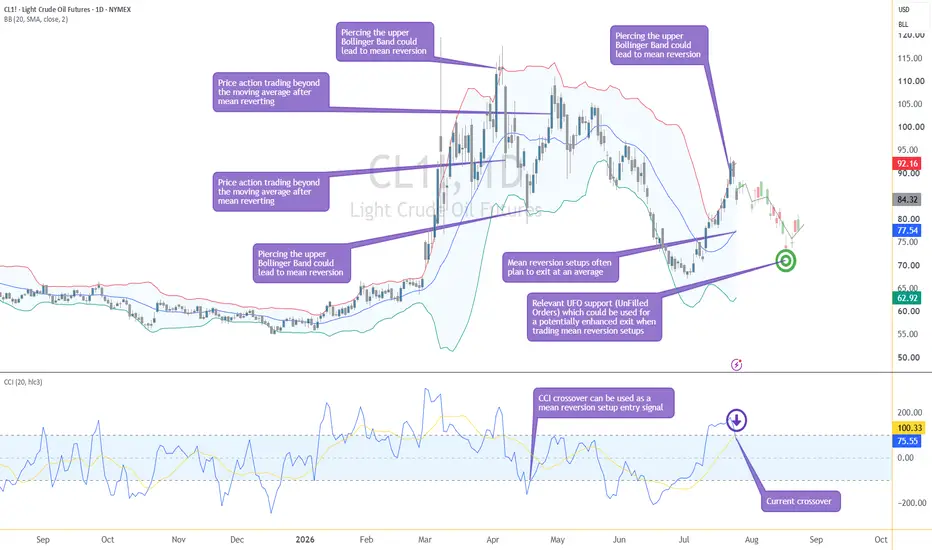
The accompanying chart illustrates several historical examples where price pierced both the upper and lower Bollinger Bands® before eventually reverting toward its average. It also shows that these reversions rarely occur immediately, reinforcing the importance of combining volatility analysis with another confirmation tool.
Adding Confirmation with the Commodity Channel Index
One possible confirmation tool is the Commodity Channel Index (CCI).
Although CCI was originally introduced to identify cyclical behavior in commodity markets, it has become a versatile momentum indicator used across many asset classes.
Rather than focusing solely on price extremes, CCI measures how far price has deviated from its recent statistical average.
In a mean reversion framework, the sequence becomes more important than either indicator individually.
For example:
Price first pierces the upper Bollinger Band, indicating a statistically stretched move.
Instead of entering immediately, the trader waits for CCI to cross downward from overbought territory.
That crossover suggests bullish momentum may be beginning to weaken, potentially supporting a mean reversion scenario.
Likewise, for a potential long setup:
Price pierces the lower Bollinger Band.
CCI later crosses upward from oversold territory.
The crossover may indicate that downside momentum is beginning to fade.
This additional confirmation cannot eliminate false signals.
Markets are probabilistic by nature.
However, waiting for momentum confirmation may help filter some of the premature entries that often occur when traders react solely to Bollinger Band piercings.
The current chart presents a timely educational example.
After trading beyond the upper Bollinger Band, CCI has recently produced a bearish crossover from overbought territory. From a purely educational perspective, this sequence illustrates how multiple technical tools can align to define a hypothetical mean reversion setup. Whether such a setup ultimately succeeds or fails is less important than understanding the analytical process behind it.
The Lesson Most Traders Miss
Entries receive most of the attention.
Books, courses, and online discussions frequently revolve around finding the perfect signal.
But trade management begins long before the entry.
One of the most overlooked questions in mean reversion trading is remarkably simple:
Where should the trade end?
Traditionally, the answer has been straightforward.
If price is reverting toward its average, then the moving average naturally becomes the target.
That logic is understandable.
After all, the moving average represents the statistical center of recent price activity.
Yet markets often display behavior that is far more nuanced.
A successful mean reversion does not necessarily stop exactly at the moving average.
Very often, price continues beyond that average before eventually finding meaningful support or resistance elsewhere.
This observation shifts the discussion from identifying a statistical mean to identifying where the market may actually complete its reversion.
That distinction can significantly influence trade planning.
Looking Beyond the Mean
The chart accompanying this article provides an interesting illustration.
The Bollinger Bands® identify an extended move.
The CCI crossover offers momentum confirmation.
If a trader were managing a traditional mean reversion setup, the moving average—currently located near the 77+ area—would likely become the initial objective.
There is nothing inherently wrong with that approach.
In fact, many successful mean reversion strategies have relied on this methodology for years.
However, another feature on the chart deserves attention.
Below the moving average lies a significant UFO support level near 73.16.
This represents an area where market structure may become particularly relevant.
Historically, markets often do not reverse with mathematical precision.
Instead, they frequently overshoot.
They may trade through moving averages before eventually finding stronger structural support or resistance.
From an educational perspective, this raises an interesting question.
If market structure suggests that price has room to continue beyond its statistical average, should the moving average automatically remain the preferred exit?
Or should traders consider whether additional structural analysis could produce a more efficient objective?
There is no universal answer.
Every methodology has advantages and limitations.
The important lesson is that exit selection deserves the same analytical effort as entry selection.
Rather than viewing the moving average as the mandatory destination, traders may benefit from asking whether the broader market structure supports extending—or in other situations shortening—the original objective.
How Exit Planning Changes Reward-to-Risk
Perhaps the most interesting aspect of this discussion is that nothing about the entry changes.
The Bollinger Band pierce remains the same.
The CCI confirmation remains the same.
The protective stop may remain identical.
Only the exit changes.
Yet changing only one component of the trade can meaningfully alter its overall reward-to-risk characteristics.
If the moving average represents the objective, the potential reward is one value.
If broader market structure supports extending the objective toward a deeper support level, the potential reward becomes larger while the initial risk may remain unchanged.
Naturally, larger objectives may also require greater patience and may be achieved less frequently.
This illustrates why trade management involves balancing probability against potential reward.
Neither approach is inherently superior.
Instead, each reflects a different philosophy regarding how markets complete mean reversion.
The key takeaway is not that every trade should ignore the moving average.
Rather, it is that traders should avoid assuming the moving average is automatically the optimal destination.
Sometimes it may be.
Sometimes market structure may suggest otherwise.
Educational Case Study: CL (WTI Crude Oil Futures)
The current chart provides a useful hypothetical example using CL (WTI Crude Oil Futures).
Price recently traded above the upper Bollinger Band, indicating a statistically extended move.
Subsequently, CCI crossed downward from overbought territory, creating a momentum confirmation consistent with a potential bearish mean reversion framework.
Again, this should not be interpreted as a directional call.
Instead, it serves as a practical example for discussing trade construction.
A traditional approach might define the moving average as the exit objective.
However, the chart also identifies a notable UFO support level near 73.16, located below that average.
If future price action were to continue beyond the moving average before encountering stronger structural support, an exit based solely on the average might leave additional price movement unexplored.
Whether that additional movement ultimately occurs is unknowable in advance.
The educational point is simply that structural analysis can complement statistical analysis when defining potential objectives.
The same methodology can also be applied using MCL (Micro WTI Crude Oil Futures).
Because the micro contract represents a fraction of the standard contract size, it allows traders to study and implement identical analytical techniques while adjusting position sizing according to their own risk parameters.
Illustrative Trade Structure
The following represents a purely hypothetical educational case study designed to demonstrate trade planning concepts.
Illustrative instrument
CL (WTI Crude Oil Futures)
MCL (Micro WTI Crude Oil Futures)
Illustrative entry condition
Price pierces the upper Bollinger Band.
CCI subsequently crosses downward from overbought territory.
Illustrative protective stop
Above the recent swing high that invalidates the mean reversion premise.
Traditional objective
The Bollinger Band moving average.
Alternative objective
Structural support represented by the UFO level near 73.16.
The purpose of this comparison is not to suggest that either objective is more likely to be achieved.
Rather, it demonstrates how different exit methodologies can produce different reward-to-risk characteristics while using the exact same entry criteria.
Contract Specifications
CL (WTI Crude Oil Futures)
Contract size: 1,000 barrels of crude oil
Minimum price fluctuation (tick): 0.01 per barrel = $10.00 per contract
Margin requirements (vary over time according to exchange and brokerage risk policies): ~$8,500 per contract.
MCL (Micro WTI Crude Oil Futures)
Contract size: 100 barrels of crude oil
Minimum price fluctuation (tick): 0.01 per barrel = $1.00 per contract
Margin requirements (vary over time according to exchange and brokerage risk policies): ~$850 per contract.
Although both contracts follow the same underlying market, the micro contract allows traders to scale exposure more precisely while applying the same analytical framework.
Risk Management Remains the Foundation
Every mean reversion strategy will encounter losing trades.
Some Bollinger Band piercings evolve into sustained trends.
Some CCI crossovers fail.
Some reversals begin only to reverse again shortly afterward.
No indicator eliminates uncertainty.
For that reason, risk management remains considerably more important than indicator selection.
Before considering any trade, traders should define:
Entry conditions.
Protective stop placement.
Position size.
Exit methodology.
Acceptable reward-to-risk profile.
Planning each of these components before entering a position helps reduce emotional decision-making while encouraging consistency across different market environments.
Final Thoughts
Mean reversion is often presented as a discussion about entries.
Yet this case study highlights a different perspective.
Bollinger Bands® can help identify statistical extremes.
CCI may provide additional momentum confirmation before considering a potential entry.
But perhaps the greatest opportunity for refinement lies elsewhere.
Rather than automatically assuming the moving average represents the ideal destination, traders may benefit from examining whether broader market structure offers a more efficient objective.
Sometimes it will.
Sometimes it won't.
Either way, treating exit selection as an analytical decision rather than an automatic assumption can encourage more thoughtful trade planning and may meaningfully influence the overall reward-to-risk characteristics of a trading strategy.
Data Consideration
When charting futures, the data provided could be delayed. Traders working with the ticker symbols discussed in this idea may prefer to use CME Group real-time data plan on TradingView: www.tradingview.com - This consideration is particularly important for shorter-term traders, whereas it may be less critical for those focused on longer-term trading strategies.
General Disclaimer
The trade ideas presented herein are solely for illustrative purposes forming a part of a case study intended to demonstrate key principles in risk management within the context of the specific market scenarios discussed. These ideas are not to be interpreted as investment recommendations or financial advice. They do not endorse or promote any specific trading strategies, financial products, or services. The information provided is based on data believed to be reliable; however, its accuracy or completeness cannot be guaranteed. Trading in financial markets involves risks, including the potential loss of principal. Each individual should conduct their own research and consult with professional financial advisors before making any investment decisions. The author or publisher of this content bears no responsibility for any actions taken based on the information provided or for any resultant financial or other losses.
Oil still respects the analyzed direction. See what changed:WTI went from $92 to $79 to $81 in four days. The Fibonacci structure held through all of it. What the levels mean right now — and what happens next.
A week ago WTI was at $92.19. Highest since early June. Houthi attacks on Saudi tankers, Iran threatening to close Bab al-Mandeb, war premium fully loaded into the price. Then the US-Iran ceasefire pause happened over the weekend and oil dropped nearly 15% in three days — from $92 to $79. That's the entire recent rally, gone.
This morning Iran launched a surprise ballistic missile attack on US forces in the Middle East. Oil is back at $81 and climbing. This is a market that moves 10% on a single headline, in either direction, with no warning.
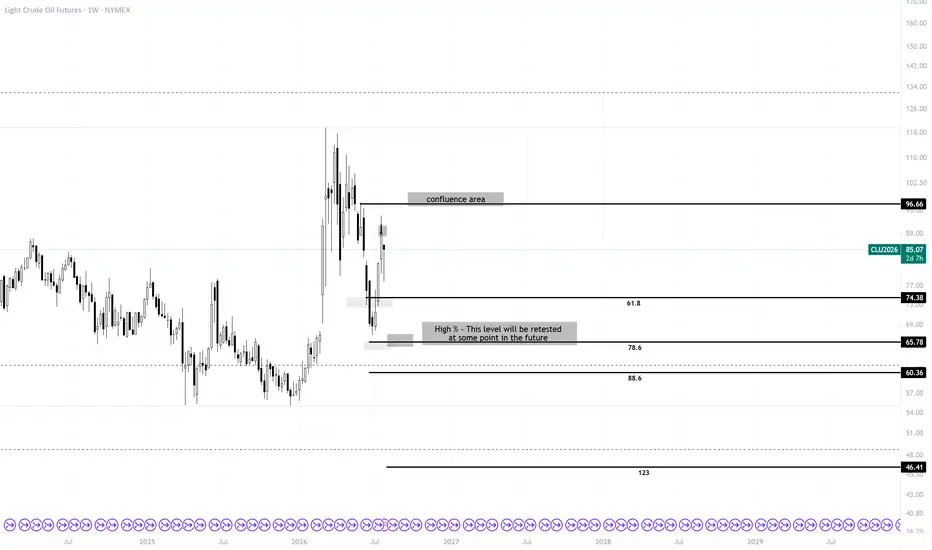
The ceiling is $96.66. That's the prior structural high from early June, before the Iran ceasefire deal triggered the collapse. It's where the concentrated supply of sellers sits — people who were long from before and want out at cost, plus anyone who's been short since the March $119 spike and sees $96 as the next reload zone. Getting above $96.66 requires either a confirmed Hormuz closure or the kind of direct Saudi infrastructure hit that takes meaningful barrel count off the market. We're not there yet, but it's one escalation headline away.
3.3 million barrels. Physical market is tight independent of the geopolitics. That's not fear premium, that's real supply.
This matters because it separates the two components of the current price. There's the geopolitical premium — which can evaporate in 48 hours — and there's the underlying physical tightness, which doesn't. Even if Iran ceasefire holds tomorrow, the API draw and below-average inventory levels mean oil probably doesn't fall as hard as the pure-geopolitics trade would imply. The $74 level holds with more conviction when the physical market has real support under it.
The FOMC decision is today. Warsh's tone has been hawkish, and markets are pricing a 35% probability of a rate hike. A hike strengthens the dollar, which mechanically pressures oil. If that hits simultaneously with any ceasefire progress, the double-whammy toward $74.38 becomes a realistic intraday move. Conversely, if the Fed holds and Iran escalates further, the path toward $96.66 opens again — fast.
That's the honest map of this market right now. $96.66 above, $74.38 below, and a single geopolitical dial that determines which way you go. Iran rejected Oman's proposal for 50/50 Hormuz control and wants full control of the strait. This is not resolving quietly.
We track these levels in real time across crude and the broader futures complex. If the next move matters to your book, this is the kind of structure you want to know before the headline drops.
What is YMagnify?
We publish structured confluence analysis on ES1!, crude oil, and macro-driven assets, tracking levels from entry through resolution across multiple timeframes.
If this series has been useful, consider following us. Institutional and individual traders both use our level maps, because good structure doesn't care about account size.
Check disclaimers*
Crude loses 89.50; 85.50 is the recovery testCL1! lost the rising 89.50 trend stop with a fast repricing into the 84.50–85.25 volume area. Chasing the first flush offers poor location, so I am neutral while price builds acceptance here. A sustained reclaim of 85.50 would favor a rebound toward 86.50 and 87.50. Failure below 84.20 would keep the breakdown active and expose 83.00–82.50. Invalidation for the bearish continuation case is an hourly close back above 86.00. Educational analysis only.
THE OIL ! Job 12:8 — "Or speak to the earth, and it shall teach thee: and the fishes of the sea shall declare unto thee."
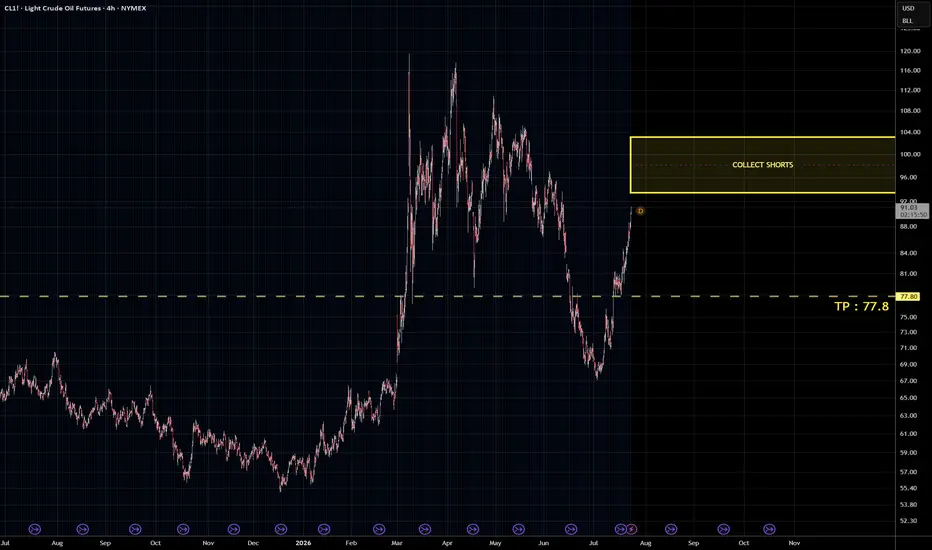
CL — the crude from the deep earth. Gathered at two stations: 93.4 and 96.6.
The patient layeth traps in rising waters.
Option upon option ascending to 103 — the trap door widens.
But 77.8 is written. The descent is certain.
The earth teacheth the humble. The fish of the sea declare it.
From 103 to 77.8 — the judgment is sealed.
CL1! Analysis Confirmation - weeks of predictions + new rangesThe Fibonacci grid did its job.
The 61.8% level at $74.38 was the first pause on the way down.
The 78.6% zone near $65.78 was the real floor.
Price found it, turned, and has rallied 37% in three weeks.
But here's the thing: this is almost entirely a geopolitical trade.
Every dollar of this rally represents fear about supply disruption, not genuine demand growth.
The IEA was still projecting a 3.7 million bpd global surplus heading into July.
The fundamentals below the geopolitical layer haven't changed dramatically.
That means $96.66 is the critical test. If price breaks above it with real volume and no ceasefire signal, the $100 level is in play and the RBC worst-case scenario becomes a real conversation.
If we get any diplomatic development — even a rumour — this move unwinds toward $74 fast.
Respect the level. Don't chase the spike.
🟢 Bull Case
Target: $96.66 → $100+
Houthi-Bab al-Mandeb blockade expands. Bab al-Mandeb + Hormuz both disrupted = full choke on global oil routing. RBC Capital Markets flagging potential Brent $128–146 in worst-case regional war scenario. $96.66 breaks → $100 mental level is next test.
🔴 Bear Case
Target: $74.38 retest
Any credible ceasefire or MOU revival strips the war premium fast. This entire rally (from $67 → $92) was built on geopolitical fear. Remove the fear, remove the move. Gasoline at $4.09/gal creates political pressure on Trump to de-escalate.
OIL: Bound to Push Higher!Primary Scenario
In the near term, Brent and WTI futures are expected to continue moving higher as part of the broader corrective uptrend, ultimately breaking above resistance at $119.50 (Brent) and $119.48 (WTI). After these tops are reached, we anticipate significant sell-offs in both contracts, targeting our blue Long-Term Entry Ranges (Brent: $42.33–$29.90 / WTI: $49.85–$27.93), where the ongoing larger corrections should eventually conclude.
Alternative Scenario
Alternatively, Brent and WTI futures could break below support at $58.40 (Brent) and $54.98 (WTI) sooner, forming early correction lows within our blue Long-Term Entry Ranges (Brent: $42.33–$29.90 / WTI: $49.85–$27.93) (probability: 40%).
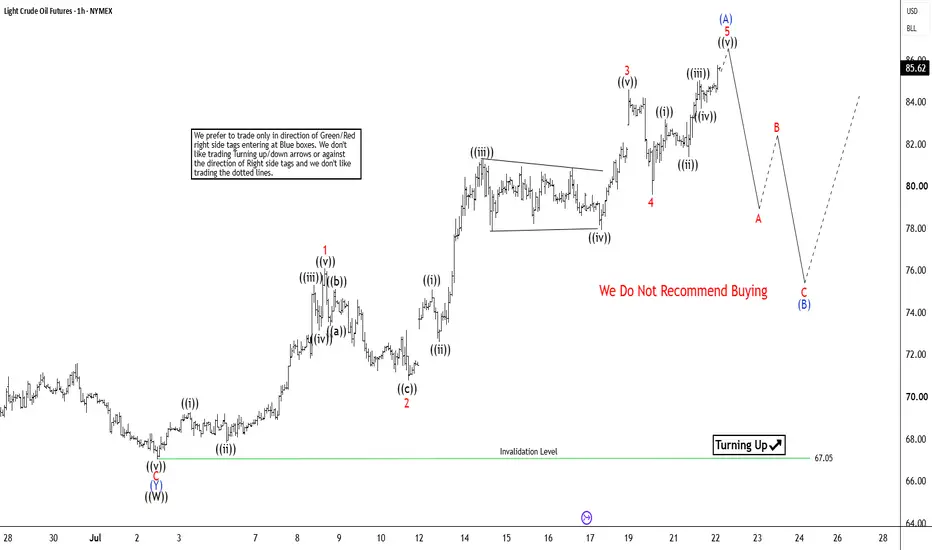
WTI Crude Oil (CL) 5‑Swing Rally from July Low Favors ExtensionThe short-term Elliott Wave outlook in WTI Crude Oil (CL) presents a well-defined impulsive rally from the July 2, 2026 low, with prospects for continued strength. From that low, wave 1 advanced to $76.08, followed by a corrective decline in wave 2 that ended at $70.77. The market then surged in wave 3, reaching $85.39, before retracing in wave 4, which concluded at $80.27. The final leg, wave 5, is now unfolding and is expected to complete shortly. This completion will mark the end of wave (A) in higher degree.
Once the five-wave rally is complete, a larger corrective phase in wave (B) should emerge. This correction will retrace the cycle that began from the July 2 low, allowing the market to consolidate gains before resuming its broader upward trajectory. As long as the pivot at $67.05, established on July 2, remains intact, pullbacks are likely to attract buyers. These retracements should occur in either three or seven swings, reinforcing the bullish outlook for further upside.
The completed five-wave structure from the July 2 low strongly favors at least one more leg higher. This extension is expected to unfold within wave (C) or wave (3), both of which imply continuation of the impulsive sequence. With the technical framework pointing toward additional gains, the near-term outlook remains constructive, and the market appears poised for further upward momentum.
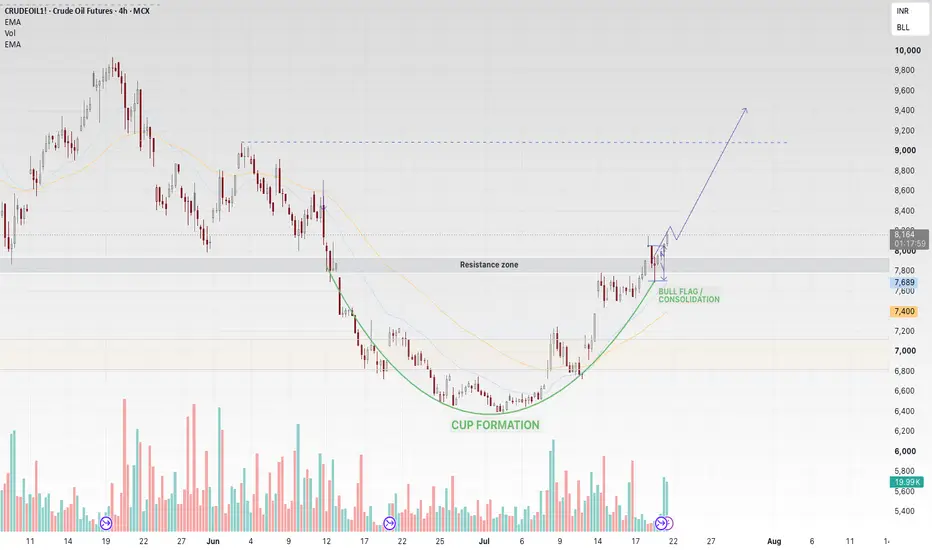
CRUDEOIL1! — Technical Structure Analysis📈 CRUDEOIL1! — Technical Structure Analysis
Chart Visual & Pattern Layout: ChartsSpecialist (via TradingView)
🔍 Technical Observations
Rounding Bottom / Cup Structure: The chart illustrates a multi-week curved recovery formation (rounding bottom), representing a gradual shift from a sustained sell-off to persistent buying pressure.
Horizontal Supply Ceiling: Dual horizontal red lines annotated as "Major Resistance" outline a key overhead supply barrier, marking previous structural swing high levels.
Compression Below Resistance: Price action has rallied back up to directly test this major horizontal resistance zone, with candle bodies compressing right beneath the supply overhead.
📚 Technical Analysis Concepts Demonstrated
Rounding Bottom Patterns: Observing long-term u-shaped consolidation structures that highlight underlying trend reversals.
Testing Major Horizontal Resistance: Analyzing price reaction, volatility, and volume behavior as price approaches multi-month peak supply zones.
Market Structure & Curve Formations: Visualizing gradual accumulation dynamics across extended timeframes.
📌 SEBI Compliant Educational Disclaimer
Regulatory Disclaimer & Disclosures:
Educational Purpose Only: This post analyzes chart patterns and technical concepts strictly for learning and educational purposes.
No Recommendation: This content does NOT contain target levels, stop-loss triggers, entry calls, or buy/sell/hold recommendations.
SEBI Registration Status: ChartsSpecialist and the publisher are NOT SEBI-registered Research Analysts or Investment Advisors.
Risk Warning: Securities and commodities trading involves market risk. Past patterns do not guarantee future price movements. Please consult a qualified financial advisor before taking any market positions.
#ChartsSpecialist #CrudeOil #Commodities #TechnicalAnalysis #ChartReading #StockMarketEducation #SEBICompliant #PriceAction #TradingView #FinancialLiteracy #RoundingBottom #SupportAndResistance
CRUDE OIL: Cup & Handle Breakout Loading | Resistance AbsorptionCrude Oil has completed a textbook Cup & Handle structure after reversing from the 6,400 demand zone.
Price is now testing a critical supply area around 8,000–8,150 where short-term profit booking is expected.
The broader market structure remains bullish with a clear sequence of higher highs and higher lows.
Recent consolidation beneath resistance suggests absorption rather than rejection, increasing the probability of an upside breakout.
Key Levels
🟢 Breakout Trigger: 8000
🟢 Retest Support: 7850–7950
As long as buyers defend the breakout zone, Crude Oil remains a buy-on-dips market.
#CrudeOil #MCXCrudeOil #CommodityTrading #PriceAction #TradingView #CupAndHandle #MarketStructure #TechnicalAnalysis #FuturesTrading #MCX #TrendFollowing
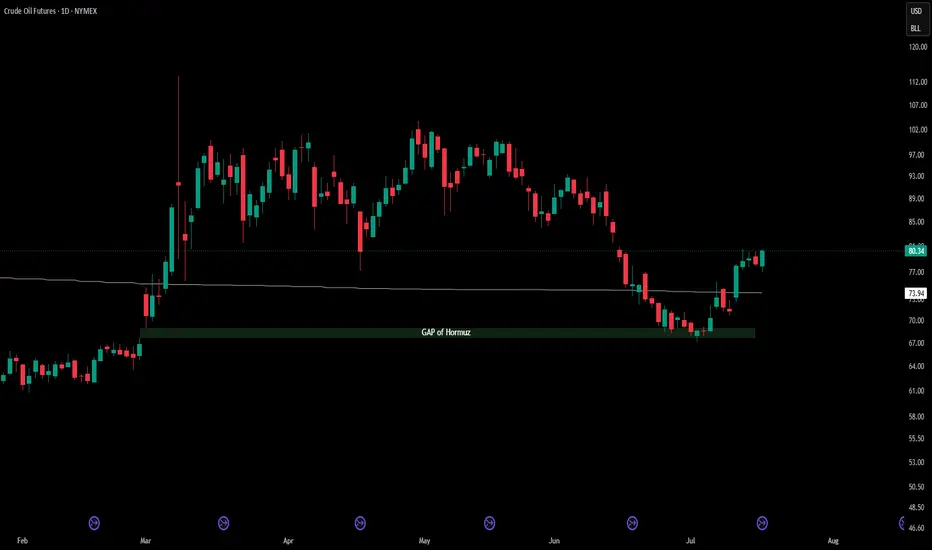
Crude Oil (WTI) | Buyers Are Defending a Critical Monthly ZoneAfter several months of selling pressure, WTI Crude Oil has finally reached an area where higher time frame buyers are beginning to react. While many traders remain focused on the recent bearish momentum, I believe the current technical picture deserves much closer attention.
On the monthly chart, price is testing a confluence of institutional factors:
Major Monthly Demand Zone
Unfilled Monthly Gap
Rising long-term trendline support
Previous breakout area now acting as support
This combination creates a high-interest zone where a medium-term reversal could develop.
Technical Perspective
Although the broader trend remains corrective, I don't see an attractive location to initiate fresh shorts after such an extended decline.
Instead, I'm watching whether buyers can continue defending the 68–74 USD area.
The first key obstacle sits around 84–85 USD.
A confirmed monthly close above this level would significantly improve the bullish structure and could open the path toward:
92 USD
100 USD
105 USD
COT Report
The latest Commitment of Traders report suggests a relatively neutral positioning.
Non-Commercial traders have reduced both long and short exposure, while Commercial participants remain net short, which is fairly typical for the crude oil market.
Open Interest has declined by more than 30,000 contracts, indicating that recent price action has been driven more by position liquidation than aggressive institutional accumulation.
In my opinion, the COT data is not yet confirming a strong bullish trend, but it also doesn't support the continuation of an aggressive bearish move.
Seasonality
Seasonality provides another interesting piece of the puzzle.
Historically, July has not been one of the strongest months for crude oil, with most long-term datasets showing either flat or slightly negative average performance.
This suggests that even if my long-term bullish thesis remains valid, price could still experience short-term volatility or another retracement before a larger directional move develops.
My Trading Plan
At this stage I'm monitoring two possible scenarios.
Scenario 1 (Preferred)
Price extends higher into the 84–85 USD resistance before retracing back toward 74–76 USD, where I would look for fresh buying opportunities if price confirms institutional demand.
Scenario 2
If buyers manage to reclaim and close decisively above 84–85 USD, I will assume that the correction has already ended and begin looking for continuation opportunities toward the next higher-time-frame liquidity targets.
Key Levels
🟢 Support
68–70 USD
72–74 USD
🔴 Resistance
84–85 USD
92 USD
100 USD
105 USD
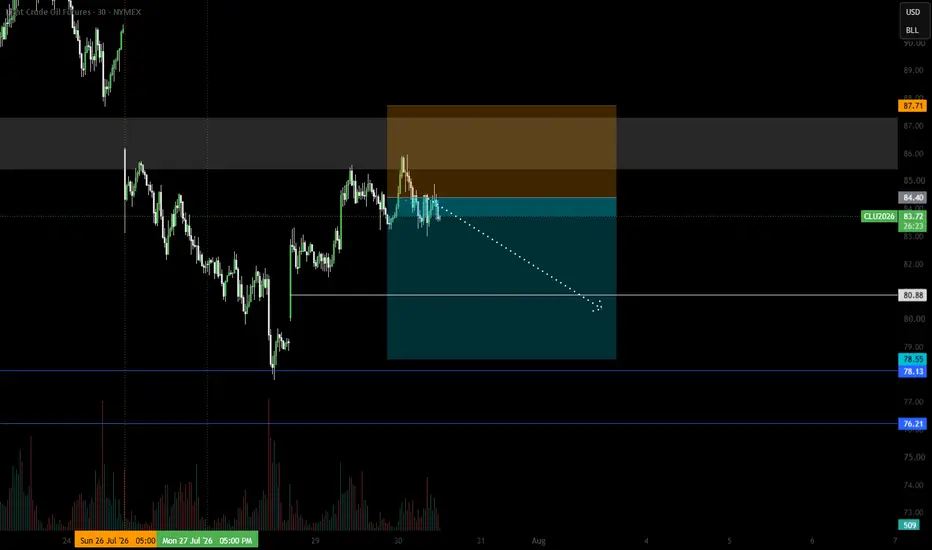
CRUDE OIL Short
CRUDE OIL SELL MARKET ORDER : 84.40
Stop Loss: 87.71
Remove risk/Partials @ : 80.88
Take profit: 78.55
Trade Plan: Short
Bias: BEARISH short term.
Entry reason: Price has tested key POI area.
Fundamentally: The short-term valuation tool also shows temporarily overvalued against the competing index
Stop Loss: Above nearest high.
First target: 80.88
Please refer to WTI for CFDs symbols
Oil Respected The Area - It Bounced Back. WHAT NOW?My update on OIL
My previous analysis is found on my profile here.
Oil bounced back in the mentioned area. Let me explain.
WTI peaked at $92.19 on July 24 — highest since early June, driven by Houthi attacks on Saudi tankers and the threat of a Bab al-Mandeb blockade. Then the US paused strikes on Iran over the weekend. Oil dropped nearly 15% in three days to around $79. Then Iran launched a surprise ballistic missile attack on US forces in Iraq. Oil bounced back to $83.
Every one of those moves tracked the Fibonacci grid on this chart. The structure mapped the exact zones where the market found buyers and sellers each time.
This market has two components running simultaneously and they pull in different directions. The geopolitical premium — which evaporates on any ceasefire headline — and genuine physical tightness that has nothing to do with Iran. The API draw of 3.3M barrels and below-average seasonal inventory levels mean the floor at $74.38 is structural, not just technical. That distinction matters when you're sizing exposure around news events.
Escalation scenario
Iran-Jordan clash spreads. Hormuz disruption confirmed. Houthi attacks on Saudi Eastern Province succeed. RBC worst-case: Brent $128–146. $96.66 breaks on intraday gap.
De-escalation scenario
Doha talks produce a framework agreement. Hormuz fully reopens. War premium unwinds. IEA 3.7M bpd surplus projection comes back into focus. Physical tightness slows the fall at $74.
Life + Follow here YMagnify if you find this useful for your financial plan.
Always check disclaimers.
WHO is YMagnify?
We publish level-by-level analysis on crude oil, $ES1 and core futures markets — tracking structures from entry through resolution in real time.
If the $74–$96 range holds, you'll see it here before it moves. Hit Follow to stay on the map.
CRUDE OIL |Major Channel Resistance in Focus,Bearish Bias IntactCRUDE OIL ANALYSIS
Price has rallied sharply into a major descending channel resistance, a zone that has repeatedly triggered selling pressure in the past.
Bearish view remains valid as long as the channel resistance holds.
A sustained move below 8,500 could accelerate the downside towards:
Target 1: 8,000
Target 2: 7,800
Invalidation: If price manages to break and sustain above the channel resistance, the bearish outlook will no longer remain valid.
Expected Reversal Zone: 9,300 – 9,500
Trade with proper risk management.
crude crucial update mcx or spotcrude mcx as per chart showing bull move still if sustain above 8820 than next up side 8900--9000-9120+++++ where support 8500 closing base .
spot oil eyes on 90$ if sustain above than next up side move 91--93$ soon support find 87$ on closing base --- still looks buy on dips with tight sl as support consider
Crude Oil MCX Fut Intraday Technical Analysis 23 July, 26MCX:CRUDEOIL1!
Crude Oil Futures (MCX) | Intraday Structure | July 23, 2026
Crude Oil is trading around 8,412, hovering directly above the 8,410 Zero Line. The contract has experienced a volatile corrective phase following its sharp rally toward the 8,570 peak, now compressing inside its central value block as market participants seek a clear directional catalyst.
Price enters the session locked tight around its primary benchmark. Buyers are defending the immediate support cluster to maintain structural continuity toward higher expansion targets, while bears are attempting to push price below the Zero Line to unlock deeper liquidation legs. Wait for a high-volume 15-minute candle breakout before committing capital.
Bullish Triggers
Long Entry: Above 8,441 (strongly validated while price holds structural footing above the 8,400 Add Long Pos. band).
Targets: 8,629 - 8,765
Risk Control: Structure weakens below 8,400. Hard exit below 8,323.
Bearish Triggers
Short Entry: Below 8,358 (validated if liquidity pushes fail to hold the 8,410 Zero Line, converting it into a firm distribution ceiling).
Targets: 8,191 - 8,055
Risk Control: Cover immediately above 8,476. Day Bias remains structurally protected above 8,222.
No-Trade Chop Zone: 8,323 - 8,441
Expect rotational, choppy price action inside this decision block as commercial participants balance risk. Avoid over-trading early whipsaws inside this zone; let a clean 15-minute structural candle breakout provide true execution validation.
Execution Rule: Structure first, confirmation next. Zero anticipation.
Hit Boost and drop your view in the comments if you're tracking these levels today.
#CrudeOil