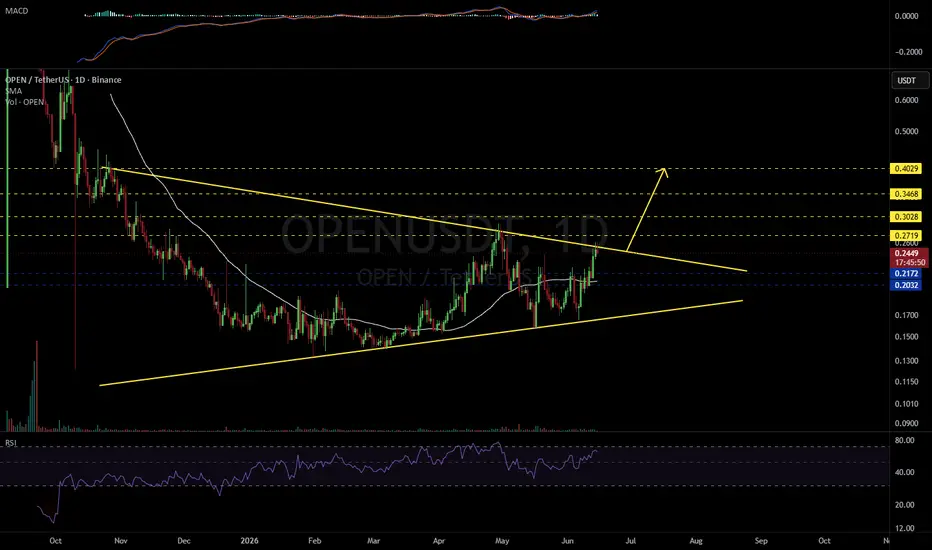
OPENUSDT 1D#OPEN is currently trading within a triangle pattern on the daily chart.
Consider accumulating a small position at current levels and near the following support zones:
📍 $0.2172
📍 $0.2032
In case of a breakout above the triangle resistance, the following upside targets could come into play:
🎯 $0.2719
🎯 $0.3028
🎯 $0.3468
🎯 $0.4029
⚠️ Always remember to use a tight stop-loss and maintain proper risk management.
In-depth trading ideas
OPENUSDT Forming Bullish MomentumOPENUSDT is forming a clear bullish momentum pattern, a classic bullish wave signal that often indicates an upcoming breakout. The price has been consolidating within a narrowing range, suggesting that selling pressure is weakening while buyers are beginning to regain control. With consistent volume confirming accumulation at lower levels, the setup hints at a potential bullish breakout soon. The projected move could lead to an impressive gain of around 90% to 100% once the price breaks above the key resistance zone.
This bullish momentum pattern is typically seen at the end of downtrends or corrective phases, and it represents a potential shift in market sentiment from bearish to bullish. Traders closely watching OPENUSDT are noting the strengthening momentum as it nears a breakout zone. The strong trading volume adds confidence to this setup, showing that market participants are positioning early in anticipation of a potential reversal.
Investors’ growing interest in OPENUSDT reflects increasing confidence in the project's long-term fundamentals and current technical strength. If the breakout confirms with sustained volume, this could mark the beginning of a fresh bullish leg. Traders may find this an attractive setup for medium-term gains, especially as the pattern matures and buying momentum continues to accelerate.
The combination of improving market structure, rising accumulation, and strengthening momentum makes OPENUSDT a coin worth watching closely in the coming sessions. A successful breakout could unlock significant upside potential and attract further buying interest from both traders and investors.
✅ Show your support by hitting the like button!
✅ Leave a comment below! (What is your opinion about this coin?)
Your feedback and engagement keep me inspired to share more insightful market analysis with you!
OPENUSDT Forming Bullish MomentumOPENUSDT is forming a clear bullish momentum pattern, a classic bullish wave signal that often indicates an upcoming breakout. The price has been consolidating within a tightening range, suggesting that selling pressure is gradually weakening while buyers are beginning to regain control. With steady volume supporting accumulation at lower levels, the setup points toward a potential bullish breakout in the near future. The projected move could lead to an impressive gain of around 90% to 100% once the price successfully breaks above its key resistance zone.
This bullish momentum pattern is commonly observed near the end of downtrends or corrective phases, often signaling a shift in market sentiment from bearish to bullish. Traders closely watching OPENUSDT are noticing strengthening momentum as the asset approaches a critical breakout area. Healthy trading volume adds confidence to the setup, indicating that market participants may already be positioning themselves ahead of a possible trend reversal.
Growing interest in OPENUSDT reflects increasing confidence in the project's long-term potential and current technical structure. If the breakout is confirmed with strong and sustained volume, it could mark the beginning of a fresh bullish leg. Traders may find this an attractive opportunity for medium-term gains, especially as momentum continues to build and buying pressure accelerates.
✅ Show your support by hitting the like button!
✅ Leave a comment below! (What is your opinion about this coin?)
Your feedback and engagement keep me inspired to share more insightful market analysis with you! 🚀📈
OpenLedger (OPENUSDT): Classic Higher Low Retrace & 1,000% PPHere we have the classic retrace followed by a higher low.
OPENUSDT. It all started with the rounded bottom and consolidation period. The first move is the initial bullish breakout and after some bullish action there is always a retrace. This retrace ending in a higher low is what confirms a bullish market bias and also a bullish continuation/resumption.
OPENUSDT is ending this higher low process based on the candles and volume and this can lead to the development of a new advance. This advance would be the third wave of a bullish impulse which translates into a very strong higher high compared to the last high. The third wave tends to be the strongest move within an impulse. This wave can extend for weeks or months.
Naturally, after another bullish move what follows is a correction and after this correction additional growth.
The targets and growth potential has been easily depicted on the chart. The first and easy target at $1.07 yields more than 475%. The second target at $1.65 can do 780% and finally $2.22 with more than 1,000%.
We are seeing projects grow easily 100-300% within 1-2 weeks. Some in just the first few days of bullish action. This is only the start and this is happening while the market is quiet, shy and down. Imagine how much more the market can grow when bullish momentum becomes obvious. That's the second and third targets on this chart.
While everything might be slow today, things can change in a flash. Change can become obvious in a day but the build up process has been happening for months. In this case, OPENUSDT has been sideways since December 2025, more than five months—no new lows. This can support a massive bullish wave, one that can easily reach 500-1000%.
This is what comes next.
Thank you for reading.
Namaste.
OPENSDT Forming Bullish MomentumOPENUSDT is forming a clear bullish momentum pattern, a classic bullish continuation signal that often points toward a strong breakout in the near future. The price has been consolidating within a tightening range, suggesting that selling pressure is gradually weakening while buyers continue to regain control around key support levels. This type of setup is commonly associated with accumulation phases before a major bullish move begins.
The projected breakout from this bullish momentum structure could lead to an impressive gain of around 90% to 100% if the price confirms above the resistance zone with strong volume support. This pattern is frequently observed after corrective phases and may signal a transition from bearish sentiment into a fresh bullish trend.
Traders closely watching OPENUSDT are noticing strengthening momentum as the price approaches a critical breakout area. The consistent trading volume adds confidence to the setup, showing that buyers may already be accumulating positions in anticipation of a bullish continuation move.
Growing investor interest in OPENUSDT reflects increasing confidence in both its technical structure and long-term upside potential. If the breakout confirms with sustained buying pressure and strong follow-through momentum, this could mark the beginning of a powerful bullish wave.
✅ Show your support by hitting the like button and
✅ Leaving a comment below! (What is your opinion about this coin?)
Your feedback and engagement keep me inspired to share more insightful market analysis with you!
OPENUSDT Forming Bullish WaveOPENUSDT is currently forming a clear bullish wave pattern, a classic structure that often signals an upcoming breakout. The price has been consolidating within a narrowing range, indicating that selling pressure is gradually weakening while buyers are beginning to regain control. With consistent volume supporting accumulation at lower levels, the setup suggests a potential bullish breakout in the near term.
If the price breaks above the wedge resistance, the projected move could be moderate yet promising, with a potential gain of around 20% to 30%. This type of bullish wave pattern is typically seen at the end of downtrends or corrective phases, signaling a possible shift in market sentiment from bearish to bullish.
Traders closely monitoring OPENUSDT are noticing strengthening momentum as it approaches a key breakout zone. The presence of solid trading volume adds confidence to this setup, indicating that market participants may be positioning early in anticipation of a reversal.
Growing investor interest in OPENUSDT reflects rising confidence in its technical structure and overall potential. If the breakout is confirmed with strong and sustained volume, it could mark the beginning of a fresh bullish leg. This setup may offer a valuable opportunity for medium-term traders as momentum builds and the pattern completes.
✅ Show your support by hitting the like button
✅ Leave a comment below (What is your opinion about this coin?)
Your feedback and engagement keep me motivated to share more insightful market analysis with you!
#OPEN/USDT Bulls are back on $OPEN#OPEN
The price is moving in a descending channel on the 1-hour timeframe. It has reached the lower boundary and is heading towards breaking above it, with a retest of the upper boundary expected.
We have a downtrend on the RSI indicator, which has reached near the lower boundary, and an upward rebound is expected.
There is a key support zone in green at 0.2207. The price has bounced from this zone multiple times and is expected to bounce again.
We have a trend towards consolidation above the 100-period moving average, as we are moving close to it, which supports the upward move.
Entry price: 0.2300
First target: 0.2361
Second target: 0.2432
Third target: 0.2530
Don't forget a simple principle: money management.
Place your stop-loss order below the support zone in green.
For any questions, please leave a comment.
Thank you.
OpenLedger (OPEN) can grow 1,000% mid-term —Hyper-bullishOpenLedger (OPENUSDT) has huge growth potential. The black line on the chart marks the October 2025 low. Below this line OPENUSDT produced a rounded bottom and the action is now back above it, signaling the start of a new market phase.
1,000% is only a portion of what is possible on this trading pair/Cryptocurrency project. I am not showing the full range of targets. It seems everything is about to speed up.
As prices drop volume also drops. Late last month we see a big volume bar as the October low gets challenged as resistance. This same level was challenged dozens of times making it very important. The bulls are now in. Easy to see.
This is a nice chart, very straight forward. We can agree as to what comes next. OpenLedger is set to grow but it will not do so alone, it grows together with the rest of the market.
Thank you for reading.
Namaste.
OPEN/USDT — bullish structure, but resistance is closeOPEN is holding a constructive 4H structure after reclaiming the 0.1743 zone and pushing back into the upper part of the range.
At the moment, price is trading near 0.1829, which keeps the bullish idea valid, but also puts the market close to local resistance. That means the setup still favors upside, yet execution matters more here than blind chasing.
Trade plan
• Entry zone: 0.18090 – 0.18272
• Stop: 0.17449
• Targets: 0.19808 / 0.20595
What supports the setup
• bullish bias remains dominant
• higher probability still favors continuation upward
• 0.1743 acts as the key support area that keeps structure intact
• if price holds above the entry zone, continuation toward 0.1980 stays in play
What needs attention
The chart already shows a strong push, so entering too high without confirmation can weaken the RR.
If price loses 0.1743, the bullish structure becomes questionable and the setup loses quality.
Conclusion
Bias remains bullish, but this is a structured continuation setup, not a breakout chase.
As long as support holds, bulls keep the advantage. First objective is 0.1981, then 0.2059 if momentum expands.
Structured plan, not a prediction.
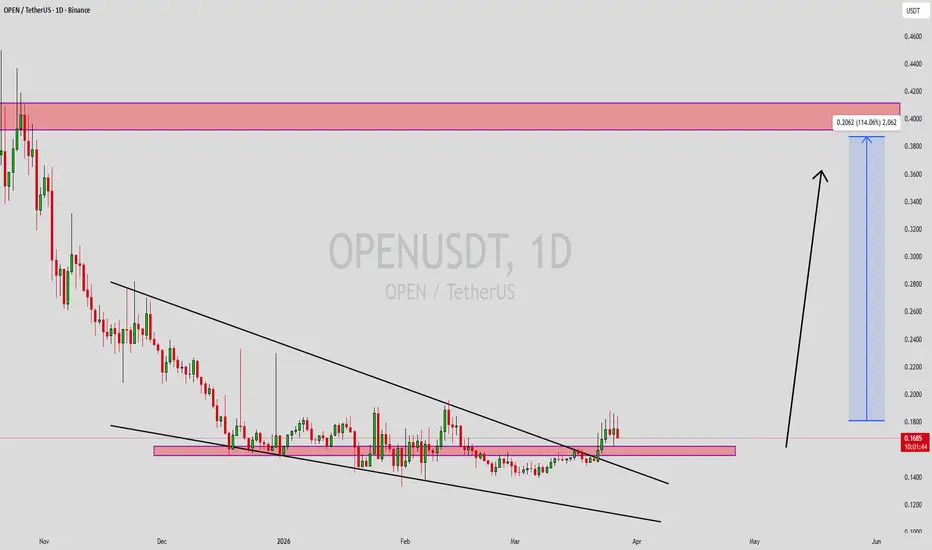
OPENUSDT Forming Bullish MomentumOPENUSDT is forming a clear bullish momentum pattern, a classic bullish reversal signal that often indicates an upcoming breakout. The price has been consolidating within a narrowing range, suggesting that selling pressure is weakening while buyers are beginning to regain control. With consistent volume confirming accumulation at lower levels, the setup hints at a potential bullish breakout soon. The projected move could lead to an impressive gain of around 90% to 100% once the price breaks above the wedge resistance.
This bullish momentum pattern is typically seen at the end of downtrends or corrective phases, and it represents a potential shift in market sentiment from bearish to bullish. Traders closely watching OPENUSDT are noting the strengthening momentum as it nears a breakout zone. The good trading volume adds confidence to this pattern, showing that market participants are positioning early in anticipation of a reversal.
Investors’ growing interest in OPENUSDT reflects rising confidence in the project’s long-term fundamentals and current technical strength. If the breakout confirms with sustained volume, this could mark the start of a fresh bullish leg. Traders might find this a valuable setup for medium-term gains, especially as the pattern completes and buying momentum accelerates.
✅ Show your support by hitting the like button and
✅ Leaving a comment below! (What is your opinion about this Coin?)
Your feedback and engagement keep me inspired to share more insightful market analysis with you!
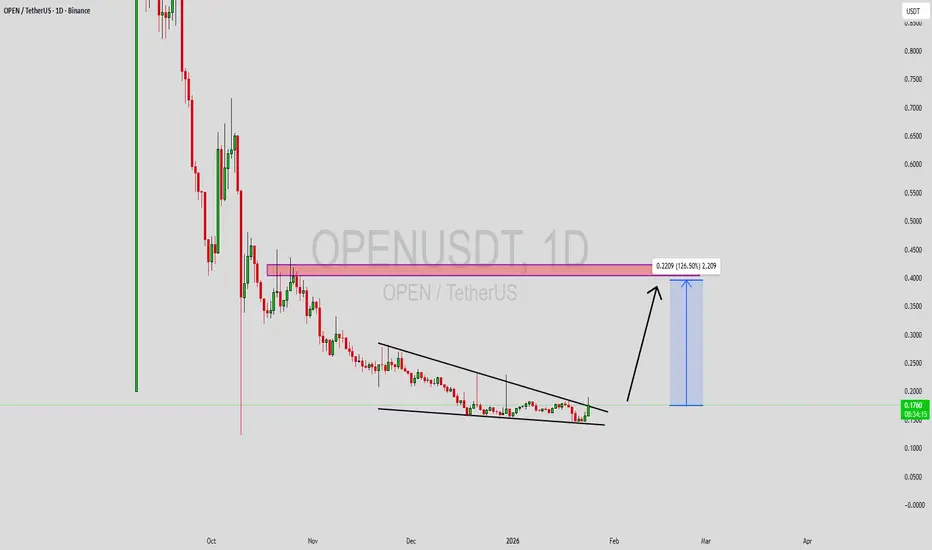
OPENUSDT UPDATE
Pattern: Falling Wedge Breakout
Current Price: $0.1765
Target Price: $0.245
Target % Gain: 40%
Technical Analysis: OPEN is breaking out of a daily falling wedge pattern after consolidating near $0.14–$0.18. The breakout above the wedge resistance with rising bullish candles suggests strong upside potential. Volume confirms buying interest, making this setup valid for a continuation move.
OPENUSDT Forming Falling WedgeOPENUSDT is forming a clear falling wedge pattern, a classic bullish reversal signal that often indicates an upcoming breakout. The price has been consolidating within a narrowing range, suggesting that selling pressure is weakening while buyers are beginning to regain control. With consistent volume confirming accumulation at lower levels, the setup hints at a potential bullish breakout soon. The projected move could lead to an impressive gain of around 90% to 100% once the price breaks above the wedge resistance.
This falling wedge pattern is typically seen at the end of downtrends or corrective phases, and it represents a potential shift in market sentiment from bearish to bullish. Traders closely watching OPENUSDT are noting the strengthening momentum as it nears a breakout zone. The good trading volume adds confidence to this pattern, showing that market participants are positioning early in anticipation of a reversal.
Investors’ growing interest in OPENUSDT reflects rising confidence in the project’s long-term fundamentals and current technical strength. If the breakout confirms with sustained volume, this could mark the start of a fresh bullish leg. Traders might find this a valuable setup for medium-term gains, especially as the wedge pattern completes and buying momentum accelerates.
✅ Show your support by hitting the like button and
✅ Leaving a comment below! (What is your opinion about this Coin?)
Your feedback and engagement keep me inspired to share more insightful market analysis with you!
OPENUSDT Forming Bullish MomentumOPENUSDT is forming a clear bullish momentum pattern, a classic bullish reversal signal that often indicates an upcoming breakout. The price has been consolidating within a narrowing range, suggesting that selling pressure is weakening while buyers are beginning to regain control. With consistent volume confirming accumulation at lower levels, the setup hints at a potential bullish breakout soon. The projected move could lead to an impressive gain of around 90% to 100% once the price breaks above the wedge resistance.
This bullish momentum pattern is typically seen at the end of downtrends or corrective phases, and it represents a potential shift in market sentiment from bearish to bullish. Traders closely watching OPENUSDT are noting the strengthening momentum as it nears a breakout zone. The good trading volume adds confidence to this pattern, showing that market participants are positioning early in anticipation of a reversal.
Investors’ growing interest in OPENUSDT reflects rising confidence in the project’s long-term fundamentals and current technical strength. If the breakout confirms with sustained volume, this could mark the start of a fresh bullish leg. Traders might find this a valuable setup for medium-term gains, especially as the pattern completes and buying momentum accelerates.
✅ Show your support by hitting the like button and
✅ Leaving a comment below! (What is your opinion about this Coin?)
Your feedback and engagement keep me inspired to share more insightful market analysis with you!
OPENUSDT Forming Bullish ReversalOPENUSDT is forming a clear bullish reversal pattern, a classic bullish reversal signal that often indicates an upcoming breakout. The price has been consolidating within a narrowing range after the earlier decline, suggesting that selling pressure is gradually weakening while buyers are quietly stepping in to regain control. With consistent volume confirming accumulation at these lower levels, the setup is lining up for a potential bullish breakout in the near future. If the price breaks decisively above the wedge resistance, the projected move could deliver an impressive gain of around 90% to 100% from the breakout point.
This falling wedge pattern is typically seen at the end of downtrends or during corrective phases, and it serves as a strong indication that market sentiment may be shifting from bearish to bullish. Traders closely watching OPENUSDT are seeing a similar strengthening momentum as it approaches its own breakout zone. The healthy trading volume supporting the pattern adds solid confidence, showing that market participants are positioning early in anticipation of a reversal.
The rising interest in OPENUSDT is driven by growing optimism about the project’s long-term fundamentals combined with this promising technical structure. A confirmed breakout backed by sustained volume could signal the start of a fresh bullish leg. Traders might view this as an attractive setup for medium-term gains, especially once the wedge pattern fully completes and buying momentum begins to accelerate.
✅ Show your support by hitting the like button and
✅ Leaving a comment below! (What is your opinion about this Coin)
Your feedback and engagement keep me inspired to share more insightful market analysis with you!
OPENUSDT 1D#OPEN has seen a strong increase in volume and attempted to break above the falling wedge resistance. The first attempt was rejected by the daily EMA50. However, the structure remains bullish, and a breakout above the wedge is expected soon. If a breakout occurs, the potential upside targets are:
🎯 $0.1797
🎯 $0.2022
🎯 $0.2205
🎯 $0.2387
🎯 $0.2646
🎯 $0.2977
❌ Invalidation: a daily candle close below the wedge.
⚠️ Always apply tight stop-losses and maintain strict risk management.
OPENUSDT Forming Falling WedgeOPENUSDT is showing a strong falling wedge pattern, one of the most powerful bullish reversal signals in technical analysis. This pattern forms when price action compresses between two downward-sloping trendlines, indicating decreasing selling pressure and a potential shift in market sentiment. The pair’s good trading volume adds strength to this setup, suggesting that accumulation is underway and that a major breakout could be close. Once price breaks above the wedge resistance with confirmation, OPENUSDT could experience a powerful upward surge.
Currently, technical indicators such as RSI and MACD are hinting at bullish divergence, supporting the case for a significant rebound. The falling wedge typically resolves with an explosive upside move, and in this case, the expected gain of 390% to 400% highlights the strong upside potential. Such a massive projection points to increased investor confidence and renewed interest in the project’s fundamentals and long-term vision.
Market participants are beginning to recognize OPENUSDT as a high-upside opportunity within the current market cycle. Growing investor interest often precedes major rallies, especially when the technical structure is this favorable. If buying momentum continues to build and volume supports the breakout, this could lead to a new trend reversal, pushing the price toward fresh highs and attracting more traders into the move.
✅ Show your support by hitting the like button and
✅ Leaving a comment below! (What is You opinion about this Coin)
Your feedback and engagement keep me inspired to share more insightful market analysis with you!
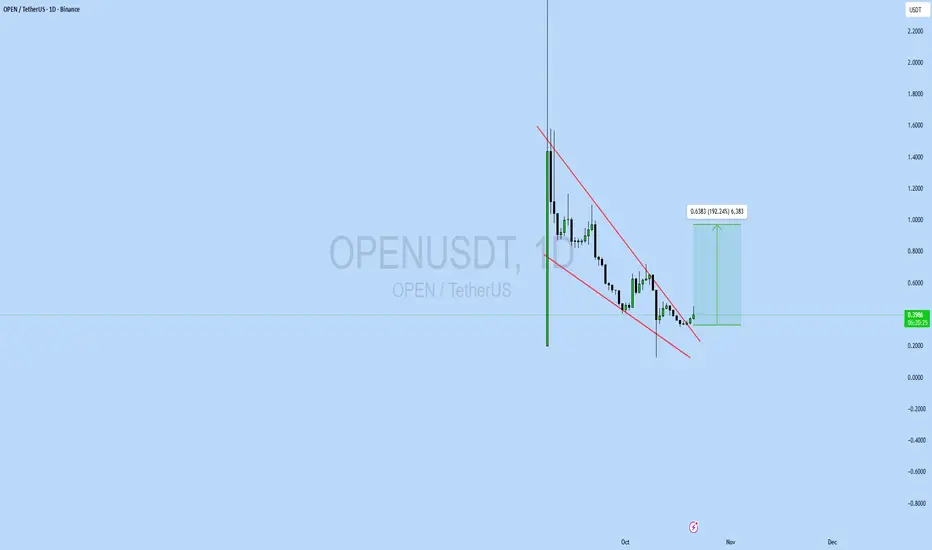
OPENUSDT UPDATE#OPEN
UPDATE
OPEN Technical Setup
Pattern: Bullish falling wedge breakout
Current Price: $0.399
Target Price: $0.638
Target % Gain: 192.24%
NASDAQ:OPEN is breaking out of a falling wedge pattern on the 1D timeframe. With the current price at $0.399, the projected target is $0.638 — indicating a potential upside of nearly 192%. This breakout suggests a possible shift in momentum favoring bulls and a move toward higher levels.
Time Frame: 1D
Risk Management Tip: Always use proper risk management.
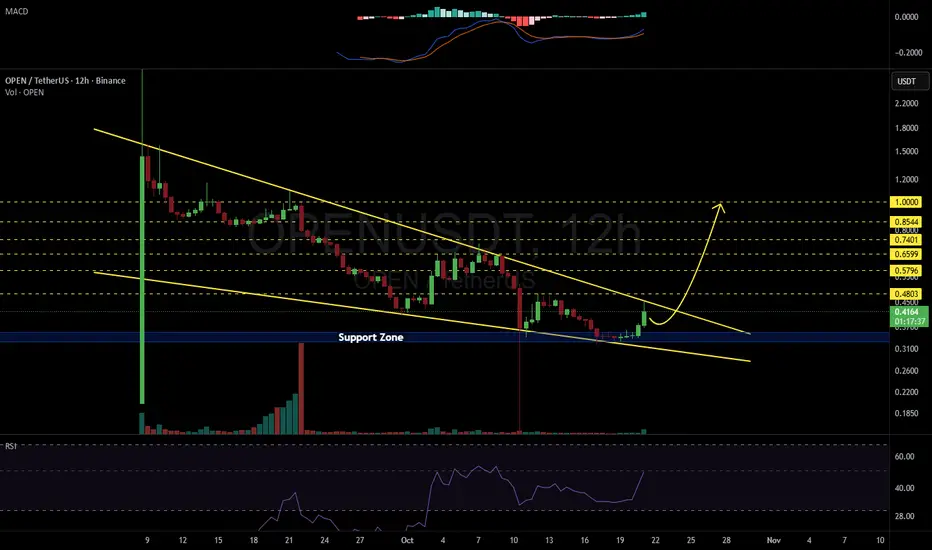
OPENUSDT 12H#OPEN is heading to $1? 🚀
#OPEN has formed a falling wedge pattern on the 12H timeframe chart. Consider buying here and near the support zone. In case of a breakout above the wedge resistance, the potential targets are:
🎯 $0.4803
🎯 $0.5796
🎯 $0.6599
🎯 $0.7401
🎯 $0.8544
🎯 $1.0000
⚠️ Always remember to use a tight stop-loss and maintain proper risk management.
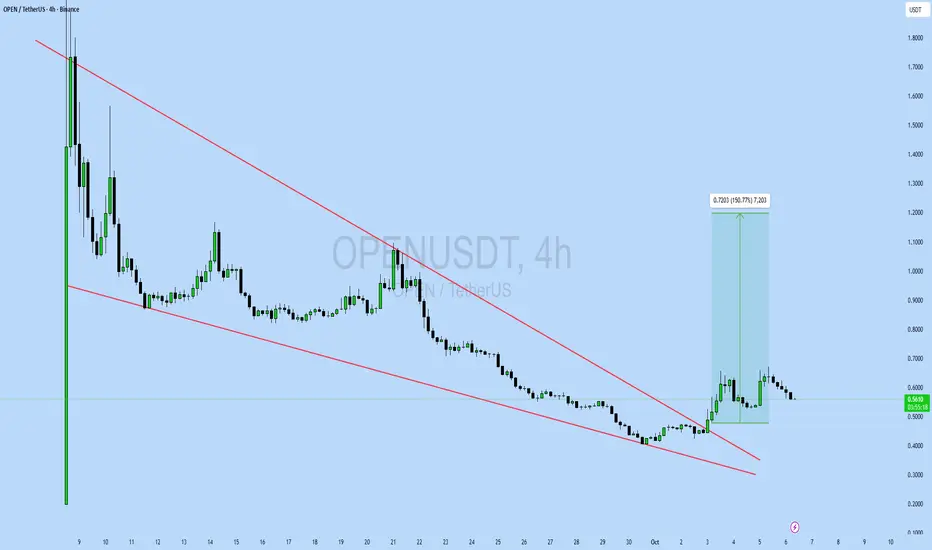
OPENUSDT UPDATE#OPEN
UPDATE
OPEN Technical Setup
Pattern: Bullish falling wedge pattern
Current Price: $0.5617
Target Price: $1.28
Target % Gain: 150.77%
NASDAQ:OPEN is breaking out of a falling wedge pattern on the 4H timeframe. Current price is $0.5617 with a target near $1.28, indicating around 150% potential upside. The breakout highlights strong bullish momentum with price structure supporting continuation. Always use proper risk management.
Time Frame: 4H
Risk Management Tip: Always use proper risk management.
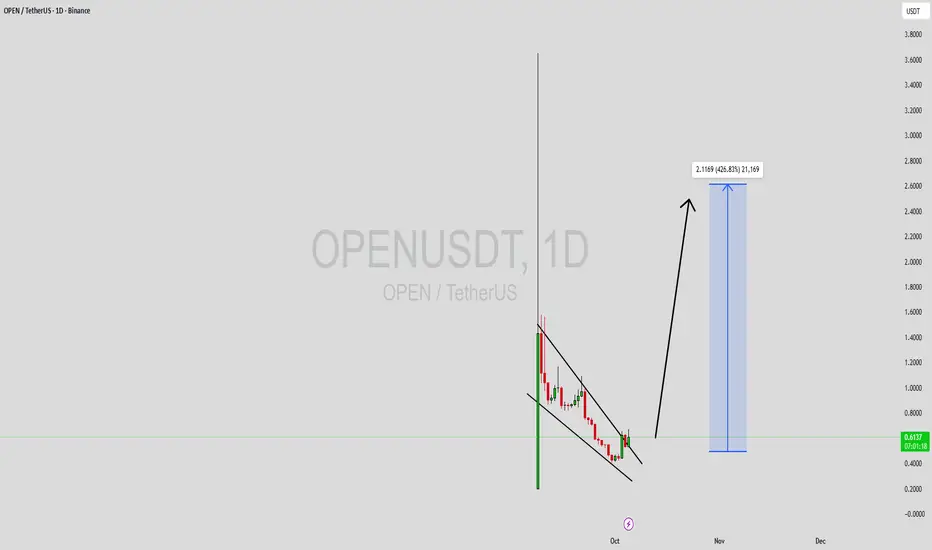
OPENUSDT Forming Falling WedgeOPENUSDT is currently forming a strong falling wedge pattern on the daily chart, a setup that often indicates a major bullish reversal. After an extended downtrend, the narrowing price action within the wedge shows that selling pressure is fading and accumulation is taking place. This structure, combined with healthy volume activity, suggests that a breakout to the upside could soon trigger a significant price movement. The chart’s tightening range reflects growing investor anticipation and an imminent volatility expansion.
The technical outlook points to a potential gain of around 390% to 400%+ once the breakout is confirmed. Such a strong upside target highlights the strength of this bullish setup and aligns with historical wedge breakout behavior in altcoins with rising interest. Increasing volume adds to the confidence, implying strong participation from both retail and institutional traders preparing for a possible surge.
OPENUSDT is starting to attract attention across the market due to its technical alignment with bullish reversal patterns. As investor sentiment shifts from cautious to optimistic, this pair could emerge as one of the high-performing assets in the coming weeks. Traders should watch closely for confirmation candles above resistance to validate the breakout and sustain the bullish trend.
✅ Show your support by hitting the like button and
✅ Leaving a comment below! (What is You opinion about this Coin)
Your feedback and engagement keep me inspired to share more insightful market analysis with you!