DAX This signal produced the strongest corrections since 2009.DAX (DE40) closed a green month and is about to test the 1-year Higher Highs trend-line. At the same time, its 1W RSI remains under the bearish pressure of a 1-year Lower Highs trend-line, which is a technical Bearish Divergence.
Every time a similar pattern emerged within its 17-year Channel Up since the 2009 U.S. Housing Crisis, DAX corrected aggressively by at least -24.35%. If we have a strong red 1M September candle next, there are high probabilities to get the same Sell Signal.
If repeated, a new -24.35% decline would test at least the 1M MA50 (blue trend-line) at 20500, which has been intact since November 2022. Notice also that the 1W MA100 (green trend-line) has also been holding for many years (more specifically since January 2023) and held during the March 2026 pull-back. It can be used as an additional bearish confirmation signal if broken.
---
** Please LIKE 👍, FOLLOW ✅, SHARE 🙌 and COMMENT ✍ if you enjoy this idea! Also share your ideas and charts in the comments section below! This is best way to keep it relevant, support us, keep the content here free and allow the idea to reach as many people as possible. **
---
💸💸💸💸💸💸
👇 👇 👇 👇 👇 👇
In-depth trading ideas
Bullish momentum to extend?DAX40 (DE40) has bounced off the pivot and could potentially rise toward the 1st resistance, a pullback resistance.
Pivot: 24,651.40
1st Support: 23,799.30
1st Resistance: 25,910.50
Disclaimer:
The opinions given above constitute general market commentary and do not constitute the opinion or advice of IC Markets or any form of personal or investment advice.
Any opinions, news, research, analyses, prices, other information, or links to third-party sites contained on this website are provided on an "as-is" basis, are intended to be informative only, and are not advice, a recommendation, research, a record of our trading prices, an offer of, or solicitation for, a transaction in any financial instrument and thus should not be treated as such. The information provided does not involve any specific investment objectives, financial situation, or needs of any specific person who may receive it. Please be aware that past performance is not a reliable indicator of future performance and/or results. Past performance or forward-looking scenarios based upon the reasonable beliefs of the third-party provider are not a guarantee of future performance. Actual results may differ materially from those anticipated in forward-looking or past performance statements. IC Markets makes no representation or warranty and assumes no liability as to the accuracy or completeness of the information provided, nor any loss arising from any investment based on a recommendation, forecast, or any information supplied by any third party.
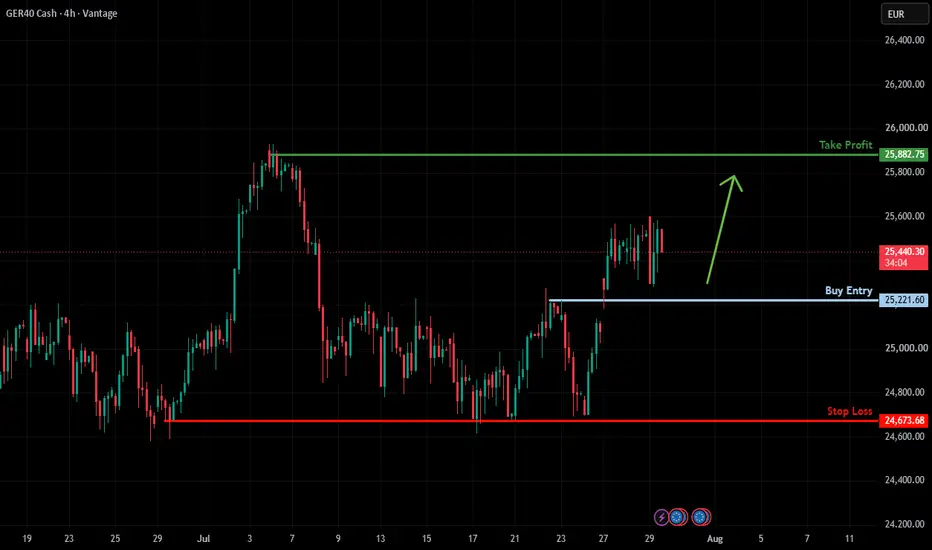
Falling toward pullback support?geR40 is falling toward the support level, which acts as a pullback support and could bounce from this level to our take profit.
Entry: 25,221.60
Why we like it:
There is a pullback support level.
Stop loss: 24,673.68
Why we like it:
There is a pullback support level.
Take profit: 25,882.75
Why we like it:
There is a pullback resistance.
Enjoying your TradingView experience? Review us!
Please be advised that the information presented on TradingView is provided to Vantage (‘Vantage Global Limited’, ‘we’) by a third-party provider (‘Everest Fortune Group’). Please be reminded that you are solely responsible for the trading decisions on your account. There is a very high degree of risk involved in trading. Any information and/or content is intended entirely for research, educational and informational purposes only and does not constitute investment or consultation advice or investment strategy. The information is not tailored to the investment needs of any specific person and therefore does not involve a consideration of any of the investment objectives, financial situation or needs of any viewer that may receive it. Kindly also note that past performance is not a reliable indicator of future results. Actual results may differ materially from those anticipated in forward-looking or past performance statements. We assume no liability as to the accuracy or completeness of any of the information and/or content provided herein and the Company cannot be held responsible for any omission, mistake nor for any loss or damage including without limitation to any loss of profit which may arise from reliance on any information supplied by Everest Fortune Group.
Analysis | GER40 (Germany 40) | 4H Timeframe Analysis | GER40 (Germany 40) | 4H Timeframe
Hello and welcome to all my TradingView friends and followers! 👋📈
I hope you're all having a successful trading week. Today we're looking at the GER40 (DAX 40), Germany's benchmark stock index representing the country's 40 largest publicly traded companies. As Europe's largest economy, Germany often serves as a leading indicator for the broader European equity market. 🇩🇪📊
🌍 Fundamental Outlook
Global markets continue to face elevated levels of geopolitical uncertainty. ⚠️🌍
Ongoing tensions in the Persian Gulf, together with security concerns surrounding the Bab el-Mandeb Strait, remain important macro risks for financial markets. 🚢⛽
Any disruption to these strategic shipping routes could increase transportation costs, pressure global supply chains, and contribute to inflationary risks—all of which may affect European corporate earnings and investor sentiment.
So far, however, equity markets have remained relatively resilient, suggesting that investors are waiting for clearer political and economic signals before making aggressive positioning decisions.
📈 Technical Analysis
From a technical perspective, the overall trend remains bullish. 📈🟢
The rising dynamic support shown on the chart has consistently attracted buyers over recent weeks, helping maintain the bullish market structure.
Price is now testing a major resistance zone, making this one of the most important decision areas on the chart.
🟢 Bullish Scenario
A confirmed breakout above the current resistance, supported by strong momentum and volume, could open the way toward new highs and a continuation of the prevailing uptrend. 🚀
🔴 Bearish Scenario
On the other hand, this resistance may trigger a technical rejection, leading to a pullback toward the rising dynamic support or the nearby support zone.
Such a correction would not necessarily invalidate the broader bullish trend, provided the overall market structure remains intact. 🔄
For now, the technical outlook continues to favor buyers, but traders should remain flexible and prepared for both scenarios.
🗳️ Community Poll
What do you expect next?
🟢 Breakout and continuation toward new highs 🚀
🔴 Rejection from resistance and a corrective pullback 📉
Share your opinion in the comments! 👇
⚠️ Disclaimer
This analysis reflects my personal interpretation of current market conditions based on technical analysis, macroeconomic developments, and publicly available information. It is not financial advice or a recommendation to buy or sell any financial instrument.
Always conduct your own research and apply proper risk management before making trading decisions.
#GER40 #DAX40 #Germany40 #Stocks #EuropeanMarkets #TechnicalAnalysis #FundamentalAnalysis #PriceAction #TradingView #ForexCity #Support #Resistance #Breakout #RiskManagement #Investing #Geopolitics #PersianGulf #BabElMandeb #MarketAnalysis #Europe
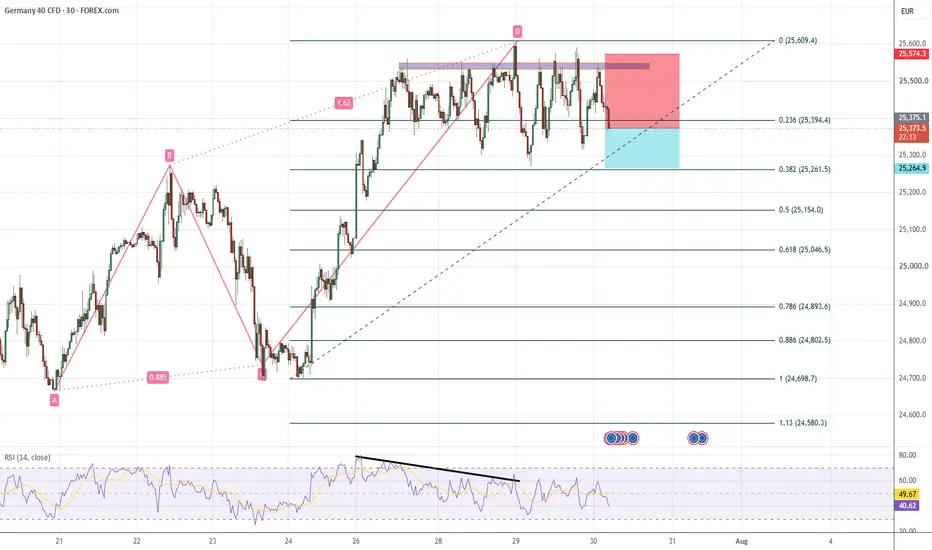
DAX SHORT - TIME TO SHORTTEAM, we been waiting almost all day, time to short the DAX at 25430-25465 rangs
stop loss at 25565
Target 1 at 25396-25382
Target 2 at 25376-25312
Target 3 at 25305-25200
LETS GO 🔥
ACTIVE Signal — Risk First. Profit Second.
Your trade, your responsibility. Please manage your own volume and risk
DAX30/GER30 TIME TO SHORT - DAX MARKET UPDATETeam,
Short Zone: 25520 – 25546
STOP LOSS: 25660
Target 1 at 25496-25472
Target 2 at 25466-25422
Target 3 at 25415-25346
MARKET NOTES
DAX often reacts strongly before major US announcements.
With the US rate decision approaching, volatility will increase.
Please ensure you manage your own entries, exits, and profit targets.
Trade with discipline.
LETS GO
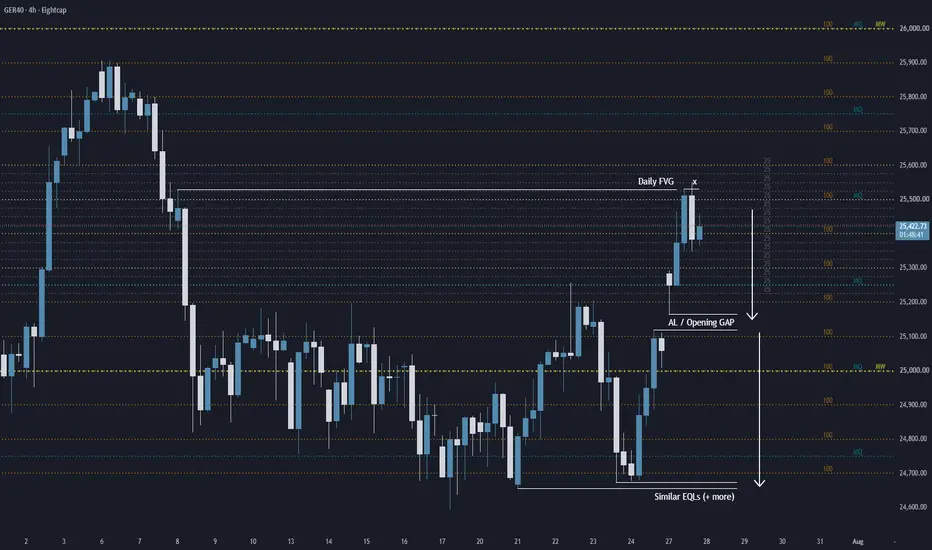
GER40 — Bearish Rebalance & Expansion toward 1.414 TargetGER40 (DAX) has reached a key Point of Interest (POI), while an unfilled imbalance (FVG) remains just above current price levels.
A divergence is currently observed at these levels. I am considering two short scenarios:
📌 Scenario 1 (Current Levels):
If a reversal pattern forms along with a local structural shift (BOS / ChoCH), I will look for a short entry. The Stop Loss will be set above the invalidation point (the adjacent local high).
📌 Scenario 2 (Liquidity Sweep):
If a local setup fails to form and price moves to sweep liquidity above the nearest high (filling the upper FVG), the overall bias remains strictly bearish.
Global Context:
A Key Imbalance has been left open below. I anticipate a full-scale downward expansion and price rebalance toward the 1.414 / 1.618 Fibonacci target levels.
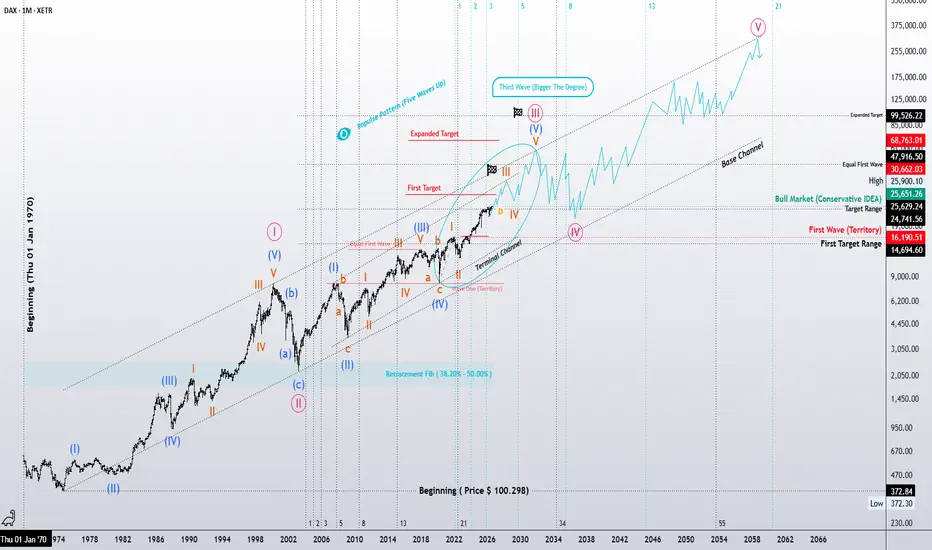
Is a Powerful Third Wave Still Unfolding? | Elliott Wave PerspecDAX 40 | Is a Powerful Third Wave Still Unfolding? | Elliott Wave Perspective
The long-term structure of the DAX 40 continues to align with the characteristics of a developing impulsive trend. If the current wave count remains valid, the market may still be advancing within a higher-degree Wave III, the phase that often carries the strongest momentum of an impulsive cycle.
One of the most interesting aspects of the current structure is the relationship between the lower-degree waves. The near equality between the lower-degree Wave (1) and Wave (3) increases the possibility that Wave (5) of the same degree could become extended. If this scenario unfolds, the market may be approaching the next acceleration phase, with the potential for the internal Wave (5) of (5) to extend as well, providing the final impulsive push within the larger Wave III.
An alternative scenario should also be considered. It is possible that Wave (5) of this lower degree has already begun and that the market is currently developing its internal subdivisions. In that case, the primary focus shifts to whether the final internal Wave (5) evolves into an extended structure, which could significantly influence both the strength and duration of the ongoing advance.
As always, this analysis is based solely on the current Elliott Wave Principle structure, Fibonacci relationships, and price behavior. It reflects a research-based market perspective rather than a prediction. Should the market structure evolve, the wave count and both scenarios will be reassessed accordingly.
A more detailed breakdown of the weekly, daily, and 4-hour structures will be published in the coming days to further evaluate the market's position within this larger cycle.
"Markets don't reveal certainty. They reveal probability through structure."
Mr. Nobody | Elliott Wave Principle 🎧📊
DAX Index
Jul 21, 2022
DAX in correction
Germany 30
Aug 6, 2024
The idea of extending the DAX bull market
German 40 Eyes Bullish Recovery as Sentiment ImprovesGerman 40 is showing signs of renewed buying interest after an extended period of weakness. Improving market sentiment, easing macroeconomic concerns, and stronger risk appetite could support a bullish continuation. If buyers maintain momentum, the index may extend higher in the coming sessions, making the buy side the key focus.
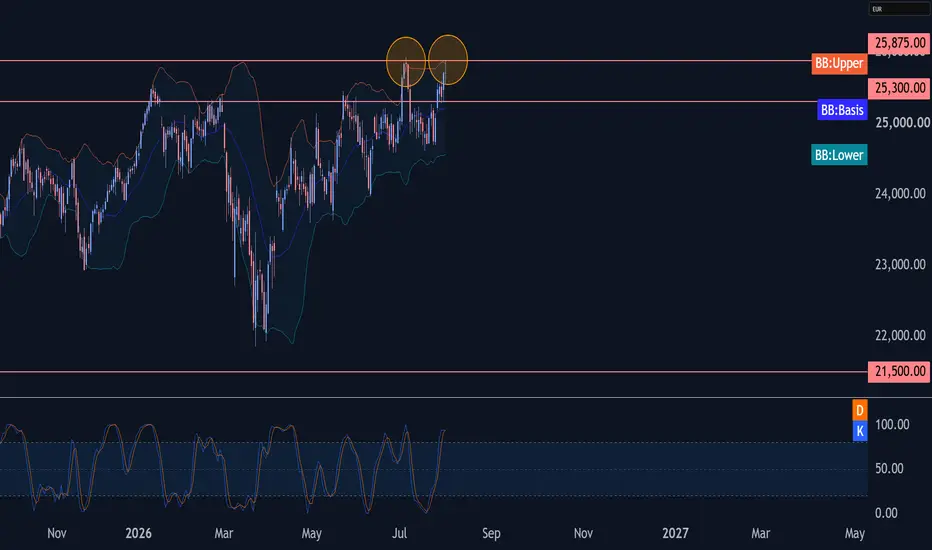
DAX Wave Analysis – 31 July 2026– DAX reversed from resistance level 25875.00
– Likely to fall to support level 25300.00
DAX index today reversed down from the resistance zone between the strong resistance level 25875.00 (which reversed the price at the start of July) and the upper daily Bollinger Band.
The downward reversal from the resistance level 25875.00 is likely to form the daily Japanese candlesticks reversal pattern long-legged Doji.
Given the strength of the resistance level 25875.00 and the overbought daily Stochastic, DAX index can be expected to fall further to the next support level 25300.00.
GER40: Key Imbalance Established | External Expansion Toward 1.4Market Context & Order Flow
On the 1-hour timeframe of the GER40 index (DAX), a clean bullish structure is taking shape. Following a liquidity sweep in the discount zone, price delivered an aggressive impulse, establishing a key imbalance (FVG). This signals institutional buying pressure and a local shift in Order Flow toward overhead liquidity pools.
Technical Highlights:
Imbalance & POI Confluence: The impulsive push confirmed a local Point of Interest (POI). The unfilled inefficiency serves as a strong magnet for price action.
External Fibonacci Expansion: The primary vector targets delivering price to the 1.414 external expansion level, where major sell-side liquidity is concentrated.
Trade Management (Multi-Stage Partial TP):
First Target (75% fix): 25,199.9 (Securing the majority of profits upon clearing local structural liquidity).
Final Target (25% fix): 25,364.2 (Full exit at the 1.414 Fibonacci expansion / premium POI).
Invalidation Level (Stop Loss): 24,536.0 (A close below invalidates the bullish thesis).
🚀 Boost this idea if you agree with the analysis! Share your thoughts in the comments below.
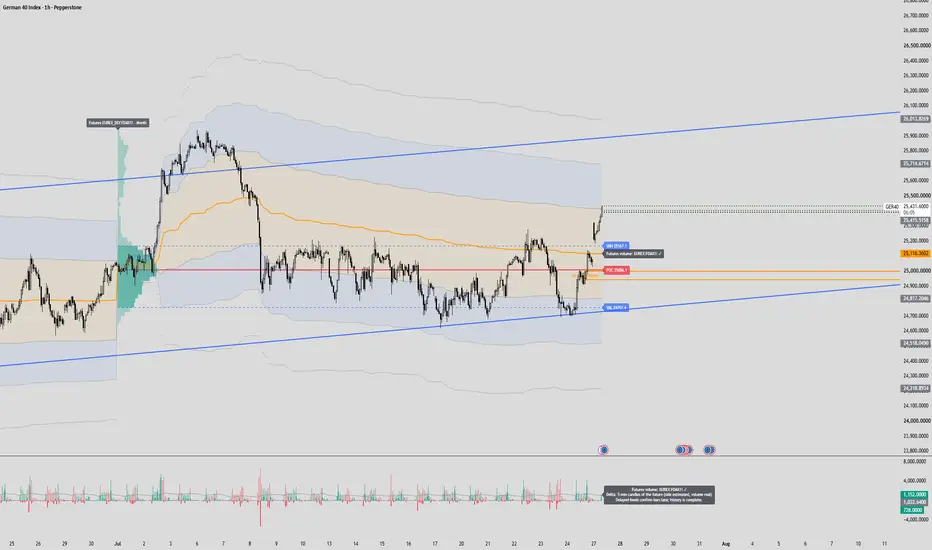
DAX W31 — every reference now sits below priceTHE GAP
Monday opened 215.0 points above Friday's close — 25,290.0 against 25,075.0, plus 0.86%. Since 2013, 15 of 701 weeks opened with a bigger gap.
Last week's frame named four references sitting overhead inside fifty points: a gamma flip, two weekday highs, the monthly VWAP. All four are now 200 to 280 points below price. So is the July value area high, the previous week's high, and the previous month's high. Price at the time of writing is 25,370.6 — 7.8 points above June's high.
Value area high 25,167.1 Point of control 25,006.1 Value area low 24,757.4 Monthly VWAP 25,115.6
Volume for the profile comes from the FDAX contract, not from CFD tick counts, and is mapped onto the price of the chart it is drawn on.
WHAT IS LEFT OVERHEAD
Only the standard deviation ladder and the option walls:
25,414.7 VWAP +1 sigma 25,500.0 second call wall 25,713.9 VWAP +2 sigma 26,000.0 call wall 26,013.1 VWAP +3 sigma
The call wall and the third sigma band are 13 points apart. Two unrelated methods, one number. That is worth recording, not trading.
WHAT IS NOW UNDERNEATH
25,362.8 previous month high 25,278.3 previous week high 25,167.1 value area high 25,115.6 monthly VWAP 25,093.8 gamma flip, 7-45 DTE structure map
Three of those sit inside 73 points. Last week the same kind of band was called a set of shelves rather than walls, and price crossed all of it in one leg. Nothing about this week makes a 73-point band a floor. The dotted lines on that chart are the 0-5 DTE map and the expected-move band around the snapshot spot — day weather, deliberately outside a weekly frame.
The weekly open line on that chart reads 25,320. The 25,290.0 used above is the first bar of the day on the data set the base rate is built from. Same lesson as last week: the convention is part of the number, so it gets named.
The regime reading did change: price above the flip means long gamma, where hedging dampens rather than amplifies. In own backtesting the flip sits above spot on roughly 85% of days, so this is the unusual side of that statistic, not the comfortable one.
THE MEASUREMENT
Weeks that opened at least 0.75% above the previous close, DAX 2013 to date:
The week's low returned to the previous Friday's close in 10 of 22 cases, 45%. Across all 701 weeks that figure is 94%. t = -4.6. A second, independently built daily basis gives 45 of 89, 51%, against 88%. t = -7.1. Both cuts agree: after a gap this size the way back is no longer close to automatic.
Direction is a different story. Week closed above Monday's open in 16 of 22 on the first basis, 73%, against a 57% base rate — t = +1.7. On the second basis it is 46 of 89, 52%, against 55% — t = -0.6. The two cuts contradict each other and neither is significant. So the gap says something about the way back and nothing about the way forward. Sentiment stays neutral because that is what the number says.
Median extremes from Monday's open on the first basis: +2.00% and -0.59%. On 25,290.0 that is 25,795.9 and 25,140.7.
WHAT KILLS IT
The reading is that the market has left the July value area upward and that this is not a gap waiting to be filled.
Verdict is taken on Friday's daily close on this chart, 31 July.
Wrong if the close is below 25,093.8. That is 276.8 points away, one full expected daily move, and within 19 points of the gap-fill line. Holds if the close is above 25,713.9, the second sigma band, 343 points away. Useless if it closes between the two, which is the most likely single outcome.
Last week the rule was written with an invalidation line 27 points from where price closed, against an expected daily move of 255. It broke on noise. Both lines above are at least one expected daily move away, and both are read off the daily bar of this chart. Naming the chart is part of the rule now.
THE LIMITS
The base rate is price only: no entries, no costs, one index, one feed. n is 22 in the primary cut, which is small enough that only the fill number survives the second basis.
The option map is anchored on a snapshot spot of 24,763.1, roughly 600 points under the index. Strikes stay strikes, so the walls and the flip are still levels, but every distance derived from that snapshot is stale.
Friday is also month end. The profile and the VWAP reset the following Monday, so the levels the verdict is measured against are the ones printed here, not the ones the chart will show in August.
GER40: Two-Scenario Setup | Imbalance Fill & External ExpansionCurrently, the asset has not completed a full price range rebalance in either direction. I am tracking two potential algorithmic scenarios based on the key POIs on the chart:
🔹 Scenario 1 (Local Imbalance Fill & Downside Delivery)
Imbalance Rebalance: Price pushes up toward Level 1, fully rebalancing the fair value gap and testing supply.
Markdown Phase: Following a structural confirmation/reversal, we target a downward movement expanding toward the lower 1.414 / 1.618 external liquidity targets (24,615.9 & 24,201.1).
🔹 Scenario 2 (Upper Expansion Prior to Reversal)
Upper POI Sweep: Price breaks through Level 1 directly into the upper external expansion POIs at 1.414 – 1.618.
Reversal Model: Upon reaching the upper POI and forming a valid distribution/reversal pattern, price initiates a high-probability markdown phase down to the primary downside target (1.414 lower expansion).
📌 Summary: The ultimate downside delivery target remains the lower 1.414 region for both paths. Awaiting clear confirmation within the defined POI levels before taking position.
DAX/GER - LETS SWING THEM DOWNTeam,
Today, as the market opened around 25,672–25,692, these are the levels I’m watching:
Short zone: 25,672–25,692
Double‑up zone: 25,732–25,756
Stop level: 25,830
Target zones:
Target 1: 25,637–25,622
Target 2: 25,615–25,576
Target 3: 25,555–25,487
Last night we captured DAX and FTSE100 extremely well — I ended up making almost 5% from those moves. After hitting our targets, I was too tired to continue trading, so I wrapped up the session early.
LETS GO
YOUR TRADE, YOUR RESPONSIBILITY
DAX — back near its record as oil pressure easesDAX spent the last year building one long structure, and July put it to the test.
Autumn 2025 to early July 2026 : a sustained climb. The bundle runs beneath price through this stretch — the case where structure and direction agree, and there is little to argue with.
Early July : the record high, then a stall. Price steps back from the top of the range.
July : the recovery. Frankfurt is trading back near that record after German business-climate data improved and energy prices eased on hopes the US and Iran resume talks. Whether the bundle holds price on this approach or the index stalls under its own record a second time is open — the structure is what's visible, not the outcome.
Method: tendency planimetry (Insen / OpenTraders) — families of moving averages whose convergence zones act as dynamic support and resistance with direction.
Not financial advice. For analysis and education only.
DAX: On the verge of a collapse to 20,500DAX turned neutral again on its 1D technical outlook (RSI = 51.802, MACD = -8.500, ADX = 22.256) as it failed yet again to break higher but at the same time is holding its 1W MA50 as Support. The 1W RSI is still under a heavy LH pressure, which is technical bearish divergence. Every time this sequence emerged in the past 17 years inside this Channel Up, a strong correction correction of at least -25% followed. Wait for confirmation and the 1W MA50 to break and then target the 1W MA200 (TP = 20,500).
## If you like our free content follow our profile to get more daily ideas. ##
## Comments and likes are greatly appreciated. ##
DEU40 Tests Resistance — Can Bulls Push Toward New Highs?Market View
DEU40 remains in a constructive bullish structure on the 4H chart after recovering from the recent pullback.
The latest rebound has lifted the price back toward the upper boundary of the recent trading range, showing that buyers have regained short-term control. However, the index is now approaching a resistance zone where selling pressure could increase.
As long as higher lows continue to form, the broader bullish outlook remains intact.
Key Resistance
First resistance: 25,500–25,600
Price is testing this area now. A breakout could attract fresh buying momentum.
Second resistance: 25,800–26,000
Clearing this zone would strengthen the bullish trend and open the way for further gains.
Major resistance: 26,600–26,800
This is the next major upside target if buyers maintain control.
Key Support
First support: 25,200–25,300
Holding above this area would keep the current recovery intact.
Second support: 24,900–25,000
A pullback into this zone could attract renewed buying interest.
Major support: 24,500–24,700
Losing this support would weaken the current bullish structure and increase downside risk.
Market Sentiment
Market sentiment remains cautiously bullish.
Buyers continue to control the broader trend, but price is approaching an important resistance area where profit-taking could temporarily slow the advance. A confirmed breakout would reinforce bullish momentum.
Please share your view below:
Will DEU40 break above resistance and continue toward fresh highs? Or will sellers defend this zone and trigger another pullback?
More market structure and key level updates will be shared on a regular basis.
DAX30 -LONG SET UPTeam, stay focused — structure is clean and momentum is steady.
We’re preparing for a disciplined long entry. Follow the plan exactly.
PLEASE NOTE: if you see the market continue to pull back, then wait for next 6-7 hours which is 2-3 hours before the EUROPEAN market open, it will likely recover from it
LONG ENTRY ZONE: 24730 – 24705
ADD MORE LONGS: 24675 – 24645
This is our second layer. Controlled volume, controlled risk.
STOP LOSS: 24580
Target 1: 24778 – 24805
Target 2: 24815 – 24865
Target 3: 24882 – 24976
Take partials at T1, secure capital, and let the rest breathe.
LETS GO
Technical Analysis. 27 July, 2026Wall Street remains in a broad bullish structure, though price has pulled back from recent highs and is consolidating just above its VWAP. A rising trendline continues to underpin the advance, while the descending line from the peak now caps near-term upside. Momentum has eased from overbought extremes but stays constructive overall.
Germany 40 continues to trend higher after a sharp impulsive rally, though price is now correcting within a converging range as the descending resistance line meets a firmer rising support. The index holds comfortably above its VWAP, keeping the broader bias intact. A decisive break of either boundary should confirm the next directional move.
UK 100 has broken back above its long-standing descending resistance trendline, reinforcing an impulsive bullish tone. Price trades above its VWAP with a rising floor of support beneath, and momentum is firming in tandem with the advance. The breakout keeps the index on track for a test of higher levels.
GBP/USD remains in an overall range following its recent bounce, easing back toward the recently formed rising trendline going back to the July low. The pair sits below its VWAP, with the broader bias still tilted slightly bearish given the retreat from the descending resistance line. Momentum is neutral, leaving the near-term path reliant on the support trendline holding.
EUR/USD is consolidating within a narrowing range, hemmed in by a descending resistance line and a firmer rising support beneath. Price is trading marginally below its VWAP, keeping the broader bearish bias intact even as the pair attempts to stabilise. The break of the lower boundary should set the tone for the week ahead.
USD/JPY continues to press higher within a well-defined impulsive uptrend, holding above both its VWAP and rising trendline support. Momentum remains firm, having recently touched overbought territory, underscoring the strength of the advance. Pullbacks continue to be shallow and well supported.
Gold remains corrective, consolidating in a tightening range as a descending resistance line converges with rising support above the big $4k level. Price is holding close to its VWAP, with momentum neutral, reflecting the indecision after the broader pullback from earlier highs. A clear break from the range should clarify the next leg.
Brent Crude remains the standout mover, having staged a strong impulsive rally off its multi-month low. Price has now gapped below 9,000 from resistance and is now correcting back towards its VWAP and rising trendline support. Momentum has cooled from recent strength but continues to support the broader recovery.
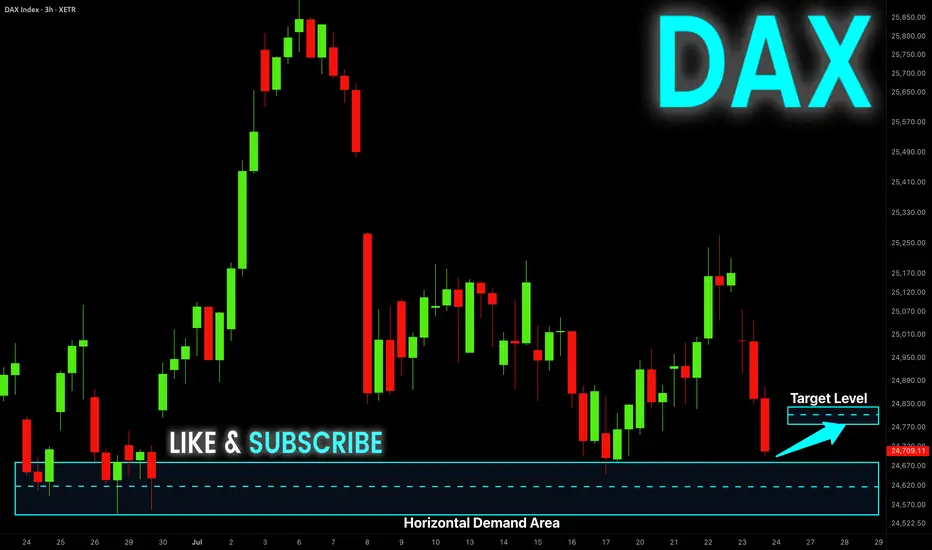
DAX Rebound Expected! Buy!
Hello, Traders!
DAX is reacting from a horizontal demand area after a sharp decline. Accumulation around discount pricing could trigger a bullish rebound toward the next liquidity zone. Time Frame 3H.
Buy!
Comment and subscribe to help us grow!
Check out other forecasts below too!