Optimism's Bear-Market Ends · The 2026 Bull-Market Starts Now!What do we have here? The end of a bear-market or the start of a bull-market, or both?
Hello brothers and sisters, it is my pleasure to be writing for you now and I have a few things to share about this project, OPUSDT, the Cryptocurrency market and what we can expect in the coming months.
Before going deep into OPUSDT, let me tell you that we are going up—that's the starting point.
Naturally, there will be periods of doubts and bearish action all throughout the bull-market phase, it is unavo
Optimism/USD Tether Spot
No trades
No trades
In-depth trading ideas
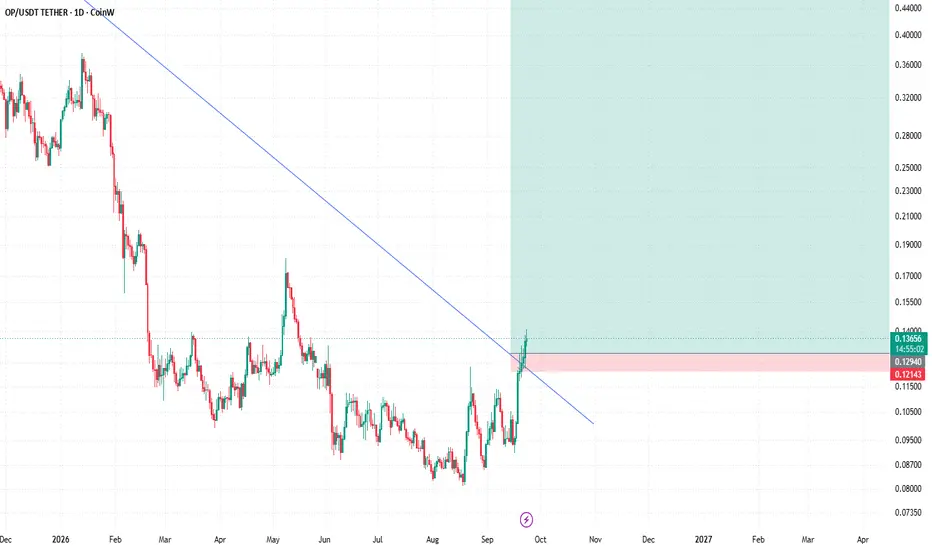
OPUSDT 1DKeep an eye on the daily chart of #OP. It is on the verge of breaking out above the falling wedge resistance and the EMA200. If the breakout is confirmed, the potential upside targets are:
🎯 $0.1649
🎯 $0.1903
🎯 $0.2241
🎯 $0.2578
🎯 $0.3058
🎯 $0.3670
⚠️ Always remember to use a tight stop-loss and maintain proper risk management.
OP Critical Resistance Ahead — Breakout or Rejection?Optimism ( TSE:OP ) remains in a long-term bearish trend, characterized by a descending trendline that has consistently pressured price action since its previous peak.
📉 Market Structure:
Price continues to form a series of *Lower Highs* and *Lower Lows*, indicating that selling pressure has dominated the market structure. However, after an extended decline toward the $0.08051 area, OP has started to recover, pushing upward toward $0.13758.
📌 This recovery is an interesting development to wat
OP Analysis: A Potential Sell Trading Opportunity! (2H)A clear SW H pattern has formed, and we are currently seeing a period of consolidation followed by a breakdown to the downside. The important point here is that the base is located on a higher timeframe, which makes this structure more significant from a technical perspective.
Our expectation is for price to first make a pullback toward and below this higher-timeframe base. If the price confirms the rejection from this area, we expect the downside move to continue and the next bearish leg to de
$OPUSDT Update: 1h Losing SupportWe are currently losing support on OPUSDT,
The market is a little bit choppy so we could be expecting to see it going a bit up before further pullback to the downside.
Coin: OPUSDT Short
Leverage: Isolated x10
entry: 0.12612
Target 1: 0.12234
Target 2: 0.11514
SL: 0.13149
OP: Can the next rebound escape the downtrend? | Oct 1, 2026Would another bounce change the structure, or merely test it? OP is near recent lows, so this short scenario waits for a fresh rebound rather than selling weakness immediately.
OBSERVATION
Binance OPUSDT, 1-hour candles. October 1, 2026, approximately 03:34 UTC: 0.1295 USDT. Since the September 28 highs near 0.150, price has fallen sharply. Recoveries on September 29 and 30 stalled around 0.135–0.136, while repeated lows formed near 0.128. The 0.1320–0.1340 area is a potential rebound test insi
OP/USDT (1D) — Macro Falling Wedge Breakout & Multi-Stage SetupMarket Structure & Technical View:
Optimism (OP) has confirmed a multi-month trendline breakout from a massive falling wedge/descending channel structure that has dictated price action since early 2025. After establishing a rounded bottom accumulation range near multi-year lows, price is printing strong bullish daily momentum (+7.6%).
Daily RSI has crossed above 65 and reclaimed its moving average, confirming dominant buyer control and the initiation of a major trend reversal. Holding above the
Bullish Reversal & Range Breakout for OP/USDT (1W Frame)hi traders
Overview
This weekly analysis on OP/USDT illustrates a potential bottoming pattern and breakout setup following an extended accumulation phase. Price is attempting to push above local range resistance around $0.115–$0.12, supported by a strong volume surge and rising RSI, indicating a potential reversal toward higher resistance zones.
Technical Analysis & Key Levels
Accumulation Base (~$0.080 – $0.115):
Price spent several months consolidating in a tight range between $0.08 and $0.1
OP:USDT INTO NEW UPTREND VOLUME AND BREAKOUT POSSIBLITY..Depending on trend study, OP:USDT showing an interesting view, which can confirm into a breakout, we have seen how part 1 did build, and we expect depending on data part 2 could be interesting trend.. we will follow it as it has also a good stracture building volume.
OP/USDT (15M Chart Setup) – Supply Rejection & Retracement AnalyPrice tapped directly into the key overhead resistance zone between 0.1130 – 0.1155, printed a distinct rejection wick, and has begun rolling over with strong red candles back below 0.1090.
Trade Plan & Key Levels
* Pair: OP/USDT (Binance Spot / Perp)
* Timeframe: 15-Minute
* Current Price: ~0.1089
* Sell / Resistance Zone: 0.1130 – 0.1155
* Take Profit 1 (TP1 - Local Liquidity Shelf): 0.1025 – 0.1030 (approx. -9.5% from highs)
* Take Profit 2 (TP2 - Mid-range Demand): 0.0940 – 0.0950
* T
OP usdt short signal86. OP/USDT – Trade Setup (SHORT)
📈 Position Type: SHORT
🕒 Timeframe: 1H
📊 Market: Futures
💰 Entry Zone:
0.10775
0.11270
🛑 Stop-Loss:
0.11490
🎯 Take-Profit Targets:
• TP1: 0.10427
• TP2: 0.10
• TP3: 0.09710
• TP4. 0.0940
Tp5.
⚙️ Leverage:
5*10
▫️ After TP1, move SL to Entry + 0.2%.
▪️ Exit Plan:
• 40% at TP1
• 20% at TP2
• 20% at TP3
20% at TP4
📌 Risk Management:
Risk only 1–2% of your capital per trade.
⚠️ Always check and confirm the setup on your chart before enteri
OP/USDT H1: Consolidation at the bottom of the range🎯 TP1: $0.082536 (+0.74%) │ TP2: $0.083143 (+1.48%)
🛑 SL: $0.080827 (-1.35%) │ R/R: 1 : 1.1
⚠️ SL is placed beyond the nearest candle tails to reduce the risk of accidental stop-outs.
FUNDAMENTAL BACKGROUND
The crypto market is in a phase of weak correlation: BTC and ETH are showing sideways movement without a clear trend, limiting the potential of altcoins. The lack of project-specific news for OP over the past week leaves the token dependent on overall market dynamics. The macroeconomic backd
OPUSDT — THE BREAKOUT IS COMING?📊⚡ TECHNICAL ANALYSIS
💵 Coin: TSE:OP #OP
⌛ Time Frame: 2D
📉 Pattern: Descending TrendLine / Long-Term Downtrend
📍 Current Area: around $0.0912–$0.0935
🎯 Key Resistance: $0.110 → $0.125 → $0.137 → $0.175 → $0.197
🟢 Bullish Potential: if a breakout & reclaim of the trendline occurs
🔴 Bearish Risk: if price gets rejected again and loses the support area
---
📉🔻 DESCENDING TRENDLINE — MAIN STRUCTURE 🧩
The OP/USDT 2D chart shows that price is still trading below the Descending TrendLine, which h
OP/USDT — Short IdeaOP/USDT — Short Idea
Context: Price has formed a Key Imbalance and established a Breaker Block (BB) around 0.0880.
Scenario: Expecting a pullback towards the BB to test resistance before a continuation down.
Target: Lower imbalance fill and price delivery into the main POI zone at 0.0835 – 0.0845.
Invalidation (SL): Acceptance above 0.0900.
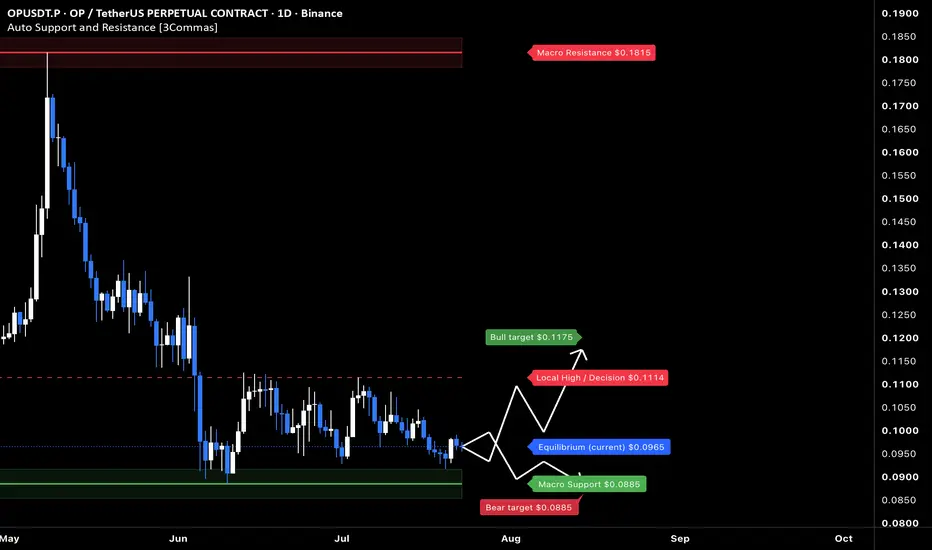
OP at macro floor: base recovery toward $0.1175The Macro Picture 🗺️
OP unwound from the $0.1815 macro ceiling all the way down and has flattened into a base just above the $0.0885 floor, now at $0.0965. The steep selling has given way to a sideways grind — exhaustion rather than continuation.
The Setup ⚙️
The Accumulation Zone 🟢
$0.0885–0.0965 is where the selling has dried up. Macro Support has held on retest, and this is the demand shelf a recovery would build from.
The Decision Point 🔴
$0.1114 (Local High) is the structural gate. Befo
OPUSDT: Breakout Retest Could Fuel the Next RallyOPUSDT has reclaimed a key resistance zone and is now holding above the breakout level, signaling improving bullish momentum. The recent higher lows suggest buyers remain in control.
As long as 0.09597 holds as support, the bullish setup remains valid. A continuation above the current range could drive the price toward 0.09993, while a break below support would invalidate the setup.
Trade Setup
Entry: 0.09685
Target: 0.09993
Stop Loss: 0.09597
I'll wait for sustained buying volume and a conf
OPUSDT - Bear Flag, Bearish Continuation Approaching?📊 Technical Analysis
💵 Coin: TSE:OP #OPUSDT
⏳ Time Frame: 1D
📐 Pattern: 🚩 Bear Flag (Bearish Continuation Pattern)
📉 OPUSDT is currently forming a 🚩 Bear Flag after experiencing a strong bearish decline (Flagpole). The price is now moving in an upward consolidation phase, forming the Flag, but it has yet to change the overall market structure to bullish.
⚠️ As long as the price remains inside the Bear Flag, the probability of a continuation to the downside remains higher.
---
🔍 Pattern O
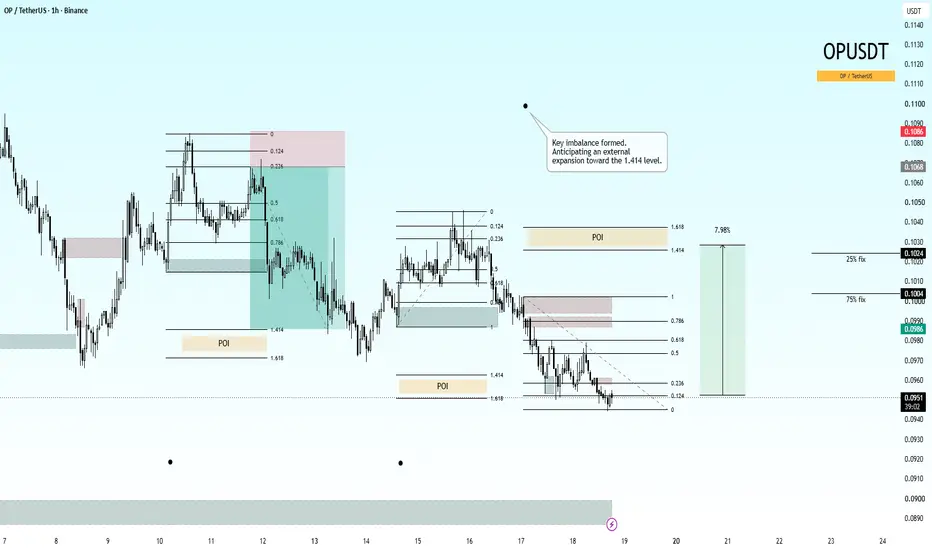
OPUSDT: Key Imbalance Established | Multi-Stage Partial Take-ProMarket Context & Order Flow
On the 1-hour timeframe, OP has generated a clean structural setup after tapping into a deep discount zone. A key imbalance has been formed, signaling institutional interest and an immediate bullish shift in local Order Flow.
Technical Highlights:
Imbalance & POI Confluence: The aggressive impulse confirmed a local Point of Interest (POI). The upcoming expansion is aimed directly at clearing the overhead liquidity pools up to the 1.414 external Fibonacci expansion l
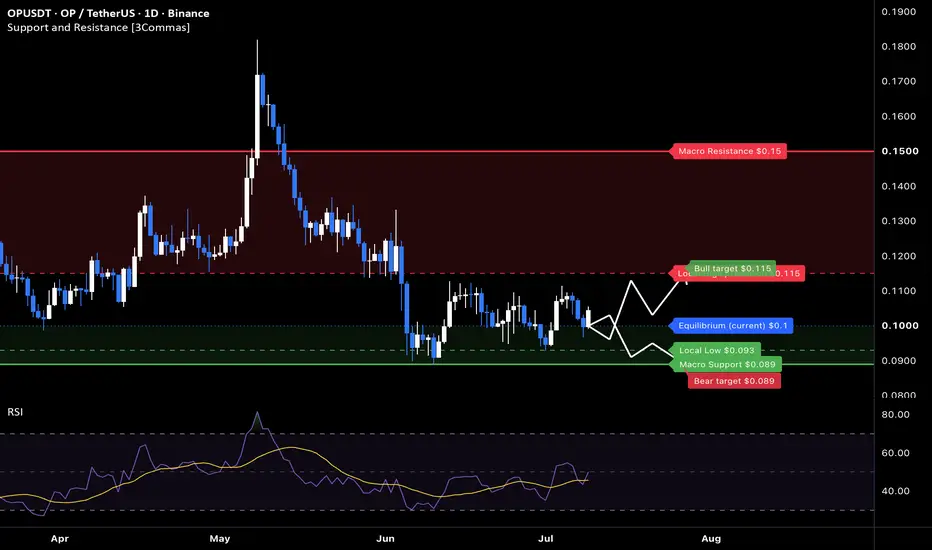
OP: basing above $0.089 toward the $0.115 capThe Macro Picture 🗺️
OP spiked to $0.18 in May before that move fully unwound, bleeding back down into a $0.089 June low. Since then the selling has dried up: price has settled into a range between the $0.089 macro floor and the $0.115 local cap, rotating around the $0.10 equilibrium. RSI hovers near neutral, confirming the post-spike hangover has given way to balance. This kind of low-volatility base above a defended floor is where accumulation quietly builds — the move has reset, and the nex
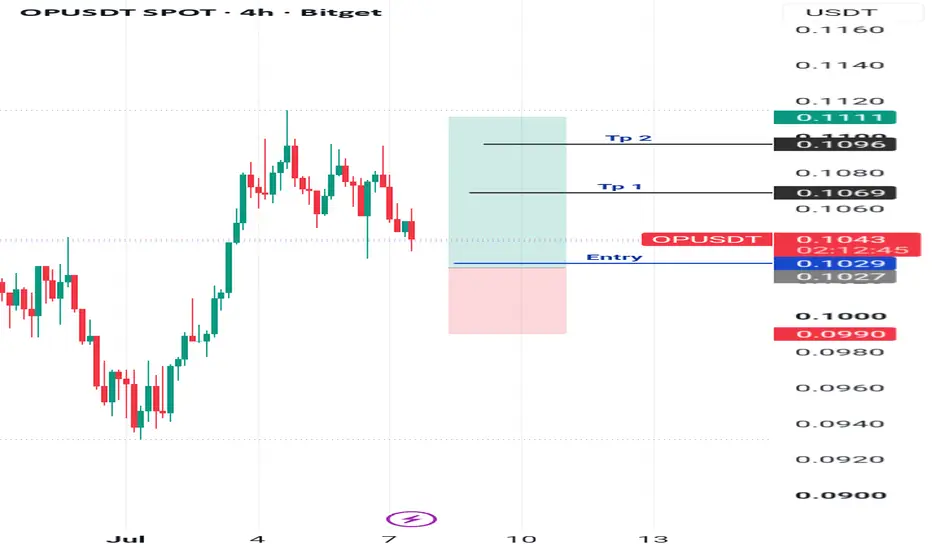
OPUSDT 4H High Probability Long Setup
Trade Bias: Bullish (Buy Limit)
After a strong impulsive rally, OPUSDT s currently pulling back into a potential demand zone. This correction appears healthy and could provide an attractive risk-to-reward opportunity if buyers defend the support area.
Trade Plan
Entry: 0.1029
Stop Loss: 0.0990
Take Profit 1: 0.1069
Take Profit 2: 0.1096
Technical Analysis
✅ Strong bullish impulse indicating buyers are in control.
✅ Current decline looks like a pullback rather than a trend reversal