Nikkei Futures (NKD) Correction Poised to Attract BuyersThe short‑term Elliott Wave view in Nikkei Futures (NKD) shows the cycle from the July 29, 2026 low unfolding as a five‑wave diagonal. Wave 1 advanced to 69,660, followed by a corrective pullback in wave 2 that ended at 62,600. The Index then extended higher in wave 3, reaching 71,540. Currently, wa
Compare with Nikkei 225 Mini Futures
The Nikkei gap fills less, but only inside the dayThe opening gap does not behave the same way in every index future, and the Nikkei is the clearest case.
Measured the same way on both contracts: gap from the prior regular-session close to today's open, filled if price trades back to that close within the same regular session.
In the Nikkei futur
Last chance to short $OSE:NK2251!
OSE:NK2251! formed top 73000 at 23 June, move downward and formed wave 1 & 2. The key point to confirm downtrend is 66500. If drop below, the 1st target is 63000 (wave 3) and rebound to 66000(wave 4). Then the downtrend continues dropping to final target 59600 and form A.
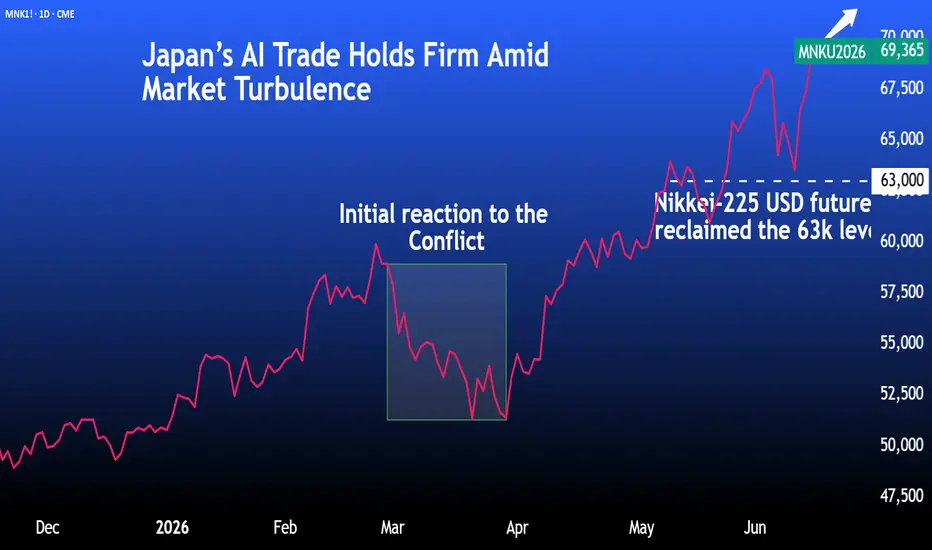
Japan’s AI Trade Holds Firm Amid Market TurbulenceThe recent pullback in Japanese equities comes at a pivotal juncture. After climbing to record highs on the back of AI-driven optimism and robust foreign inflows, the Nikkei-225 faced a period of geopolitical uncertainty and growing valuation concerns that prompted a bout of profit-taking. With geop
MLong

Buyers to Support Nikkei Futures (NKD) Pullback, Eyeing 72870Nikkei Futures (NKD) continues to demonstrate remarkable strength as it extends into new all‑time highs, reinforcing the bullish sequence that began from the March 23, 2026 low. This upward momentum favors additional gains in the near term. From the March 23 low, wave 1 concluded at 63,880, followed
Nikkei Futures (NKD) Approaches End of Cycle from March 2026 LowThe short‑term Elliott Wave view in Nikkei Futures (NKD) shows the cycle from the March 30, 2026 low unfolding as an impulse. This sequence is now approaching completion. From that low, wave ((i)) advanced to 61,000, followed by a corrective decline in wave ((ii)) that ended at 58,651. The Index the
How to Tell the Market is in Euphoria?How to Tell the Market is in Euphoria stage?
Sir John Templeton once said:
“Bull markets are born on pessimism, grow on skepticism, mature on optimism, and die on euphoria.”
We will case study on the Japanese stock index how to identify a euphoria run-up.
Before 28 Feb crisis, we saw a run-up. W
See all ideas
A representation of what an asset is worth today and what the market thinks it will be worth in the future.
Displays a symbol's price movements over previous years to identify recurring trends.
Frequently asked questions
The nearest expiration date for Nikkei 225 Mini Futures is Dec 13, 2018.
Traders prefer to sell futures contracts when they've already made money on the investment, but still have plenty of time left before the expiration date. Thus, many consider it a good option to sell Nikkei 225 Mini Futures before Dec 13, 2018.