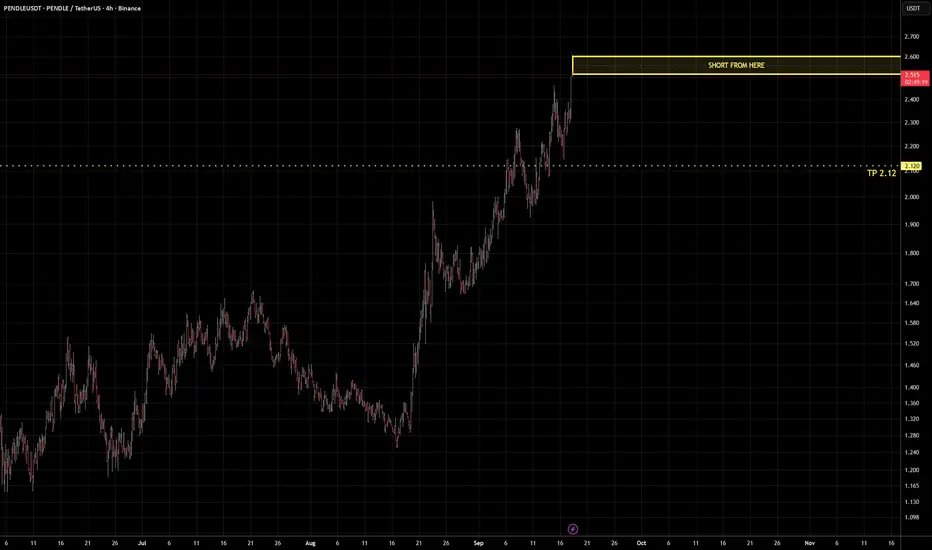
Pendle Flips Resistance into Support: Weekly Reversal SetupBINANCE:PENDLEUSDT Weekly Time-Frame
PENDLE (1W) bottomed near the 1.00 zone in early 2026 and has since rallied strongly. Price has broken above the 2.20 horizontal resistance and reclaimed the anchored VWAP drawn from the 2025 high (lower red line), a level that acted as dynamic resistance throug
Compare with Pendle/USDT
PENDLE’s final bullish wave was truncated! (2H)This is the latest analysis update, which you can find in the related publications section.
In our previous analysis, we identified a Diametric pattern with only one remaining wave, Wave G, which was expected to be bullish.
However, considering the strong price reversal, it appears that this wave
PENDLEAlways use 2x–3x leverage. We build positions in stages, both long and short.
Max 4% of your account as margin per position. Split that 4% into 3–6 entries.
Example: $100 account → max $4 margin per position. Split it as $0.5, then $1, then $1.5. So $0.5 × 3x = $1.5 position size.
Don't get greedy.
PENDLE - levels to watchPENDLE has shown a strong recovery from the lows, but price is now facing an important HTF resistance level.
The key levels I'm watching:
$1.82 → Key support / previous S/R flip
$2.67 → Major resistance / level to reclaim
$1.02 → Major HTF support
Price recently tested $2.67 but failed to hold ab
PENDLE/USDT: Bullish Divergence Alignment on Key SupportPENDLE is presenting a clean bullish divergence trade setup on the 1-hour chart. Price has pulled back directly into a major multi-day ascending trendline.
Buy Stop: 2.448
Take Profit 1 (TP1): 2.644
Take Profit 2 (TP2): 2.848
Stop Loss (SL): 2.234
PENDLE – Strong Support AheadPENDLE has been overall bullish, with the latest move pushing price strongly above its previous structure.
Price is now going through a correction and approaching a strong weekly support zone, which previously acted as a major resistance area.
As long as this support zone holds, we will be looking
PENDLE/USDT:Symmetrical Triangle Compression | 1H Breakout SetupPENDLE/USDT on the 1H timeframe is compressing tightly near the apex of a Symmetrical Triangle pattern.
Price is currently holding around $2.60, coiling between converging descending resistance and ascending support, setting up for a volatility breakout.
Key Technical Details:
Entry Zone: Breakout
PENDLE is still bullish! The bulls are ready to pump it higher !Price appears to be forming a Diametric structure, which is considered a bullish phase.
If price pulls back into the green zone, Wave F could complete there, potentially allowing Wave G to begin. Wave G is expected to be a bullish wave that could push price toward the targets marked on the chart.
See all ideas
Summarizing what the indicators are suggesting.
Oscillators
Neutral
Oscillators
Neutral
Summary
Neutral
Summary
Neutral
Summary
Neutral
Moving Averages
Neutral
Moving Averages
Neutral
Displays a symbol's price movements over previous years to identify recurring trends.
Frequently asked questions
The current price of Pendle/USDT (PENDLE) is 2.073 USDT — it has risen 2.58% in the past 24 hours. Try placing this info into the context by checking out what coins are also gaining and losing at the moment and seeing PENDLE price chart.
Pendle/USDT price has fallen by −8.30% over the last week, its month performance shows a 4.64% increase, and as for the last year, Pendle/USDT has decreased by −46.52%. See more dynamics on PENDLE price chart.
Keep track of coins' changes with our Crypto Coins Heatmap.
Pendle/USDT (PENDLE) reached its highest price on Dec 7, 2024 — it amounted to 7.142 USDT. Find more insights on the PENDLE price chart.
See the list of crypto gainers and choose what best fits your strategy.
Pendle/USDT (PENDLE) reached the lowest price of 0.968 USDT on Apr 5, 2026. View more Pendle/USDT dynamics on the price chart.
See the list of crypto losers to find unexpected opportunities.
The safest choice when buying PENDLE is to go to a well-known crypto exchange. Some of the popular names are Binance, Coinbase, Kraken. But you'll have to find a reliable broker and create an account first. You can trade PENDLE right from TradingView charts — just choose a broker and connect to your account.
Crypto markets are famous for their volatility, so one should study all the available stats before adding crypto assets to their portfolio. Very often it's technical analysis that comes in handy. We prepared technical ratings for Pendle/USDT (PENDLE): today its technical analysis shows the sell signal, and according to the 1 week rating PENDLE shows the neutral signal. And you'd better dig deeper and study 1 month rating too — it's neutral. Find inspiration in Pendle/USDT trading ideas and keep track of what's moving crypto markets with our crypto news feed.
Pendle/USDT (PENDLE) is just as reliable as any other crypto asset — this corner of the world market is highly volatile. Today, for instance, Pendle/USDT is estimated as 8.02% volatile. The only thing it means is that you must prepare and examine all available information before making a decision.
You can discuss Pendle/USDT (PENDLE) with other users in our public chats, Minds or in the comments to Ideas.