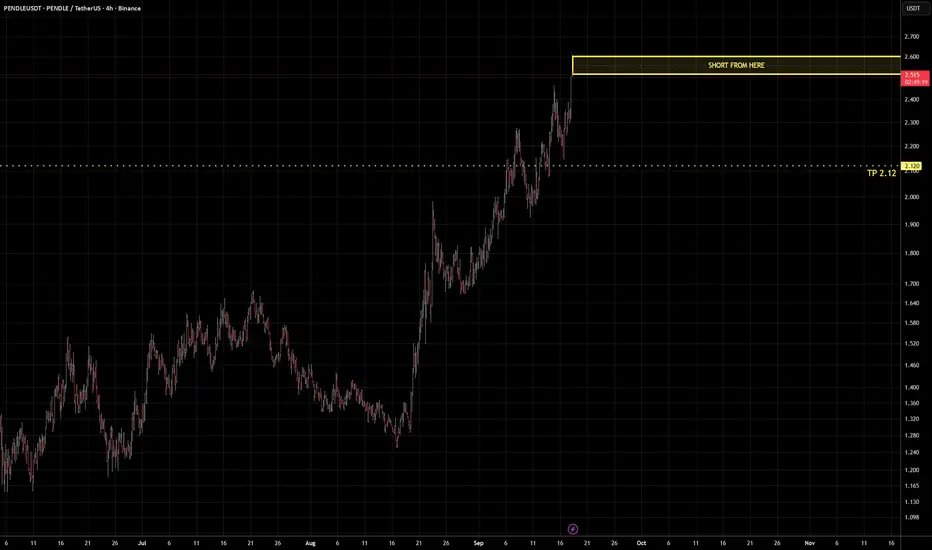
Pendle Flips Resistance into Support: Weekly Reversal SetupBINANCE:PENDLEUSDT Weekly Time-Frame
PENDLE (1W) bottomed near the 1.00 zone in early 2026 and has since rallied strongly. Price has broken above the 2.20 horizontal resistance and reclaimed the anchored VWAP drawn from the 2025 high (lower red line), a level that acted as dynamic resistance throughout the downtrend. Price is now pulling back to retest this breakout zone, where two supports overlap:
The horizontal level at 2.2071, which was resistance and is now support
The anchored VWAP from
In-depth trading ideas
PENDLE’s final bullish wave was truncated! (2H)This is the latest analysis update, which you can find in the related publications section.
In our previous analysis, we identified a Diametric pattern with only one remaining wave, Wave G, which was expected to be bullish.
However, considering the strong price reversal, it appears that this wave has now been completed, meaning the Diametric pattern itself has also reached its completion.
Therefore, within the supply zone, we will be looking for Sell/Short positions.
The targets are clearly
PENDLEAlways use 2x–3x leverage. We build positions in stages, both long and short.
Max 4% of your account as margin per position. Split that 4% into 3–6 entries.
Example: $100 account → max $4 margin per position. Split it as $0.5, then $1, then $1.5. So $0.5 × 3x = $1.5 position size.
Don't get greedy.
Only add when your ROI is above -100%. Better: wait a few days between add-ons. Sleep on it — you might end up adding from higher.
Keep half your account in cash as a reserve. Balanced.
In a short mar
PENDLE - levels to watchPENDLE has shown a strong recovery from the lows, but price is now facing an important HTF resistance level.
The key levels I'm watching:
$1.82 → Key support / previous S/R flip
$2.67 → Major resistance / level to reclaim
$1.02 → Major HTF support
Price recently tested $2.67 but failed to hold above it, making this the most important level to watch right now.
A successful reclaim and hold above $2.67 would be an interesting development for the HTF structure. Until then, the possibility of a
PENDLE/USDT: Bullish Divergence Alignment on Key SupportPENDLE is presenting a clean bullish divergence trade setup on the 1-hour chart. Price has pulled back directly into a major multi-day ascending trendline.
Buy Stop: 2.448
Take Profit 1 (TP1): 2.644
Take Profit 2 (TP2): 2.848
Stop Loss (SL): 2.234
PENDLE – Strong Support AheadPENDLE has been overall bullish, with the latest move pushing price strongly above its previous structure.
Price is now going through a correction and approaching a strong weekly support zone, which previously acted as a major resistance area.
As long as this support zone holds, we will be looking for trend-following long setups on lower timeframes to catch the next potential impulse movement.
A clear break below the support would weaken the bullish scenario and force us to reassess.
📌 Bulli
PENDLE/USDT:Symmetrical Triangle Compression | 1H Breakout SetupPENDLE/USDT on the 1H timeframe is compressing tightly near the apex of a Symmetrical Triangle pattern.
Price is currently holding around $2.60, coiling between converging descending resistance and ascending support, setting up for a volatility breakout.
Key Technical Details:
Entry Zone: Breakout above Upper Resistance (~$2.60 - $2.62)
Stop Loss: $2.475
Take Profit 1: $2.872
Take Profit 2: $3.060
PENDLE is still bullish! The bulls are ready to pump it higher !Price appears to be forming a Diametric structure, which is considered a bullish phase.
If price pulls back into the green zone, Wave F could complete there, potentially allowing Wave G to begin. Wave G is expected to be a bullish wave that could push price toward the targets marked on the chart.
We have marked the targets on the chart. Consider taking partial profits progressively as price reaches each target rather than waiting for the final target.
We are looking for Buy/Long positions wit
Uptrend in Pendle.Pair: #PENDLEUSDT
Time Frame: #4H
Pendle is showing an uptrend on the 4-hour timeframe.
A breakout above the resistance at 2.521, marked by the red line, could lead to another upward move.
The targets are marked by the green lines at 2.759 and 3.173, representing potential gains of 9% and 25%, respectively.
In any case, we’ll manage our risk so that if the analysis is wrong, our losses remain limited.
Good luck.
PENDLE / USDT (DOUBLE TOP)ANALYSIS :-
Price has been consistently forming Higher Highs (HHs) and Higher Lows (HLs), indicating a bullish market structure. However, bearish divergence has developed on the RSI on the 4H timeframe, accompanied by a potential reversal pattern in the form of a Double Top.
The Double Top confirmation will be provided by a decisive breakdown below the neckline, which is the earlier Higher Low (HL). A breakdown below this level would indicate a potential shift in the prevailing bullish market
PENDLE / USDT 4H - Rising wedge, breakout attempt, but...PENDLE / USDT 4H - Rising wedge, breakout attempt, but I would not bury the trend yet
Katsu on the Bridge. Let’s check the PENDLE radar.
On the PENDLE 4H chart, we can indeed see a rising and narrowing structure, which could be interpreted as a rising wedge from a textbook perspective. If we only looked at the pattern, then later this could lead to a move lower, but in my opinion we should not get stuck on the wedge alone, because the chart is not showing a clear reversal yet.
What is more i
PENDLE Eyes Lower: SMA20 & EMA5 Suggest Resistance LimitsBYBIT:PENDLEUSDT.P
PENDLE — Short
Stop loss: 2.204
Take profit: 2.053
Price is positioned below SMA20 at 2.0622, signaling potential downside momentum 📉. EMA5 at 2.1498 sits above the current price, suggesting recent pressure to move lower. The upper Bollinger Band at 2.2137 provides a ceiling, reinforcing resistance near the recent high. Aroon.Up at 78.57 indicates positive but weakening trend strength—potentially setting the stage for reversal. Parabolic SAR at 2.0363 offers a tra
PENDLEUSDT Forming Bullish MomentumPENDLEUSDT is forming a clear bullish momentum pattern, a classic bullish reversal signal that often indicates an upcoming breakout. The price has been consolidating within a narrowing range, suggesting that selling pressure is weakening while buyers are beginning to regain control. With consistent volume confirming accumulation at lower levels, the setup hints at a potential bullish breakout soon. The projected move could lead to an impressive gain of around 40% to 50% once the price breaks abo
PENDLE/USDT H2: Correction against overheated conditions🎯 TP1: $1.6914 (+2.56%) │ TP2: $1.6569 (+4.55%)
🛑 SL: $1.8425 (-6.15%) │ R/R: 1 : 0.74
⚠️ Stop is wider than TP2 target (R/R < 1) — the closer target is hit more often, but adjust position size according to stop loss
FUNDAMENTAL BACKGROUND
PENDLE is moving in line with the broader crypto market rally, but the local catalyst in the form of integration with Valantis failed to generate significant momentum. Strong inflows into BTC/ETH ETFs are supporting altcoins, though the greed index in the 65-
PENDLE/USDT H2: Uptrend update for pendle🎯 TP1: $1.9345 (+7.98%) │ TP2: $1.9861 (+10.86%)
🛑 SL: $1.6146 (-9.87%) │ R/R: 1 : 1.1
⚠️ SL is placed beyond the nearest candle tails to reduce the risk of accidental stop-outs
FUNDAMENTAL BACKGROUND
PENDLE is showing growth amid a general improvement in crypto market sentiment. The Fear & Greed Index has reached the Extreme Greed zone (83), which traditionally supports demand for altcoins. The absence of significant macro releases in the next 7 days leaves the asset dependent on technical fac
PENDLE / PENDLEUSDT Long Setup | Breaker Block ReclaimMARKET ANALYSIS
PENDLE is currently reacting from a key technical area highlighted on the chart.
As long as the protected support zone remains intact, the bullish market structure remains valid and higher liquidity targets may continue to attract price action.
A breakdown below the invalidation level would weaken the current bullish scenario and require a reassessment of market conditions.
📍 Entry, Stop Loss and Take Profit levels are marked directly on the chart.
━━━━━━━━━━━━━━
⚠️ DIS
PENDLE - after buyer defense, healthy sideways movement may comeKatsu on the Bridge, and one of my favorites, PENDLE, is on the radar
On the PENDLE 1H chart, we are currently seeing an interesting structure, and for me it looks quite tradable. The first thing that stands out to me is the role of the candles marked with red arrows. In my opinion, these were key candles, because that was exactly where we could see that the buyer side did not disappear, but stepped into the market and started to hold the price.
This is important.
--------------
Of course, I
PENDLE: local squeeze with $1.8427 destinationThe Macro Picture 🗺️
PENDLE unwound from the $2.2055 high into a summer base and has reclaimed $1.4675, building higher lows off the $1.1480 local low. Price is rotating in the middle of the range with the floor intact — a base rebuilding, not a breakdown.
The Setup ⚙️
The Range Floor 🟢
$1.1480 (Local Low) is the demand shelf the recovery is built on. It has held through the summer, and that's the base this range pivots on.
The Decision Point 🔴
$2.2055 (Local High) is the structural gate abov
PENDLE is in a bullish pattern (4H)From the point marked by the green arrow, a corrective triangle appears to have completed, and PENDLE has entered a bullish pattern.
This pattern appears to be a Diametric.
At the moment, the price seems to be at the beginning of Wave G. Based on the balance of the previous bullish waves within this pattern, a strong Wave G is expected.
The targets are marked on the chart. Consider taking partial profits at the first target.
As long as the green support zone holds, PENDLE remains bullish.
A
PENDLE at macro floor: base recovery toward $1.75The Macro Picture 🗺️
PENDLE unwound its May $2.20 highs down to $1.15 by early June — a structural reset deep enough to flush out the late longs and reset momentum. Since then the tape has changed character: price built a base above $1.15, carved a sequence of higher lows, and reclaimed the $1.48 equilibrium with RSI holding above the midline near 55. That transition from lower lows to a defended, rising base is the signature of accumulation. Price now sits at $1.48, working its way up through
Pendle is turning direction towards Breakout trendlineHello Traders!
//This trade has been analyzed with A1000x Golden Alpha strategy
There are multiple bearish confirmations in the chart and now after a sharp dive it has turned its direction. Now it is aiming towards the breakout trendline.
We are selling Pendle from 1.532
Stoploss 1.6558 (-7.9%)
Target 1.2701(+17.1%)
My goal is to be recognized as one of the highest win-rate traders in the TradingView community. :)
Trade Analysis Based on
> Fibonacci Tool (A1000x Way) – Custom Fibonacci ap