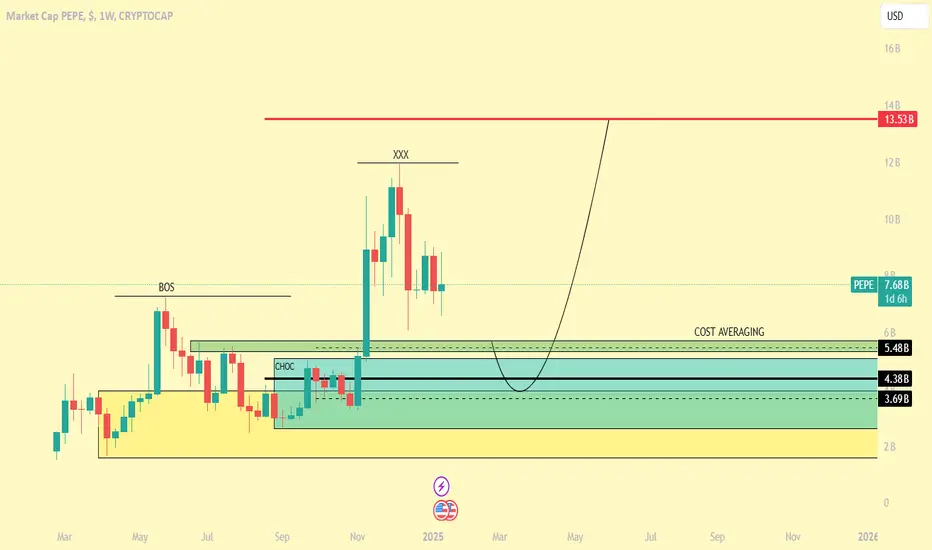
PEPE RSI Cools After Overbought Surge — Is a Pullback on the TabPEPE’s market cap currently stands at $3.77B, up 1.59% on the day. After a sharp upward move, the RSI (14) spiked above 75, signaling overbought conditions, and has now pulled back to the 44–58 range, indicating waning bullish pressure.
Quick breakdown:
RSI Peak: ~75.38 (recent top)
Current RSI:
Market Cap PEPE, $
No trades
No trades
Key data points
Previous close
—
Open
—
Day's range
–
Crypto info
Coin
PEPE Market Cap Approaches Key Fib Resistance — Will the 0.236 LPEPE’s market cap is testing the 0.236 Fibonacci retracement level ($3.76B) after a strong upward move from ~$2.91B. The price is consolidating near the swing high at $3.91B, indicating possible exhaustion or gearing up for a breakout.
The MACD remains bullish for now, but the histogram shows wanin
MACD Hints at Momentum Shift in PEPE: Bearish Crossover or FakePEPE’s market cap has dipped to $3.82B on the 30-minute chart, and the MACD (12,26) shows a recent bearish crossover. The MACD line has fallen below the signal line, and the histogram has flipped red, signaling potential downside momentum building up.
Observations:
MACD Line: Trending below signal
PEPE Market Cap Eyes Breakout: Bollinger Band Squeeze Signals MoPEPE’s market cap on the 30-minute chart is entering a classic Bollinger Band squeeze, indicating reduced volatility and a potential breakout on the horizon. The bands have tightened significantly after a period of sideways consolidation, and the price is hovering near the middle band, showing indec
PEPE Bullish Reversal? Ichimoku Cloud Signals Potential BreakoutThe Ichimoku Cloud on the 4H chart for PEPE coin shows a compelling shift in momentum. The price recently pierced above the Kumo cloud, with the Tenkan-sen crossing above the Kijun-sen — a classic bullish signal. The Chikou span is free of price action, suggesting confirmation of upward trend moment
PEPE/USD – 30-Min Long Trade Setup !📈 🚀
🔹 Asset: PEPE (Market Cap)
🔹 Timeframe: 30-Min Chart
🔹 Setup Type: Bullish Reversal
📌 Trade Plan (Long Position)
✅ Entry: Above $3.18B (Breakout Confirmation)
✅ Stop-Loss: Below $3.08B (Break of Support)
🎯 Targets:
📌 TP1: $3.30B (First Resistance Level)
📌 TP2: $3.46B (Extended Bullish Move)
📊
$PEPE long!🐸 The prophecy foretold this moment! As we gaze upon the sacred TA, the ancient Fibonacci sages whisper—Pepe is at the bottom of the pond, ready to leap to the stars! 🚀
📈 The channel is tighter than Pepe’s grip on his meme kingdom, and the support is holding stronger than Wojak’s coping mechanisms.
PEPE – 30-Min Short Trade Setup!📌
🔹 Asset: PEPE Market Cap (PEPE)
🔹 Timeframe: 30-Min Chart
🔹 Setup Type: Trendline Break & Bearish Continuation Trade
📌 Trade Plan (Short Position)
✅ Entry Zone: Below $3.97B (Breakdown Confirmation)
✅ Stop-Loss (SL): Above $4.03B (Break of Resistance & Trendline Retest)
🎯 Take Profit Targets
📌
PEPE – 30-Min Long Trade Setup!📌
🔹 Asset: PEPE Market Cap (PEPE)
🔹 Timeframe: 30-Min Chart
🔹 Setup Type: Rising Wedge Breakout & Trendline Support Long Trade
📌 Trade Plan (Long Position)
✅ Entry Zone: Above $4.22B (Breakout Confirmation)
✅ Stop-Loss (SL): Below $4.13B (Break of Support & Trendline)
🎯 Take Profit Targets
📌 TP1:
See all ideas
Summarizing what the indicators are suggesting.
Oscillators
Neutral
Oscillators
Neutral
Summary
Neutral
Summary
Neutral
Summary
Neutral
Moving Averages
Neutral
Moving Averages
Neutral
Displays a symbol's value movements over previous years to identify recurring trends.
Frequently asked questions
Today, PEPE market cap is 1.81 B USD.
Track all crypto prices and get even more market insights with our crypto market cap charts.
Market cap helps you understand Pepe's scale relative to other cryptocurrencies, assess its market dominance, and gauge overall sentiment. A rising market cap can signal increasing adoption and investor confidence.
Market cap can also support investment decisions:
- Risk-averse investors often favor large-cap assets like Bitcoin and Ether for long-term holdings or lower-volatility trading
- Investors seeking higher potential returns may explore smaller-cap altcoins, while accepting the higher associated risk
Market cap can also support investment decisions:
- Risk-averse investors often favor large-cap assets like Bitcoin and Ether for long-term holdings or lower-volatility trading
- Investors seeking higher potential returns may explore smaller-cap altcoins, while accepting the higher associated risk
PEPE market cap is updated in real time on our Supercharts.
To see the broader market picture, explore our crypto market cap charts.
PEPE market cap is a helpful indicator, but it's not enough to build a reliable strategy on crypto markets.
Here are some other factors that should constitute your trading decision:
- Price trends: Explore how the price moves on Supercharts, and watch seasonal trends right on TradingView
- On-chain metrics: You can find them on individual symbol pages or in the Crypto Coins Screener
- Macroeconomic context: Watch global news and Macro Maps to stay on top of what's moving the world's finances
Here are some other factors that should constitute your trading decision:
- Price trends: Explore how the price moves on Supercharts, and watch seasonal trends right on TradingView
- On-chain metrics: You can find them on individual symbol pages or in the Crypto Coins Screener
- Macroeconomic context: Watch global news and Macro Maps to stay on top of what's moving the world's finances
Currently, there are 413.77 T coins in circulation.
Find more data on this and other cryptocurrencies in the Crypto Coins Screener.
Pepe dominance is 0.06%, meaning PEPE market cap takes up 0.06% of the total crypto market cap.
Compare cryptocurrencies by their dominance on the crypto dominance chart. For a broader view, explore the Crypto Heatmap.
Pepe market cap is the total value of all coins currently in circulation. It doesn't include burned, locked, or not-yet-mined coins or tokens.
Market cap = current PEPE price × circulating supply
In the Crypto Heatmap, you can view the performance of the crypto market, grouped by market cap.
Market cap = current PEPE price × circulating supply
In the Crypto Heatmap, you can view the performance of the crypto market, grouped by market cap.
Since only the circulating supply is used to calculate Pepe market cap, changes in price have the greatest impact on its value.
As a result, anything that influences price — including news, macroeconomic trends, regulatory updates, ETF flows, institutional adoption, and investor sentiment — can also affect the PEPE market cap.
Market cap is calculated using the current circulating supply. Fully diluted market cap uses the maximum possible supply (for example, 21 million for BTC), including coins or tokens that are locked or not yet released.
Fully diluted market cap = total supply × current price per PEPE
Market cap reflects Pepe's current value, while fully diluted market cap shows what it could be worth if all coins were already mined — offering a view of its potential future valuation.
To find coins that align with your strategy, you can apply these and other crypto metrics in the Crypto Coins Screener.
Fully diluted market cap = total supply × current price per PEPE
Market cap reflects Pepe's current value, while fully diluted market cap shows what it could be worth if all coins were already mined — offering a view of its potential future valuation.
To find coins that align with your strategy, you can apply these and other crypto metrics in the Crypto Coins Screener.
Circulating supply is the number of coins or tokens that are currently available to the public and can be freely traded on the market. It excludes coins that are locked, burned, or not yet mined. This value can change over time as more tokens enter or leave circulation.
Circulating supply is used to calculate a coin's market cap. It differs from total supply, which reflects the total number of coins or tokens associated with an asset, including those that are locked or burned.
Compare cryptocurrencies in our Crypto Coins Screener and find more insights on the crypto market cap charts.
Circulating supply is used to calculate a coin's market cap. It differs from total supply, which reflects the total number of coins or tokens associated with an asset, including those that are locked or burned.
Compare cryptocurrencies in our Crypto Coins Screener and find more insights on the crypto market cap charts.
Today, the total market cap of the crypto market is 2.84 T USD. Explore it in detail to get more insights.