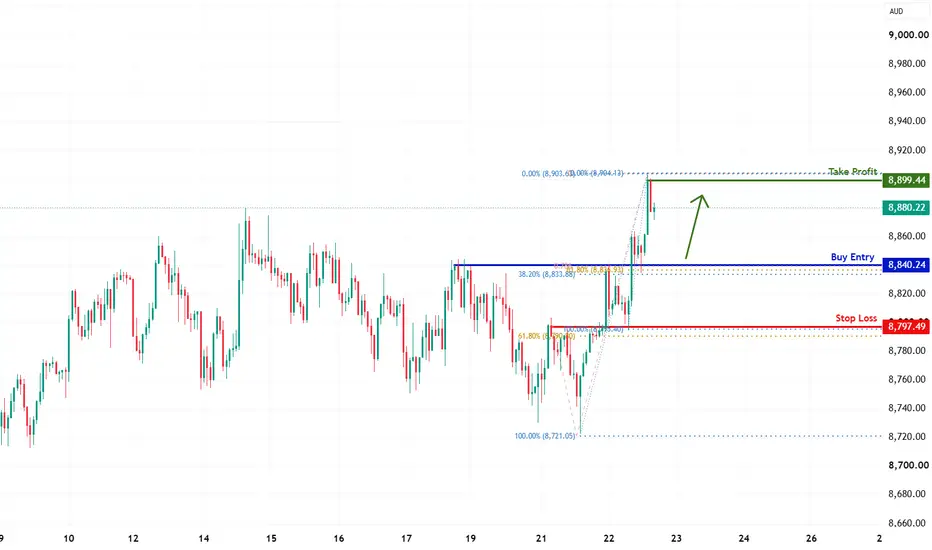
AUS200 H1 | Falling Toward Fib LevelBased on the H1 chart, we could see the price fall to our buy entry level at 8,840.24, an overlap support that aligns with the 38.2% and the 61.8% Fibonacci retracement and the 78.6% Fibonacci projection.
Our stop loss is set at 8,797.49, which is an overlap support that is slightly above the 61.8% Fibonacci retracement.
Our take profit is set at 8,899.44, which is a pullback resistance.
High Risk Investment Warning
Stratos Markets Limited fxcm.com Stratos Europe Ltd, fxcm.com CFDs are complex instruments and come with a high risk of losing money rapidly due to leverage. 69% of retail investor accounts lose money when trading CFDs with this provider. You should consider whether you understand how CFDs work and whether you can afford to take the high risk of losing your money.
Stratos Global LLC fxcm.com Losses can exceed deposits.
Please be advised that the information presented on TradingView is provided to FXCM (‘Company’, ‘we’) by a third-party provider (‘TFA Global Pte Ltd’). Please be reminded that you are solely responsible for the trading decisions on your account. Any information and/or content is intended entirely for research, educational and informational purposes only and does not constitute investment or consultation advice or investment strategy. The information is not tailored to the investment needs of any specific person and therefore does not involve a consideration of any of the investment objectives, financial situation or needs of any viewer that may receive it. Past performance is not a reliable indicator of future results. Actual results may differ materially from those anticipated in forward-looking or past performance statements. We assume no liability as to the accuracy or completeness of any of the information and/or content provided herein and the Company cannot be held responsible for any omission, mistake nor for any loss or damage including without limitation to any loss of profit which may arise from reliance on any information supplied by TFA Global Pte Ltd.
Stratos Trading Pty. Limited fxcm.com Trading FX/CFDs carries significant risks. FXCM AU (AFSL 309763), please read the Financial Services Guide, Product Disclosure Statement, Target Market Determination and Terms of Business at fxcm.com
In-depth trading ideas
ASX200/AUS200 - time to SHORTTeam, stay sharp — structure is clean and we’re preparing for a controlled short position.
Follow the levels exactly, no rushing, no early entries.
SHORT ENTRY ZONE: 8906 – 8918
Let price tap into the range before executing.
ADD MORE SHORTS: 8946 – 8965
This is our second layer — controlled volume, disciplined execution.
STOP LOSS: 9050
Target 1: 8876 – 8865
Target 2: 8856 – 8838
Take partials at T1, protect capital, and let the rest breathe.
LETS GO
NOTE:Dear PAMM investor,
As mentioned last night, there was a possibility to reach 3% if I had closed the UK100 position at the right moment. Unfortunately, I woke up about 5 minutes late, and the market had already closed. Because of that, we finished yesterday with a solid 2.6% gain.
As promised, today I aimed to secure 1% when the market opened — and the plan played out exactly as expected. The structure was clean, the execution was disciplined, and we reached our target.
Thank you for your trust and continued support.
Risk first, profit second — always.
ASX200/AUS200 - TIME FOR LONG ENTRYTEAM — AUS200 LONG SETUP 🔥
Team, yesterday we executed our SHORT at 8915–8930, and the move delivered 100–120 points clean.
Since then, the market has flushed over 180 points, giving us the perfect opportunity to flip and position for the next leg.
LONG ENTRY ZONE: 8750 – 8730
ADDITIONAL LONGS: 8686 – 8666
STOP LOSS: 8620
Target 1: 8782 – 8796
Target 2: 8808 – 8836
Take partials at T1, secure profits, and let the rest breathe.
Buyers are likely to step in around our zones
LETS GO
ASX 200 eyeing a pattern breakoutWe have some interesting price action brewing on the ASX 200.
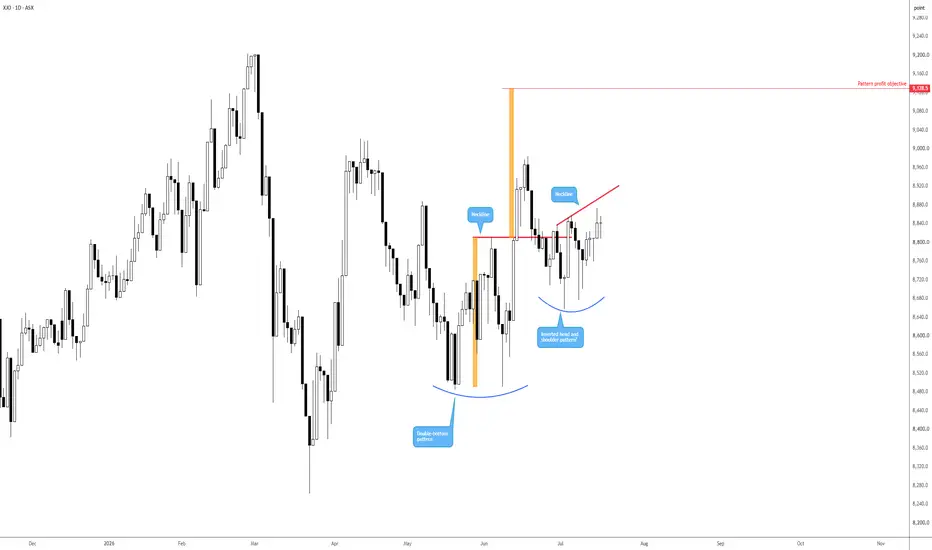
Although a pullback from 8,983 occurred following the break of a double-bottom pattern’s neckline at 8,811, price is beginning to find a footing without breaching the pattern’s lows of around 8,485. The pattern’s profit objective is still calling for attention at 9,128.
Additionally, you may acknowledge the potential inverted head-and-shoulders pattern now forming, with the neckline at 8,900. A break above here may help reaffirm bullish intent from the double-bottom formation, targeting the said profit objective of 9,128.
Written by FP Markets Chief Market Analyst Aaron Hill
Australia 200 Eyes Buy-Side ExpansionAustralia 200 is holding near an important support zone after recent selling. If buyers remain active, the market could move higher and target buy-side liquidity.
A weaker US Dollar and better market sentiment may also support the next bullish move. Wait for confirmation before entering and always manage your risk.
ASX200 / AUS200 LONG SETUPTeam, stay focused — the structure is clean and we have a two‑stage entry plan today.
PRIMARY ENTRY ZONE: 8745 – 8726
ADDITIONAL BUY ZONE: 8686 – 8665
No rushing. No early entries. Let price tap our zones. Otherwise we can trade tomorrow during AUSTRALIAN market opening.
STOP LOSS: 8615
Target 1: 8776 – 8786
Target 2: 8792 – 8826
Once T1 hits, protect capital and let the rest breakeven
LETS GO
AUS200
Same logic. Applied across every instrument.
Price over everything.
Every headline, every rumor, every report, and every opinion is reflected in price.
This AUS200 setup is built on one thing only. Pure price action. No indicators. No noise.
The footprints are there for those who know where to look. Structure, liquidity, and market reaction tell the story long before the news does.
I trade what price reveals, not what people predict.
Price is the only language I need.
Price Left Clues👣
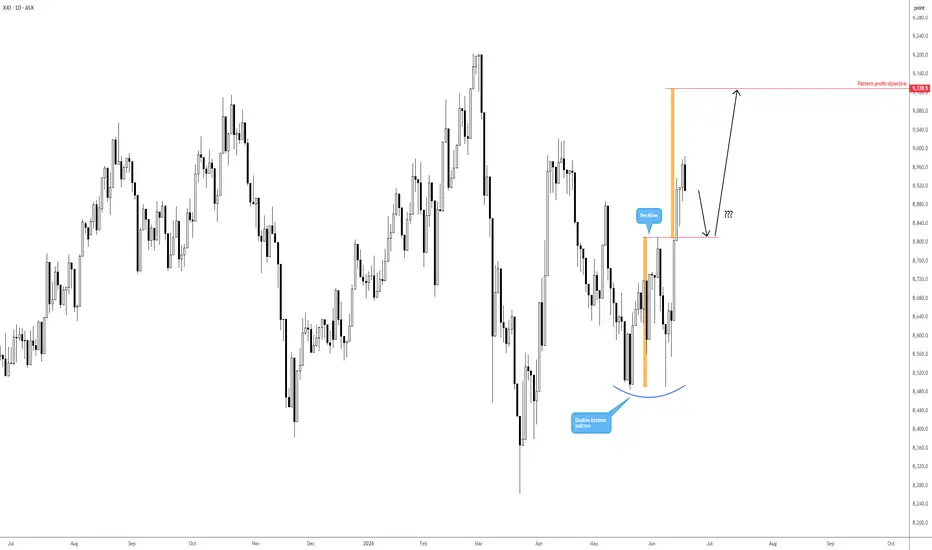
ASX 200 double-bottom pattern in playThe ASX 200 pencilled in a double-bottom pattern at 8,485 in early June, where price recently crossed above the formation’s neckline at 8,810. With Thursday's session closing in the red and snapping a four-day winning streak, this could open the door for a retest of the neckline (as support) to perhaps target the pattern’s profit objective at 9,128 – a base set just south of the index’s all-time high at 9,202.
Written by FP Markets Chief Market Analyst Aaron Hill
AUS200 H4 | Overlap Resistance AheadBased on the H4 chart analysis, we could see the price rise to our sell entry level at 8,896.91, which is an overlap resistance that aligns with the 127.2% Fibonacci extension.
Our stop loss is set at 9,054.91, which is a swing high resistance.
Our take profit is set at 8,707.85, which is a pullback support.
High Risk Investment Warning
Stratos Markets Limited fxcm.com Stratos Europe Ltd, fxcm.com CFDs are complex instruments and come with a high risk of losing money rapidly due to leverage. 69% of retail investor accounts lose money when trading CFDs with this provider. You should consider whether you understand how CFDs work and whether you can afford to take the high risk of losing your money.
Stratos Global LLC fxcm.com Losses can exceed deposits.
Please be advised that the information presented on TradingView is provided to FXCM (‘Company’, ‘we’) by a third-party provider (‘TFA Global Pte Ltd’). Please be reminded that you are solely responsible for the trading decisions on your account. Any information and/or content is intended entirely for research, educational and informational purposes only and does not constitute investment or consultation advice or investment strategy. The information is not tailored to the investment needs of any specific person and therefore does not involve a consideration of any of the investment objectives, financial situation or needs of any viewer that may receive it. Past performance is not a reliable indicator of future results. Actual results may differ materially from those anticipated in forward-looking or past performance statements. We assume no liability as to the accuracy or completeness of any of the information and/or content provided herein and the Company cannot be held responsible for any omission, mistake nor for any loss or damage including without limitation to any loss of profit which may arise from reliance on any information supplied by TFA Global Pte Ltd.
Stratos Trading Pty. Limited fxcm.com Trading FX/CFDs carries significant risks. FXCM AU (AFSL 309763), please read the Financial Services Guide, Product Disclosure Statement, Target Market Determination and Terms of Business at fxcm.com
ASX 200 Break Above 8811 Could Open the Door to 8900Our ASX 200 contract is testing the recent range highs at 8811 on the H4 timeframe, with the initial probe ending in failure. However, the price continues to sit above the 100 and 200-day moving averages on the daily chart on the right, a zone it has struggled to hold above in the recent past. As such, given where our ASX 200 contract now trades, we have some levels to build trade setups around.
If the price can push above the current range high at 8811 and hold there, longs could be considered targeting 8900, a level that has acted as both support and resistance at various points this year. A stop beneath 8811 would offer protection against reversal. Right now, the message from RSI (14) and MACD on the H4 favours longs over shorts, with upside momentum continuing to build.
However, given the initial reluctance to break the range, and the history around these levels, shorts cannot be discounted entirely. Should the price reverse and close beneath the lower end of the moving average zone at 8778.5, shorts could be considered with a stop above the upper end of the zone at 8784.8, targeting 8700, which briefly capped the price earlier this week. 8547 looms as another target, marking the low hit on Thursday prior to the latest bout of Iran-US peace deal hopes.
Good luck!
DS
AUS200 H4 | Bearish Momentum To ContinueThe price is rising to our sell entry level at 8,606.96, which is a pullback resistance that aligns with the 38.2% Fibonacci retracement.
Our stop loss is set at 8,708.02, whichis a pullback resistance that lines up with the 61.8% Fibonacci retracement.
Our take profit is set at 8,401.63, which is a swing low support.
High Risk Investment Warning
Stratos Markets Limited fxcm.com Stratos Europe Ltd fxcm.com
CFDs are complex instruments and come with a high risk of losing money rapidly due to leverage. 69% of retail investor accounts lose money when trading CFDs with this provider. You should consider whether you understand how CFDs work and whether you can afford to take the high risk of losing your money.
Stratos Global LLC fxcm.com Losses can exceed deposits.
Please be advised that the information presented on TradingView is provided to FXCM (‘Company’, ‘we’) by a third-party provider (‘TFA Global Pte Ltd’). Please be reminded that you are solely responsible for the trading decisions on your account. Any information and/or content is intended entirely for research, educational and informational purposes only and does not constitute investment or consultation advice or investment strategy. The information is not tailored to the investment needs of any specific person and therefore does not involve a consideration of any of the investment objectives, financial situation or needs of any viewer that may receive it. Past performance is not a reliable indicator of future results. Actual results may differ materially from those anticipated in forward-looking or past performance statements. We assume no liability as to the accuracy or completeness of any of the information and/or content provided herein and the Company cannot be held responsible for any omission, mistake nor for any loss or damage including without limitation to any loss of profit which may arise from reliance on any information supplied by TFA Global Pte Ltd.
Stratos Trading Pty. Limited fxcm.com
Trading FX/CFDs carries significant risks. FXCM AU (AFSL 309763), please read the Financial Services Guide, Product Disclosure Statement, Target Market Determination and Terms of Business at fxcm.com
AUS200 (S&P/ASX 200) Analysis 📊 AUS200 (S&P/ASX 200) Analysis | Daily Timeframe
Hello to all TradingView friends and followers! 👋🌍
I hope you're having a profitable and disciplined trading week. Today, we're taking a look at AUS200 (S&P/ASX 200 Index), one of the most important stock market indices in the Asia-Pacific region. 🇦🇺📈
The index is currently trading at a very sensitive technical location, while macroeconomic and geopolitical developments could play a significant role in determining its next major move.
🌍 Fundamental Perspective
Recently, global markets have been facing increasing uncertainty due to several macroeconomic risks:
🔸 Persistent inflation concerns in major economies
🔸 Central bank interest rate policies and liquidity tightening
🔸 Geopolitical tensions and potential disruptions in global trade
🔸 Slowing economic growth expectations across developed markets
These factors can significantly increase risk aversion among institutional investors and may put pressure on global equity indices, including AUS200. ⚠️📉
While no single event guarantees a market decline, traders should closely monitor risk sentiment and upcoming economic releases.
📈 Technical Analysis
From a technical standpoint, AUS200 has been trading within a major higher-timeframe structure and recently showed signs of weakness around a key resistance area. 📊
🔍 Looking at the Daily Timeframe, the most recent daily candle suggests that buyers are losing momentum near the upper boundary of the range.
⚠️ More importantly, price has started to lose a key support area that previously acted as a decision zone. This weakness increases the probability of further downside continuation if sellers remain in control.
🐻 Bearish Scenario
If the breakdown below the highlighted daily support area is confirmed:
✅ Sellers may gain additional control over the market.
✅ The path toward lower support zones becomes more attractive.
✅ Momentum traders could consider short opportunities after receiving proper confirmation signals.
📉 In this scenario, the next downside objectives would be the major support region shown on the chart.
🐂 Bullish Scenario
Despite current weakness, bulls are not completely out of the game.
If price quickly reclaims the broken area and closes back above resistance:
✅ The recent breakdown may be classified as a false break (Fakeout).
✅ Buyers could regain momentum.
✅ The market may attempt another move toward higher resistance levels.
However, at this stage, the bearish structure appears slightly stronger based on current price action. ⚠️
🎯 Trading Plan
🔴 Short Bias:
Wait for confirmation below the daily breakdown zone.
Look for bearish continuation signals before entering.
🟢 Long Bias:
Only if price reclaims the broken level and invalidates the bearish structure.
📌 Risk management remains essential, especially during periods of elevated market uncertainty.
📊 Community Poll
What is your outlook for AUS200 over the next few weeks?
🔘 Bullish 📈
🔘 Bearish 📉
🔘 Range-Bound ↔️
Share your thoughts in the comments! 👇
⚠️ Disclaimer
This analysis is for educational and informational purposes only and does not constitute financial or investment advice. Always conduct your own research and use proper risk management before entering any trade.
🏷️ Tags
#AUS200 #ASX200 #Indices #StockMarket #TradingView #TechnicalAnalysis #PriceAction #Forex #CFDTrading #DayTrading #SwingTrading #MarketAnalysis #SupportAndResistance #RiskManagement #Bearish #ShortSetup #GlobalMarkets #Investing #Trading #Finance
AUS200 H1 | Bearish Reaction Off Overlap ResistanceMomentum: Bearish
Price is currently below the ichimoku cloud.
Sell entry: 8,572.30
- Overlap resistance
- 50% Fib retracement
Stop Loss: 8,614.10
- Swing high resistance
Take Profit: 8,490.38
- Swing low support
High Risk Investment Warning
Stratos Markets Limited (fxcm.com/uk), Stratos Europe Ltd (fxcm.com/eu):
CFDs are complex instruments and come with a high risk of losing money rapidly due to leverage. 69% of retail investor accounts lose money when trading CFDs with this provider. You should consider whether you understand how CFDs work and whether you can afford to take the high risk of losing your money.
Stratos Global LLC (fxcm.com/en): Losses can exceed deposits.
Please be advised that the information presented on TradingView is provided to FXCM (‘Company’, ‘we’) by a third-party provider (‘TFA Global Pte Ltd’). Please be reminded that you are solely responsible for the trading decisions on your account. Any information and/or content is intended entirely for research, educational and informational purposes only and does not constitute investment or consultation advice or investment strategy. The information is not tailored to the investment needs of any specific person and therefore does not involve a consideration of any of the investment objectives, financial situation or needs of any viewer that may receive it. Past performance is not a reliable indicator of future results. Actual results may differ materially from those anticipated in forward-looking or past performance statements. We assume no liability as to the accuracy or completeness of any of the information and/or content provided herein and the Company cannot be held responsible for any omission, mistake nor for any loss or damage including without limitation to any loss of profit which may arise from reliance on any information supplied by TFA Global Pte Ltd.
Stratos Trading Pty. Limited (fxcm.com/au):
Trading FX/CFDs carries significant risks. FXCM AU (AFSL 309763), please read the Financial Services Guide, Product Disclosure Statement, Target Market Determination and Terms of Business at fxcm.com/au
AUS200 | The first one of the week | Week,May, 17-22,2026Hello Traders!
After several cases of cancellation due to the absence of a suitable signal.
Today, we can enter a short position on the Australian index OANDA:AU200AUD when a signal candle appears.
On the D1 timeframe, price action forming an accumulation pattern where the short-term EMA crosses below the long-term EMA indicates that the uptrend has ended and there is a high probability that the index will continue to correct, although it has not yet officially entered a downtrend
The H4 chart has entered a downtrend with the “Last Kiss” pattern appearing.
Place a Sell Stop order and wait for the Market's response
NOTE: This is an earlier-than-usual Sell order.
AUS200 at Critical Support | Fake Breakdown Before the Next BigHello to all TradingView followers and traders 🌍📈
Hope your trades are always green and profitable 💚🔥
Today we’re taking a look at AUS200 (ASX 200), one of the most important stock market indices in Australia, which can provide a strong overview of overall market sentiment and economic conditions in the Oceania region 🇦🇺📊
This index is heavily influenced by the Reserve Bank of Australia’s policies, commodity prices, and global economic conditions 🌏⚡
That’s why AUS200 often creates attractive opportunities for short-term traders and swing traders 👀📈
AUS200 Technical Analysis 📊🔥
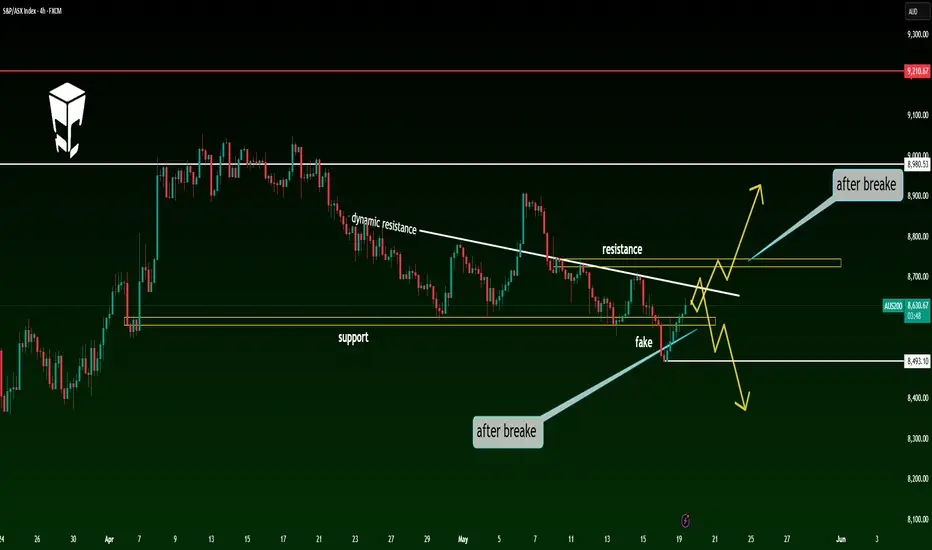
On the 4-hour timeframe, price is currently moving inside a range box structure and has now reached a key support floor ⚠️📉
One important detail is that the market previously created a fake breakout below the support zone and quickly moved back inside the range, which could indicate liquidity collection 🧠💥
At the moment, price is trying to recover, but several important resistance levels are still standing in the way 🚨
Key Chart Observations 📌
🔹 Price is currently sitting on a major 4H support zone 🟡
🔹 The range low was previously broken with a fake breakout ⚠️
🔹 The descending dynamic trendline is still acting as resistance 🔻
🔹 The marked static resistance zone is also a very important level for continuation 📈
Bullish Scenario 🚀📈
📍 If price manages to break above both the descending dynamic resistance and the marked static resistance zone, followed by confirmation and consolidation, we could see the beginning of a new bullish wave 🔥⚡
🎯 Potential upside targets:
And potentially higher levels if bullish momentum increases 📊🚀
Bearish Scenario 📉⚠️
However, if the support floor breaks again and price confirms below this zone, it could become confirmation for continued selling pressure and potential short positions 🐻🔥
📌 In that case, we will wait for bearish structure confirmation before entering the trade in order to reduce risk 🧠✅
Trading Strategy 💡
✅ Long positions after confirmed breakout above resistance levels
✅ Short positions only after a valid support breakdown
⚠️ Waiting for structure confirmation can significantly reduce risk
📌 Never ignore proper risk management
Poll 📊🤔
What’s your opinion on AUS200? 👀
🔘 Resistance will break and a bullish wave will begin 🚀
🔘 Support will fail and the market will continue lower 📉
🔘 The market will remain range-bound 🔄
Make sure to share your thoughts in the comments 💬👇
⚠️ Disclaimer
This analysis reflects personal opinion only and is not financial advice or a buy/sell signal.
Always do your own research and apply proper risk management before entering any trade. 📌
#AUS200 #ASX200 #Indices #TechnicalAnalysis #PriceAction #TradingView #Forex #SupportAndResistance #FakeBreakout #SwingTrade #MarketAnalysis #TradingSetup #Bullish #Bearish #RangeMarket
AUS200 1H – Bullish Falling Wedge Eyeing 8,690The 1h AUS200 shows a corrective falling wedge within a broader uptrend, coupled with bullish RSI divergence, favoring an upside resolution.
Main scenario
Price is compressing in a falling wedge after an impulsive drop, with contracting volatility and declining volume, suggesting seller exhaustion. A breakout above the wedge resistance would confirm a bullish reversal, with the target projected using the wedge height toward the marked resistance zone around 8,680–8,690, near prior supply and moving-average confluence.
Alternative scenario
Failure to break the wedge top and a decisive close below the lower boundary would invalidate the bullish setup and reopen downside toward the recent swing lows and next support band around 8,520–8,500
AUS200 H4 | Bearish Drop OffThe price has rejected off our sell entry level at 8,767.15, which is an overlap resistance that aligns with the 38.2% Fibonacci retracement.
Our stop loss is set at 8,838.20, which is a pullback resistance that lines up with the 50% Fibonacci retracement.
Our take profit is set at 8,610.30, which is a pullback support.
High Risk Investment Warning
Stratos Markets Limited fxcm.com Stratos Europe Ltd fxcm.com
CFDs are complex instruments and come with a high risk of losing money rapidly due to leverage. 69% of retail investor accounts lose money when trading CFDs with this provider. You should consider whether you understand how CFDs work and whether you can afford to take the high risk of losing your money.
Stratos Global LLC fxcm.com Losses can exceed deposits.
Please be advised that the information presented on TradingView is provided to FXCM (‘Company’, ‘we’) by a third-party provider (‘TFA Global Pte Ltd’). Please be reminded that you are solely responsible for the trading decisions on your account. Any information and/or content is intended entirely for research, educational and informational purposes only and does not constitute investment or consultation advice or investment strategy. The information is not tailored to the investment needs of any specific person and therefore does not involve a consideration of any of the investment objectives, financial situation or needs of any viewer that may receive it. Past performance is not a reliable indicator of future results. Actual results may differ materially from those anticipated in forward-looking or past performance statements. We assume no liability as to the accuracy or completeness of any of the information and/or content provided herein and the Company cannot be held responsible for any omission, mistake nor for any loss or damage including without limitation to any loss of profit which may arise from reliance on any information supplied by TFA Global Pte Ltd.
Stratos Trading Pty. Limited fxcm.com
Trading FX/CFDs carries significant risks. FXCM AU (AFSL 309763), please read the Financial Services Guide, Product Disclosure Statement, Target Market Determination and Terms of Business at fxcm.com