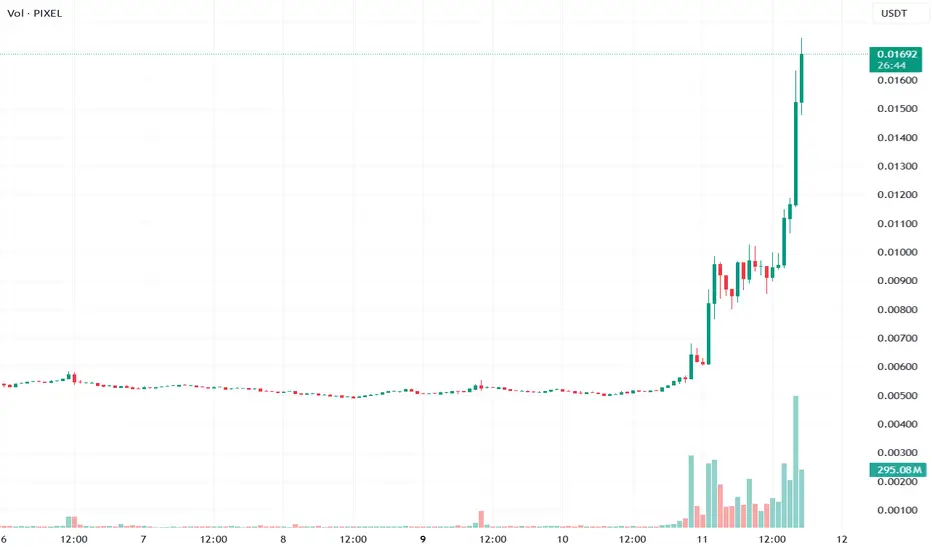
PiXEL price analysis🚀 #PIXEL +270% in 2 days — a classic altseason move… but is altseason here yet?
Back in real altseason periods, moves like +200–300% in a few days were quite common. Many altcoins were making similar explosive runs on a regular basis.
But would we open a long on OKX:PIXELUSDT right now?
Most like
Pixels · Technical analysis & trading strategyPIXEL already showed what it can do with a 300% move in just 2 days. Let's study the chart.
Trading volume starts to rise after the October 2025 flush low. Trading activity goes even higher after the all-time low in early February, a technical double-bottom.
The initial bullish breakout, the move
PIXELUSDT 12H#PIXEL is trading within a bullish flag pattern on the 12H timeframe. Enter this coin only after a breakout above both the flag and the 12H SMA 50. In that scenario, the potential targets are:
🎯 $0.00934
🎯 $0.01129
🎯 $0.01288
🎯 $0.01446
🎯 $0.01670
🎯 $0.01957
⚠️ Always remember to use a tight stop-
PIXEL/USDT — Short Signal at Dynamic Resistance, Targeting RangePIXELUSDT Perpetual — 2H
PIXEL has been in a steady downtrend since late March, grinding from 0.0088 down to 0.0058 before bouncing. The recent recovery rally pushed price back up to 0.0075 — right into a key dynamic resistance level where a sell signal fired.
Why this setup matters:
The bounce f
#PIXEL#PIXEL is currently consolidating 🧐 within a falling wedge pattern. The pattern suggests a potential breakout 🚀 as the price action tightens. A target of 0.008100 is set if the breakout is confirmed 🎯.
A breakout from a falling wedge often leads to a bullish move, but always confirm with volume 📈.
PIXELUSDT — Bear Signals Dominate but OBV Bull Divergence... and Both Squeezed Compressed at Price Floor
Spot:Fut reads Normal with 680.84M spot dollar versus 2.57B futures dollar — roughly 3.8x futures lean with unit volume 5.02M futures against 19M spot. The ratio is elevated but not ghost-market territory, and the Normal tag holds. Spot dollar at 19M
$PIXEL Just Went Parabolic -- 200% Pump Has Traders Watching💰 COIN: BINANCE:PIXELUSDT
📈 Direction: BULLISH (Momentum Rally)
➖➖➖➖➖➖➖
🟢 Demand / Support Zone:
$0.00946 – $0.00853 (key accumulation area where buyers previously stepped in)
🎯 Entry Price:
$0.00945 (breakout retest zone)
🛑 Stop Loss:
$0.00795 (below demand zone to protect against breakdown)
PIXELUSDT — Futures Squeeze Imminent and Spot DeceleratingPrice is at 0.01665 and the futures-to-spot ratio is 19.36x High. Spot dollar volume is 4.5B. Futures dollar volume is 87.16B. The signal stack has rotated to Extreme Breakout confirmation while the volume engine underneath it is running almost entirely on leveraged speculation — nineteen dollars of
PIXELUSDT Forming Falling WedgePIXELUSDT is currently forming a bullish falling wedge pattern, which is one of the most reliable reversal signals in technical analysis. The price action has been consolidating within narrowing trendlines, and with good trading volume starting to appear, a breakout move is highly anticipated. This
It's a time for PIXEL. 50% potential profit - 0.05 USDThe analysis of the PIXELUSDT chart suggests a potential price increase in the near future to 0.05 USD. Based on the provided TradingView chart, after a period of declines in June 2025, when the token's price fluctuated around 0.055 USD, it has stabilized around 0.034 USD by mid-August, indicating t
See all ideas
Summarizing what the indicators are suggesting.
Oscillators
Neutral
SellBuy
Strong sellStrong buy
Strong sellSellNeutralBuyStrong buy
Oscillators
Neutral
SellBuy
Strong sellStrong buy
Strong sellSellNeutralBuyStrong buy
Summary
Neutral
SellBuy
Strong sellStrong buy
Strong sellSellNeutralBuyStrong buy
Summary
Neutral
SellBuy
Strong sellStrong buy
Strong sellSellNeutralBuyStrong buy
Summary
Neutral
SellBuy
Strong sellStrong buy
Strong sellSellNeutralBuyStrong buy
Moving Averages
Neutral
SellBuy
Strong sellStrong buy
Strong sellSellNeutralBuyStrong buy
Moving Averages
Neutral
SellBuy
Strong sellStrong buy
Strong sellSellNeutralBuyStrong buy
Displays a symbol's price movements over previous years to identify recurring trends.