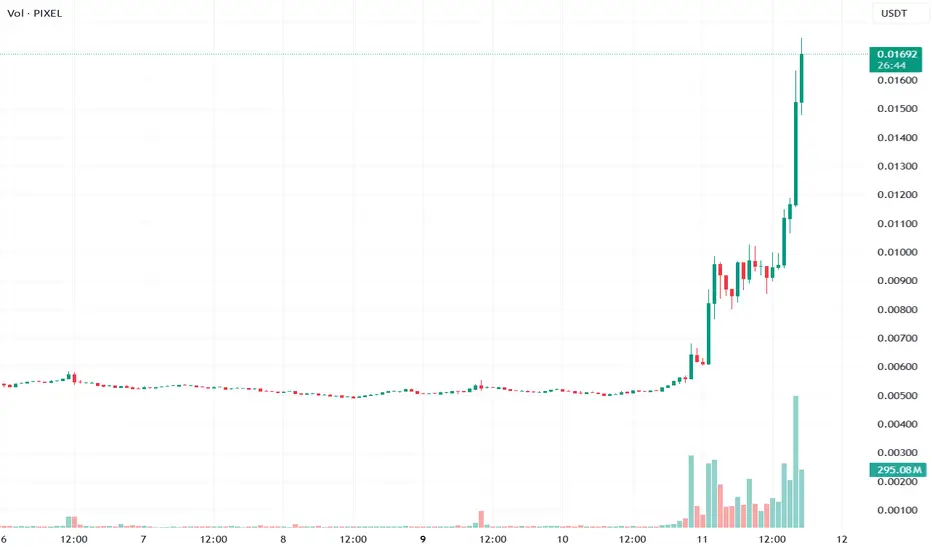
PiXEL price analysis🚀 #PIXEL +270% in 2 days — a classic altseason move… but is altseason here yet?
Back in real altseason periods, moves like +200–300% in a few days were quite common. Many altcoins were making similar explosive runs on a regular basis.
But would we open a long on OKX:PIXELUSDT right now?
Most likely no, and here’s why:
🔹 Fundamentally, altseason is not confirmed yet.
🔹 Price just reached a major liquidity zone, where markets often react with at least a short-term pullback.
🔹 Vertical pumps historically tend to correct deeply.
Moves like this often end with −70% to −80% retracements.
Of course, the market can always surprise us — and we would be happy to be wrong.
But after such a sharp move, caution usually pays off.
❓Do you think this is the beginning of a real altseason or just a temporary pump before a correction?
______________
◆ Follow us ❤️ for daily crypto insights & updates!
🚀 Don’t miss out on important market moves
🧠 DYOR | This is not financial advice, just thinking out loud
In-depth trading ideas
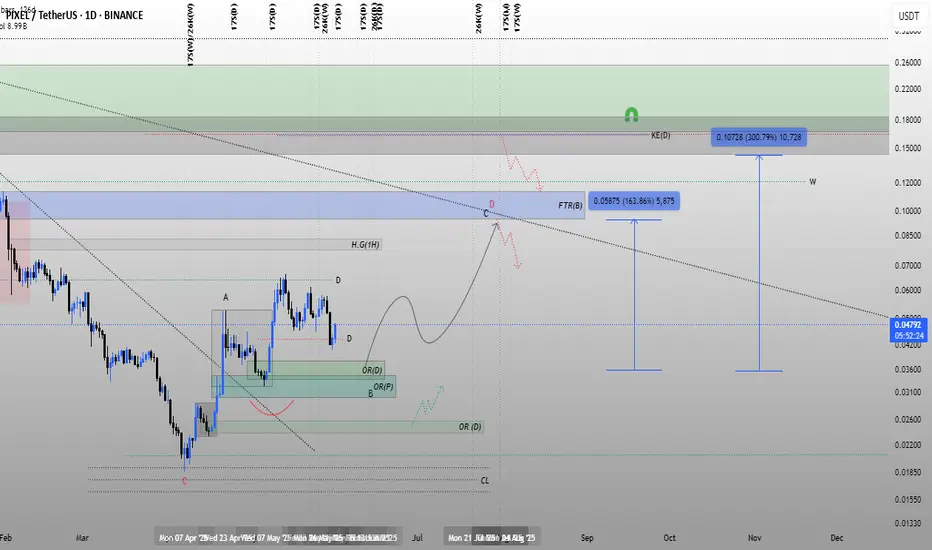
Pixels · Technical analysis & trading strategyPIXEL already showed what it can do with a 300% move in just 2 days. Let's study the chart.
Trading volume starts to rise after the October 2025 flush low. Trading activity goes even higher after the all-time low in early February, a technical double-bottom.
The initial bullish breakout, the move that cements and confirms the bottom, happened mid-March. After strong growth, there is always a retrace and this retrace ends in a higher low. This is shown by the blue cup-pattern on the chart. Many traders use this moment to enter a new trade.
Rather than anticipating the breakout as we do, conventional traders wait for confirmation and buy when the pullback (retrace) is over. This method reduces risk and waiting time.
For example. A new advance and higher high is now high probability while the initial bullish breakout is questionable. The bottom process can always extend and there can even be a bearish continuation. But not now, the bullish bias is confirmed.
At this point, PIXELUSDT can be approached with force. The targets can be seen on the chart.
Namaste.
PIXELUSDT 12H#PIXEL is trading within a bullish flag pattern on the 12H timeframe. Enter this coin only after a breakout above both the flag and the 12H SMA 50. In that scenario, the potential targets are:
🎯 $0.00934
🎯 $0.01129
🎯 $0.01288
🎯 $0.01446
🎯 $0.01670
🎯 $0.01957
⚠️ Always remember to use a tight stop-loss and maintain proper risk management.
PIXEL/USDT — Short Signal at Dynamic Resistance, Targeting RangePIXELUSDT Perpetual — 2H
PIXEL has been in a steady downtrend since late March, grinding from 0.0088 down to 0.0058 before bouncing. The recent recovery rally pushed price back up to 0.0075 — right into a key dynamic resistance level where a sell signal fired.
Why this setup matters:
The bounce from the low was corrective — slow, choppy, overlapping candles. That's a sign of weak buying, not trend reversal. When price hit the dynamic resistance zone, it got rejected immediately with a sharp bearish candle. Classic retest-and-reject pattern on the larger downtrend.
Entry: 0.007248 (signal entry on retest)
Stop Loss: 0.007598 — above the rejection wick and resistance zone
TP1: 0.006829 — previous support shelf where earlier reactions occurred
TP2: 0.006298 — the swing low target for the full measured move
Exit strategy:
Secure 50% at TP1 and move stop to breakeven. Let the rest ride to TP2 risk-free. If momentum is strong at TP1, the continuation to TP2 is high probability given the overall bearish structure.
Invalidation: Close above 0.007598 on the 2H — that means the resistance zone failed and buyers are back in control.
R:R: Approximately 1:1.2 to TP1 and 1:2.7 to TP2. The asymmetric payoff is on the extended target.
A signal flagged this setup. We took it. Currently running +1.48%. The timestamp is the record — update coming with the result.
#PIXEL#PIXEL is currently consolidating 🧐 within a falling wedge pattern. The pattern suggests a potential breakout 🚀 as the price action tightens. A target of 0.008100 is set if the breakout is confirmed 🎯.
A breakout from a falling wedge often leads to a bullish move, but always confirm with volume 📈.
#PIXEL #crypto #trading #altcoin
PIXELUSDT — Bear Signals Dominate but OBV Bull Divergence... and Both Squeezed Compressed at Price Floor
Spot:Fut reads Normal with 680.84M spot dollar versus 2.57B futures dollar — roughly 3.8x futures lean with unit volume 5.02M futures against 19M spot. The ratio is elevated but not ghost-market territory, and the Normal tag holds. Spot dollar at 19M versus futures 2.57B shows futures dominating by dollar weight while spot leads by unit count — a split structure that gives the OBV divergence signal more credibility than it would have in a pure futures-dominated market.
Signal board at 20 green to 39 red out of 112 — deep bear dominance. Moderate BEAR 16.49% at 1.39x with clarity 53%. EMA 0:6 full red sweep, Ichi TK 0:14 maximum bear reading, C>T 4:10, DD/SS 1:10 a severe reversal danger flag. Candle 9:5 is the only green lean. Engulf 5:2 green. Squeeze ELEVATED at 6 bars with both spot and futures compressed simultaneously — Sqz Div reads Both Compressed, momentum bear rising. BW 46.27% normal. Retrace -30% deep, Bounce only 19.4% at 0.6x partial. The bear case is comprehensive across structure, trend, and pattern.
Spot Z 0.30 average, Fut Z -0.03 steady, combined -0.01 steady — spot holding positive while futures flat. The 1-to-5 Spot Z range at 0.30 to -0.10 to 0.40 rising with minus tag — mixed but spot showing mild recovery attempt. Spot momentum expanding at 269.4% normal. Bull:Bear Z 0.09 to -0.23 neutral. OBV Z 1.38 Strong rising with BULL DIV flagged in green — this is the most critical data point on the chart. OBV is diverging bullish against a bear price trend, which is the classic accumulation signal that precedes reversals.
Leverage at 3.75x declining, percentile 15.6% floor — deleveraging into price floor is structurally constructive. Price at 10.2% floor. AT Max 19.36x just 29 bars ago versus current 3.75x — rapid leverage flush in recent history. Prem -0.75% extreme backwardation at -1.5 sigma with yield -816% APY bull. MeanZ -0.59 sigma drifting. Both squeeze channels compressed simultaneously at elevated state 6 bars and futures HIGH 8 bars — that dual compression is building significant kinetic energy for the next directional move.
The honest read: PIXEL is bearish on every structural metric — Ichi 0:14, EMA swept red, DD/SS 1:10, Moderate Bear tag, -30% retrace. But underneath that bear structure sits a setup with serious reversal ingredients: price at 10.2% floor, leverage flushed to 15.6% percentile, OBV Strong rising with confirmed Bull Divergence, Both Compressed squeeze elevated 6 bars, and spot Z positive while futures stay flat. OBV diverging bullish against a bear trend at price floor is not noise — it is accumulation. The squeeze direction when it fires will be the confirmation signal. Do not short the floor into a bull OBV divergence.
Is That Crypto Pump Real? Data Says No. Here's Why.
Stop Losing Money to Fake Volume. Find Real Moves Now.
Trade the REAL Crypto Volume. Stop Getting Faked Out.
$PIXEL Just Went Parabolic -- 200% Pump Has Traders Watching💰 COIN: BINANCE:PIXELUSDT
📈 Direction: BULLISH (Momentum Rally)
➖➖➖➖➖➖➖
🟢 Demand / Support Zone:
$0.00946 – $0.00853 (key accumulation area where buyers previously stepped in)
🎯 Entry Price:
$0.00945 (breakout retest zone)
🛑 Stop Loss:
$0.00795 (below demand zone to protect against breakdown)
🎯 Target 1:
$0.01271 (first resistance / partial profit area)
🎯 Target 2:
$0.01695 (major resistance near recent highs)
➖➖➖➖➖➖➖
📊 Technical Overview
• NGM:PIXEL recently delivered a massive breakout rally of ~274% after weeks of accumulation.
• Price broke above the 200 EMA, triggering strong bullish momentum and attracting heavy trader attention.
• The move was supported by explosive volume growth, confirming aggressive buying activity.
• Currently, the price is consolidating near the highs, which often signals bullish continuation if support holds.
📈 Momentum Drivers
• 215%+ price surge in 24 hours pushed the token into the spotlight.
• Founder Luke Barwikowski teased upcoming technology updates for the Pixels ecosystem.
• Trading volume surged over 7500%, showing strong speculative interest and liquidity influx.
⚠️ Risk Factors
• RSI is currently in the overbought region, meaning a short-term pullback is possible.
• If price loses $0.010–$0.009 support, the market could revisit deeper levels.
📊 Key Levels to Watch
• Resistance: $0.01822 → $0.02199 → $0.02757
• Support: $0.01459 → $0.01096 → $0.00946 demand zone
➖➖➖➖➖➖➖
🧠 Summary
BINANCE:PIXELUSDT is currently in a strong momentum phase fueled by gaming narrative hype and speculative volume.
As long as the $0.009–$0.010 support region holds, the trend structure remains bullish with potential continuation toward $0.018+.
PIXELUSDT — Futures Squeeze Imminent and Spot DeceleratingPrice is at 0.01665 and the futures-to-spot ratio is 19.36x High. Spot dollar volume is 4.5B. Futures dollar volume is 87.16B. The signal stack has rotated to Extreme Breakout confirmation while the volume engine underneath it is running almost entirely on leveraged speculation — nineteen dollars of futures for every dollar of real spot participation.
Signal count is 50 green vs 8 red out of 112. Extreme BULL at 73.78% edge at 6.63x with EMA 8:0, DD/SS 11:0, C>T 13:1, pattern total 7:0. Ichimoku 11:2, candles 9:5 showing mild friction developing. Spread at 72.4% Extreme. No squeeze active but momentum is Bull↓ with Bollinger Width at 15.2% — the coil has fired and is now decelerating rather than accelerating.
Spot Z is 5.32 Climactic with a 1:5 ratio of 5.32 vs 6.14 — the short-term read is below the longer baseline, signaling spot momentum is fading from peak. Futures Z at 2.9 V.High. F+S Z at 2.92 V.High. Spot:Fut tagged Full Send. Momentum at -0.82 Decel confirms the move is losing energy on the real volume side.
Leverage is 18.42x High with percentile at 95.4% Ceiling. All-time maximum was 18.83x just 9 bars ago — this is peak leverage territory with minimal room to expand further. Price percentile at 94.6% Upper. Direction shows Bear Dom with Bull:Bear Z at -0.98 bear vs 2.54. Speculative short pressure is loaded against a price sitting at the top of its historical range.
OBV Z at 1.73 Outflow confirms distribution is active at these levels. Futures squeeze is IMMINENT at 17 bars of compression — Spec tag means this is futures-only compression with no spot confirmation. Sqz Divergence flagged as Fut Only Sqz (Spec). Liquidation is currently Clear but with leverage at the 95th percentile and futures-only squeeze building, the next move has asymmetric flush risk.
The honest read: the breakout confirmation is real and the signal count supports the structure. But spot momentum is decelerating at Climactic levels, OBV is in outflow, leverage is at 95% ceiling, and the only squeeze building is speculative futures compression with no spot backing. A 19x futures-to-spot ratio with Bear Dom direction means price is being held up by leverage, not carried by buyers. The 9.5% bounce target with 2.7x BO is achievable, but the futures squeeze resolution at these conditions is more likely to flush longs than extend them. Ceiling at 15.78σ remains the line.
Is That Crypto Pump Real? Data Says No. Here's Why.
Stop Losing Money to Fake Volume. Find Real Moves Now.
Trade the REAL Crypto Volume. Stop Getting Faked Out.
PIXELUSDT Forming Falling WedgePIXELUSDT is currently forming a bullish falling wedge pattern, which is one of the most reliable reversal signals in technical analysis. The price action has been consolidating within narrowing trendlines, and with good trading volume starting to appear, a breakout move is highly anticipated. This setup suggests that bullish momentum is building, and a sharp rally could soon follow once resistance is broken.
The potential upside for PIXELUSDT is projected in the range of 70% to 80%+, offering traders and investors a strong risk-to-reward opportunity. The breakout from this falling wedge pattern is supported by improving market sentiment, which often leads to aggressive buying pressure. Such technical breakouts are typically accompanied by significant price surges, especially when volume confirms the move.
Investors are increasingly taking interest in the PIXEL project, which further strengthens the bullish outlook. The combination of strong chart structure, positive momentum, and rising attention toward this asset makes PIXELUSDT a crypto pair worth monitoring closely in the coming sessions. A decisive breakout could pave the way for a strong upward continuation trend.
✅ Show your support by hitting the like button and
✅ Leaving a comment below! (What is You opinion about this Coin)
Your feedback and engagement keep me inspired to share more insightful market analysis with you!
It's a time for PIXEL. 50% potential profit - 0.05 USDThe analysis of the PIXELUSDT chart suggests a potential price increase in the near future to 0.05 USD. Based on the provided TradingView chart, after a period of declines in June 2025, when the token's price fluctuated around 0.055 USD, it has stabilized around 0.034 USD by mid-August, indicating the formation of a bottom and a possible trend reversal. The moving average lines (MA 5, 10, 70, 100) show that shorter averages are approaching longer ones from below, which is a classic bullish crossover signal foreshadowing a rebound. Additionally, recent candlesticks exhibit increased buying activity, with green bodies dominating over red ones, indicating growing upward momentum. Trading volume appears to be rising at the lower part of the chart, which confirms investor interest and could lead to a breakout above the 0.04 USD resistance level. Considering these technical indicators, combined with the general market sentiment in the cryptocurrency sector, a rapid rise to 0.05 USD is expected within the next few days or weeks, provided the support at 0.034 USD holds.
Potential TP: 0.05 USD
PIXEL/USDT +200%Has been in a prolonged downtrend for over 500 days, dropping nearly 98% from its all-time high. Now, price action is showing early signs of a potential reversal, with volume picking up and structure stabilizing at the lows.
This could mark the end of the macro downtrend, offering a rare opportunity to position early for the next cycle. From the current market price, the setup presents a potential +200% upside, as PIXEL begins to recover lost ground.
PIXELUSDT 1D#PIXEL — Breakout Zone Ahead 🔥
#PIXEL is trading inside a Descending Broadening Wedge on the daily chart and is currently testing a strong resistance cluster — made up of the wedge resistance, the Ichimoku cloud, and the daily MA50.
A confirmed breakout above this zone could trigger a bullish rally toward the following targets:
🎯 $0.05587
🎯 $0.06620
🎯 $0.07898
🎯 $0.09766
🎯 $0.11634
⚠️ Always use a tight stop-loss to manage risk and protect your capital.
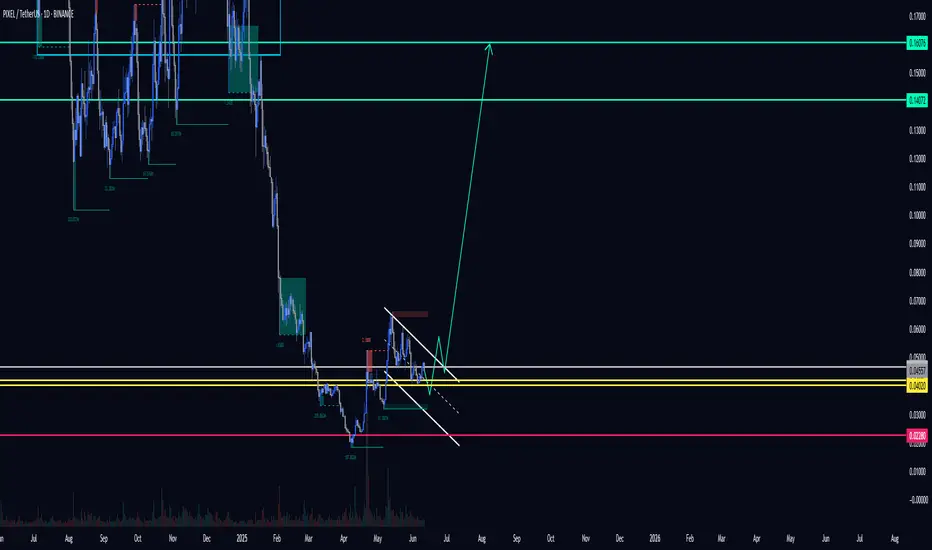
PIXEL 1D. High-Risk, High-Reward Setup. Here's the Play. 06/11BINANCE:PIXELUSDT
Entry opportunity for the bold.
EP (Entry Point): 0.04215$ – 0.04020$
TP (Take Profit):
1️⃣ 0.14072$
2️⃣ 0.16076$
SL (Stop Loss): 0.02280$ or according to your personal risk management.
❗️No stop loss on spot — manage accordingly.
DYOR. Always know your risk.
PIXELUSDTThe outcome of this analysis is that based on the structure of a zero - D wave, which may be a pig or triangle, or even a pig, we should look for the optimal areas to buy Spot …
In the event that this analysis is correct, it may be ideal to purchase Spot in the vicinity of Beijing to the tribes.
A cautious target for the Chinese outbreak and a more risky target could be a dollar casualty.
In time terms too, mid - June and more accurately the beginning of the third week of June would be the ideal approximate time for the start of the DC wave …
As indicated in the chart late July and early September are important times in the chart that will probably work depending on the structure and my guess is that the mentioned times are the ideal time for the end of the larger D - wave …
PIXEL Breakout Alert: Ready for the Next Leg Up?🚀 PIXEL Breakout Alert – 100% Potential Incoming?! 👀🔥
Hey Traders! If you're all about high-conviction plays and real alpha, smash that 👍 and tap Follow for more setups that actually deliver! 💹💯
PIXEL has broken out from a bull flag on the 4H timeframe after consolidating for weeks. This clean breakout signals a potential trend reversal with strong upside momentum building. 💥
Trade Setup:
👉 Entry: $0.0380–$0.0400 (post-breakout zone)
🎯 Targets:
$0.0455
$0.0520
$0.0630
$0.0770
🛡 Stop-loss: $0.0360 (below channel re-entry)
Why I Like It:
Clear breakout of the falling channel
Strong volume surge confirms momentum
Previous 100% move shows solid potential
If BTC stays stable, this one looks set for a strong run! 🚀 Keep it on your radar.
PIXEL price analysisOKX:PIXELUSDT price broke through the downward trend line on more than decent trading volumes, just as the TA canons require.
#Pixel capitalization is only $30 million
For comparison, at its highs a year ago, the #Pixels market cap was around $700-800mn.
✔️ The main task now is to keep the price above the trend line.
As soon as this is done, we can immediately aim for short-term growth to $0.055 and $0.075
And in the medium term - $0.135 or even $0.30
_____________________
Did you like our analysis? Leave a comment, like, and follow to get more
PIXEL - PIXELUSDT CHART ANALYSİSDiscover what an NFT is and what all the hype is that's surrounding the space.
An NFT, or non-fungible token, is a unique, digital certificate stored on a blockchain. This guarantees the originality of any item, giving the owner exclusive rights to it. Such tokens cannot be discreetly tampered with, split, or replaced because of the nature of the blockchain structure and anonymous encryption technology.
Therefore, this system is best suited for securing rights to a unique object — a work of art, real estate, an artifact in a computer game, or something similar. This article will help you understand the peculiarities of the NFT concept and learn about the most expensive and unusual non-fungible tokens since their creation.
Revenant! PIXEL, which has been in hibernation for a long time, has grown significantly in recent days. But now there are three serious obstacles to further growth: 1. It is struggling with the POC; 2. SMA is likely to suppress his movement; 3. RSI is extremely over bought. If it goes through these three obstacles, ~$0.12 is at hand. Otherwise, it may touch ~$0.4050, ~$0.35, and ~$0.29 again.
Breaking: $PIXEL Surged 55% Today Amidst Growing Momentum Pixelverse a Social-Fi altcoin lunched on the Ethereum blockchain has experienced a notable uptick in price today, surging nearly 60% amidst growing momentum.
What is Pixels?
Pixels (PIXEL) is a captivating blockchain-backed game that immerses players in a world of farming, exploration, and creation. This social casual web3 game, powered by the Ronin Network, offers a unique blend of digital collectibles and in-game currencies, fostering a vibrant and active community.
At the heart of the Pixels ecosystem is PIXEL, the native utility and governance token. PIXEL serves multiple functions within the game, enhancing the player experience through various features.
Technical Outlook
As of the time of writing, NGM:PIXEL is up 54% trading within a bullish reversal price movement. the asset's 4 hour price chart reveals a bullish Harami candle stick pattern which when accompanied by a strong fundamental, is a strong bullish pattern.
Since Listing, the asset has seen a +152.27% rise in price before losing almost 95% of market value. With growing momentum as hinted by the RSI at 89, NGM:PIXEL is well ready for a comeback with a move to reclaim the $700 million market.
As per data from CMC, NGM:PIXEL has seen a 609.92% surge in 24 hours trading volume today, that is insane given the asset has since being oversold constricting itself to a falling wedge. A break above the $0.05 could be the catalyst NGM:PIXEL needs for a comeback.
Similarly, should NGM:PIXEL fail to pull that stunt, a break below the $0.040 support could be a big problem for the social-fi token.
PIXEL (SPOT - INVEST) BINANCE:PIXELUSDT
PIXEL / USDT
1D time frame
analysis tools
____________
SMC
FVG
Trend lines
Fibonacci
Support & resistance
MACD Cross
EMA Cross
______________________________________________________________
Golden Advices.
********************
* Please calculate your losses before any entry.
* Do not enter any trade you find it not suitable for you.
* No FOMO - No Rush , it is a long journey.
Useful Tags.
****************
My total posts
www.tradingview.com
PIXELUSDT - two scenario / i believe in firstfalsely stabbed a level, removed the liqviditi, price came to the trendline, etc.
and you can safely made returning price to level and removing the stop loss for long players
if you like the idea, please "Like" it. This is the best "Thanks!" for the author 😊 P.S. Always do your own analysis before a trade. Put a stop loss. Fix profits in installments. Withdraw profits in fiat and please yourself and your friends.
#PIXEL (SPOT) IN ( 0.1200- 0.1450) T.(0.4799) SL(0.1182)BINANCE:PIXELUSDT
#PIXEL / USDT
Entry ( 0.1200- 0.1450)
SL 1D close below 0.1182
T1 0.1700
T2 0.2700
T3 0.3499
T4 0.4799
1 Extra Targets(optional) in chart, if you like to continue in the trade with making stoploss very high.
______________________________________________________________
Golden Advices.
********************
* collect the coin slowly in the entry range.
* Please calculate your losses before the entry.
* Do not enter any trade you find it not suitable for you.
* No FOMO - No Rush , it is a long journey.
Useful Tags.
****************
My total posts
www.tradingview.com
**********************************************************************************************
#Manta #OMNI #DYM #AI #IO #XAI #ACE #NFP #RAD #WLD #ORDI #BLUR #SUI #VOXEL #AEVO #VITE #APE #RDNT #FLUX #NMR #VANRY #TRB #HBAR #DGB #XEC #ERN #ALT #IO #ACA #HIVE #ASTR #ARDR #PIXEL #LTO #AERGO #SCRT #ATA #HOOK #FLOW #KSM #HFT #MINA #DATA #SC #JOE #RDNT #IQ #CFX #BICO #CTSI #KMD #FXS #DEGO #FORTH #AST #PORTAL #CYBER #RIF #ENJ #ZIL #APT #GALA #STEEM #ONE #LINK #NTRN #COTI #RENDER #ICX #IMX #ALICE #PYR #PORTAL #GRT #GMT #IDEX #NEAR #ICP #ETH #QTUM #VET #QNT #API3 #BURGER #MOVR #SKL #BAND #ETHFI #SAND #IOTX #T #GTC #PDA #GMX #REZ #DUSK #BNX #SPELL #POWR #JOE #TIA #TFUEL #HOT #AVAX #WAXP #OGN #AXS #GALA #ONE #SYS #SCRT #DGB #LIT #QI #FIL #GLMR #ATOM #LTC #MANA #ONT #TLM #SLP