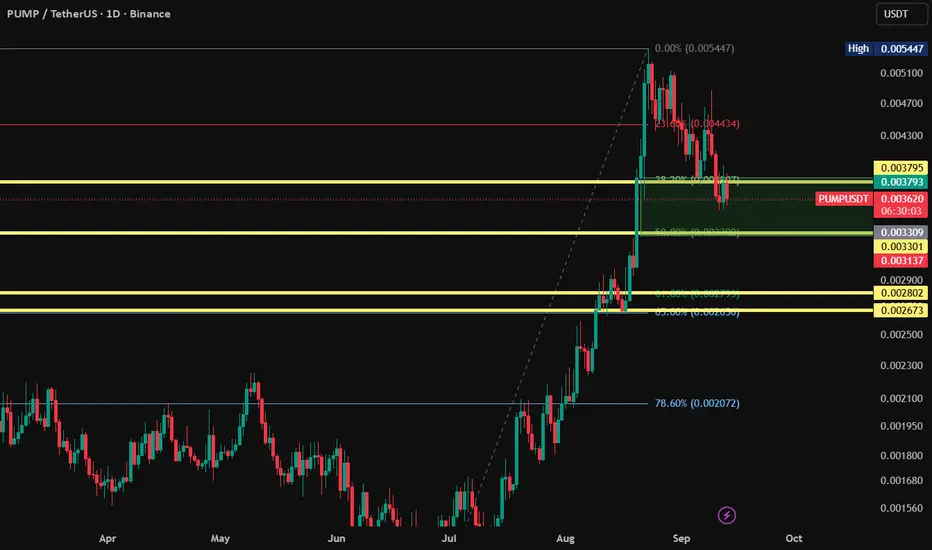
$0.0060 next, or are you taking profits from PUMP, here?Hi,
PUMP has exploded more than 370% in just two months and is now trading near its highest levels of the past 10 months. But honestly, I don’t think this move is finished yet. The key level now is $0.0048. If PUMP breaks this major monthly resistance and turns it into solid support, I see another leg higher ahead. My short-term target: $0.0060.
PUMP holders:
BREAKOUT or BRUTAL REJECTION?
Who has the guts to HOLD above $0.0048?
In-depth trading ideas
$PUMP: Whales vs retailBYBIT:PUMPFUNUSDT.P
Interesting situation with this coin. Chart formed a bearish structure, and retail is naturally all in shorts.
But if you look at monthly consolidation levels 📊M-Levels, situation looks different. Reversal formation is visible.
🧩IMA analysis shows 🐋large players are not about to flip short. On the contrary, been building positions the last few days.
My take: if retail is shorting, plus monthly levels show a reversal, odds of pushing higher and breaking the August high are v
PUMP Bullish Correction ?PUMP price action has recently rejected from a key higher-timeframe daily resistance level, signalling that sellers remain active around this zone. Following the rejection, price has moved back into a defined range between established daily support and daily resistance.
As long as PUMP continues to trade within these boundaries, the higher-probability scenario is further range-bound price action before the market establishes its next directional move. Traders should avoid assuming a breakout wh
PUMP — Long-Term Accumulation + Buyback EngineHey Traderssss :-D
PUMP — Long-Term Accumulation + Buyback Engine 🚀
PUMP, the native token of Pump.fun, is an interesting setup because the chart is transitioning from a long accumulation structure into a potential markup phase, while the underlying protocol already generates substantial revenue.
📊 Technical Structure
Current price: ~$0.00574
Immediate support: ~$0.00555
Major support: ~$0.00341
Structural support: ~$0.00240
Key resistance: ~$0.00755
Major breakout zone: ~$0.00885–0.00900
Ma
PUMPUSDT Forming Bullish MomentumPUMPUSDT is forming a clear bullish momentum pattern, a classic bullish reversal signal that often indicates an upcoming breakout. The price has been consolidating within a narrowing range, suggesting that selling pressure is weakening while buyers are beginning to regain control. With consistent volume confirming accumulation at lower levels, the setup hints at a potential bullish breakout soon. The projected move could lead to an impressive gain of around 70% to 80% once the price breaks above
Pump.fun (PUMP): Correction or the Beginning of the Next Move?The best part of a correction is not catching the exact bottom — it is knowing where the market must prove itself.
PUMP is still moving inside a descending corrective channel on the 4H chart.
Price has now reached an important support / pullback zone, which makes this area interesting for a possible long setup.
But I don't want to chase the first green candle.
There are two possible ways to approach this setup:
Setup
Scenario 1 — Buy the Pullback
Price holds the marked support zone arou
PUMPFUN: Bullish Setup with Tight Support and Upward MomentumBYBIT:PUMPFUNUSDT.P
PUMPFUN — Long
Stop loss: 0.00501
Take profit: 0.005327
The Aroon Up is at a solid 100, indicating a strong upward trend with no signs of weakening yet 🚀. The Parabolic SAR at 0.0047 supports this bullish trend as the price stays above the SAR line, reducing the risk of a reversal happening soon. Meanwhile, both SMA20 at 0.0050 and SMA50 at 0.0050 align closely, converging with the price at 0.0052, which suggests strong local support as the SMA levels are below c
The prince of crypto-market : #PUMPFUNTopic: Opening a long position on the PUMPFUN (PUMPUSDT) asset.
Investment horizon: 24–36 months (targeting 2030).
Recommendation: Accumulate / Long-Term Hold
Target Price Range (TPR): $0.012 – $0.024 Current Price: ~$0.004
Section 1. Basic information.
The total supply of 1 trillion tokens. 164.5 billions was burned or 16.5%.
PUMP - is a deflationary asset, with a deflation rate of 8% average per year. The project distributes over 90% of its income to token holders through buybacks. Average
PUMP Nears Key Support After Pullback — Bulls Eyeing a Bounce?After the recent correction, PUMP is now approaching key support zones — and the chart sets up a bullish scenario from here.
🔹 Timeframe: 1D
📍 Entry Zones:
✔️ Step 1: 0.0037
✔️ Step 2: 0.003022
🎯 Targets:
➕ 0.00450
➕ 0.00500
➕ 0.00560
⚠️ A confirmed close below $0.0025 would invalidate this scenario.
1H BnB building on PUMP⚛️ HTF Context 🔭
NYSE:PUMP is holding above the prior week’s high, I took an entry off the 1m Bullflag above PWH.
Price is now starting to push toward a potential daily breakout from the cup and handle structure.
LTF Structure 🧱
The bull flag gave me the entry. But on the 1H, a Base & Break 1 is forming, which could provide the next continuation structure if price holds its levels and buyers stay active.
Cycle Position ♻️
Daily cup and handle breakout watch, with a 1H BNB1 developing ben
PUMP/USDT 4H — LONG SETUPPUMP/USDT — 4H Long Setup
🟦 Entry Zone: $0.003854 – $0.003896
This zone combines multiple technical confluences:
🔹 Fibonacci Golden Zone — 61.8%–65% retracement
🔹 Resistance → Support flip
🔹 Ascending channel structure
🔹 Horizontal support
🔹 Fibonacci retracement confluence
🎯 TP1: $0.004192
🎯 TP2: $0.004392
🎯 TP3: $0.004635
🎯 TP4: $0.005061
🎯 TP5: $0.005442
🛑 Invalidation: below the key support structure around $0.00370
Key idea:
Golden Fib + Support/Resistance Flip + Channel + Horizontal
pumpusdtWe’re looking at the PENDLE chart on the daily timeframe 👇🏻
If we get a weekly close above the volume area marked on the chart — the red line — that would be a very important signal for me and would make me more bullish on the continuation of this move.
PENDLE has also picked up some solid momentum over the past two days, and I’ve marked the upcoming targets on the chart.
There’s also a bearish scenario to consider: if the 0.033 support gets lost, my bullish scenario would temporarily enter a
PUMP — Bullish Flag Formation | Key Resistance & Breakout Level?⏱️ Time Frame: 12H
💱 Pair: PUMP/USDT
📍 Exchange: MEXC
📈 Pattern: Bullish Flag
🎯 Current Price: approximately 0.00422 USDT
---
🔎 CHART ANALYSIS
PUMP/USDT appears to be forming a Bullish Flag pattern after previously experiencing a strong upward move. This structure indicates a phase of consolidation/correction following a bullish impulse, with price moving within a channel that is gradually trending downward.
🔴 Upper resistance line → the main selling-pressure area.
🟡 Lower support line → the
$PUMP | 4H | BUY SETUP |BINANCE:PUMPUSDT : Why I'm Buying The Fear
While the retail crowd claims the Pump.fun engine has lost its steam and the token is dead, the 4h chart is printing a clean, technical retest of its primary buying block with an asymmetric 1:5 risk-to-reward setup. 🚨
Current Structure:
Price: $0.003932
Reaction: Consolidating in a minor -1.40% pullback from its local high of $0.003988 on Sep 17/18, following a breakout from its $0.003450 bottom.
Pattern: Bullish Order Block Retest.
Bias: Bullish
PUMP prive bullish selling ?PUMP price action is currently experiencing a rejection following a strong bullish rally, with the market now entering a potential retracement phase. After a sharp move higher, a pullback can allow price to consolidate and establish a higher low before attempting another leg to the upside.
The current support region is therefore an important area to monitor. As long as PUMP continues to hold this support, the broader short-term structure remains constructive and the possibility of a higher low
$PUMP: In a downtrend. Where to look for a reversal?BYBIT:PUMPFUNUSDT.P
Since early Sept, NYSE:PUMP is in a downtrend retesting 📊M-Levels resistance.
Nearest support 📊M-Levels is in the $0.003270–$0.003470 range. But 🧩IMA shows: no real capital inflow. 🐋Whale positions are purely speculative.
Strong support where price most likely goes is the $0.002640–$0.002945 range. Here we can already look at a long-term entry.
For quick trades, can open a short on a retest of 📊M-Levels resistance $0.003760 and the weekly level $0.004140. Target $0.002640
PUMP/USDTTitle:
🚀 PUMP/USDT: A High-Precision Golden Opportunity.. A Rare Technical Confluence That Doesn't Happen Often!
Analysis:
Hello everyone,
Major opportunities in the financial markets are always created at the intersection of powerful technical tools. Today, we have an exceptional trade setup on the PUMP/USDT pair on the daily timeframe (1D), backed by a complete arsenal of technical analysis and liquidity tools that elevate the trade's probability of success to high levels:
🔥 Why is this tra
PUMPUSDT: breakout needs a 4H close, not a chasePUMPUSDT is bouncing hard from the 0.00351-0.00361 4H demand zone, but it is still trading below the 0.00405-0.00413 supply band.
The daily chart remains corrective. The 4H is trying to form a base, while the 1H impulse arrived with strong volume but is already extended into resistance.
Bullish case: a confirmed 4H close above 0.00414, followed by a clean retest of 0.00405-0.00407, activates the long setup. The first target is 0.00455; 0.00487 is the extension.
Invalidation: acceptance below
PUMP - AnalysisPUMP - Analysis
After a crazy run, PUMP seems to be coming to an end.
PUMP has broke down from its bullish trendline that has held price for the past 2 months.
Soon, we'll see the support zone gets broken through too.
Watch out, it's going to be quite painful, as the rally is just as big.