PUMP: Huge Descending Wedge Formation, Bullish Continuation!Hello There,
welcome to my new analysis of PUMP from a 2-day timeframe perspective. In the current cryptocurrency market, some coins still show potential despite mixed signals in the medium and long term. Such altcoins have the potential to realize solid trading opportunities in the current market phase. With one of them being PUMP, I spotted bullish signs which should not be underestimated at the moment.
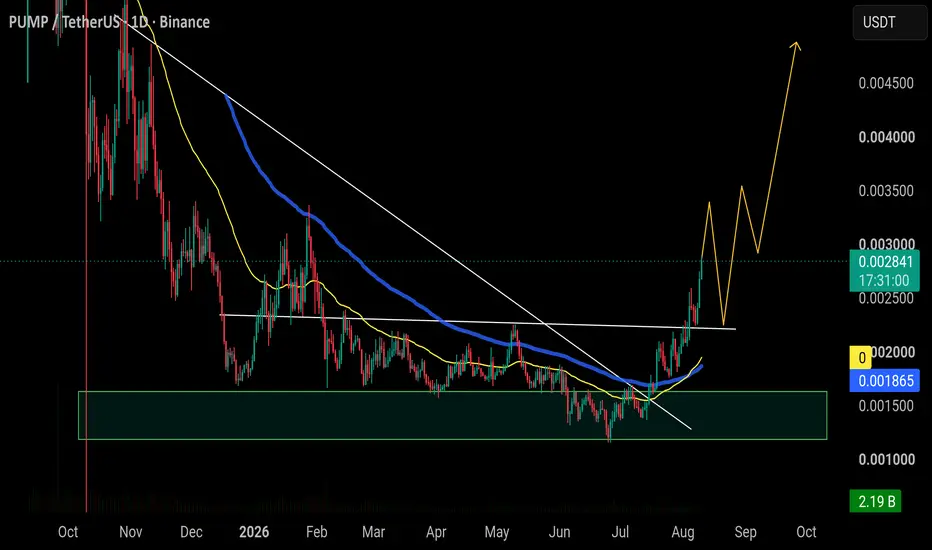
When looking at my chart now, we can see how PUMP recently completed this gigantic descending wedge formation with a major breakout above the upper boundary. It settled above the EMAs, and they now serve as major support. Since PUMP bounced within the boundary of the descending wedge, which matches the EMAs, this is a continuation setup that continues bullishly towards the upside with further bullish expansion potential.
The completion of this whole formation has activated the upper target zones as seen in my chart. Currently, PUMP is still in a continuing state with bullish accelerations towards the upside. With the current momentum holding, PUMP has a strong potential to even shoot above the final bullish target mentioned. With a growing network behind PUMP, there is also fundamental support for these bullish moves to consider in the upcoming times.
In this manner, thank you a lot for watching!
The support is highly appreciated.
VP
In-depth trading ideas
Pump is ready to dump hardHello Traders!
We can see structure is complete and PUMP is ready to reverse because of a reversal pattern after breakout. Current impulsive move in PUMP is also a form of reversal pattern soon it will dump hard.
We are selling/short in Pump from 0.002522
Stoploss 0.002692 (-6.9%)
Target 0.001983 (+21.2%)
My goal is to be recognized as one of the highest win-rate traders in the TradingView community. :)
Trade Analysis Based on
> Fibonacci Tool (A1000x Way) – Custom Fibonacci approach for precise market analysis
> Candlestick Patterns – Strong price action confirmation through key candle formations
> A1000x Breakout Strategy – Identifying and trading high-probability breakout setups
> HH, HL & LH, LL Strategy – Market structure analysis for clear trend direction
> Swing Points – Tracking key highs and lows for accurate price movement insight
> A1000x Stoploss Strategy – Strategic stoploss placement for effective risk control
> A1000x Target Strategy – Structured target setting based on price action
We trade using carefully developed strategies and disciplined market analysis, always seeking the best possible accuracy while remembering that ultimate success comes only by the will of Allah.
In some trades, you may notice a relatively larger stop loss or a risk-to-reward ratio that may appear unusual at first glance. However, every trade is taken with proper planning and calculated analysis, not random entries.
Before entering any position, we perform detailed calculations and market evaluation. Based on this analysis, we carefully determine our stop loss and target levels.
I personally apply one of my specialized stop-loss and target strategies, designed to place the stop loss at a logical market level where price is less likely to reach before moving toward the intended target — InshaAllah.
Trading always involves risk, but with discipline, patience, and proper strategy, we aim for consistent and responsible decision-making.
Feel free to share your thoughts or leave a comment.
PUMP: Retest Retest Confirms High-RR Bullish ExpansionPUMP: Successful Breakout Above $0.00225–$0.00230 Resistance Floor – Retest Retest Confirms High-RR Bullish Expansion
PUMP has flashed a sharp bullish trend confirmation signal, officially shattering a key resistance cluster to unlock higher price targets. The daily market structure is firmly established by a sequential series of higher highs and higher lows. Price action surging decisively above the dynamic MA100 trendline confirms that buyers have completely reclaimed market control from the bears.
Based on the visual data from the daily chart , the technical turning point occurred on August 4th when an aggressive bullish candle cleanly penetrated the $0.00225–$0.00230 resistance zone. Subsequently, on August 6th, price action executed a technical pullback to retest the newly converted support floor, triggering an immediate bullish bounce. This lower-wick rejection demonstrates that short-term profit-taking supply has been fully absorbed by incoming buy-side liquidity.
The current setup provides a high-probability trend-following Long execution opportunity. The optimal strategy is to initiate Long positions, establishing a tight stop-loss parameter directly beneath the broken resistance floor around $0.00220. This precise execution entry minimizes downside risk exposure while securing an elevated risk-to-reward (RR) ratio for the upcoming continuation wave.
Disclaimer: This is not financial advice, DYOR.
PUMPFUN Social Callouts LaunchNYSE:PUMP fun rolled out a "callouts" feature, allowing users to send real-time token alerts to followers, paired with zero-fee trading and cross-chain USDC integration. The update drove over $113 million in platform volume in 24 hours, signaling strong user adoption. This is neutral for PUMP because while it enhances platform utility and could increase fee revenue long-term, the token is not required to use the feature. The immediate price reaction was negative, highlighting a disconnect between product news and token valuation for utility tokens without direct fee accrual. On-chain analytics show Pump fun sold another 84,789 SOL (~$6.25 million) on August 7. This is part of its strategy to monetize protocol fees, bringing total sales to 4.82 million SOL (worth roughly $807 million). This is bearish for PUMP's ecosystem standing as it creates a persistent overhang of sell pressure on Solana, a core partner. It also underscores that the platform's revenue model is based on converting activity to cash rather than reinvesting in its own token's ecosystem. Pump fun is actively evolving its platform to boost engagement, but its native token remains weighed down by mechanical selling and a lack of direct utility. Will rising platform volume from new features eventually translate into sustainable demand for PUMP, or will dilution and sell pressure continue to dominate?
PUMP: Parabolic Surge Validates Prior OutlookPUMP: Parabolic Surge Validates Prior Outlook – Chasing Warning and Dual Low-Risk Long Entry Zones
PUMP has logged an impressive vertical expansion wave, officially confirming its bullish trajectory in exact alignment with our previous technical outlook. A strong sequence of green candles has pushed price action cleanly above former accumulation resistance barriers, holding firmly above the dynamic MA100 trendline. However, this parabolic surge has stretched market structure, creating a wide gap above underlying support cushions.
Based on the visual data from the daily chart , current market behavior increases the probability of short-term profit-taking retracements. Initiating fresh buy orders (FOMO Long) at these extended levels introduces severe drawdown risks. Strict risk management protocol requires patience to wait for a technical pullback to optimize trade execution.
This technical framework presents two high-edge Long entry zones for traders:
Scenario 1: Patiently await a cooling-off pullback to retest the broken resistance cluster around the $0.00260 handle.
Scenario 2: Await a deeper dip retesting the primary ascending trendline support cushion near the $0.00240 level.
Both entry scenarios deliver an exceptionally tight stop-loss parameter with superior risk-to-reward metrics.
Disclaimer: This is not financial advice, DYOR.
Pump Must pay the PriceHello Traders!
Recently we got hit the stoploss but this the formation is complete. It is ready to fall hard. Pump will pay the price for extra rise.
We are shorting Pump from 0.0028
Stoploss 0.002991 (-6.5%)
Target 0.001982 (+29.2%)
My goal is to be recognized as one of the highest win-rate traders in the TradingView community. :)
Trade Analysis Based on
> Fibonacci Tool (A1000x Way) – Custom Fibonacci approach for precise market analysis
> Candlestick Patterns – Strong price action confirmation through key candle formations
> A1000x Breakout Strategy – Identifying and trading high-probability breakout setups
> HH, HL & LH, LL Strategy – Market structure analysis for clear trend direction
> Swing Points – Tracking key highs and lows for accurate price movement insight
> A1000x Stoploss Strategy – Strategic stoploss placement for effective risk control
> A1000x Target Strategy – Structured target setting based on price action
We trade using carefully developed strategies and disciplined market analysis, always seeking the best possible accuracy while remembering that ultimate success comes only by the will of Allah.
In some trades, you may notice a relatively larger stop loss or a risk-to-reward ratio that may appear unusual at first glance. However, every trade is taken with proper planning and calculated analysis, not random entries.
Before entering any position, we perform detailed calculations and market evaluation. Based on this analysis, we carefully determine our stop loss and target levels.
I personally apply one of my specialized stop-loss and target strategies, designed to place the stop loss at a logical market level where price is less likely to reach before moving toward the intended target — InshaAllah.
Trading always involves risk, but with discipline, patience, and proper strategy, we aim for consistent and responsible decision-making.
Feel free to share your thoughts or leave a comment.
$PUMP looking ready After months of trading near the bottom, pNYSE:PUMP looking ready 👀🔥
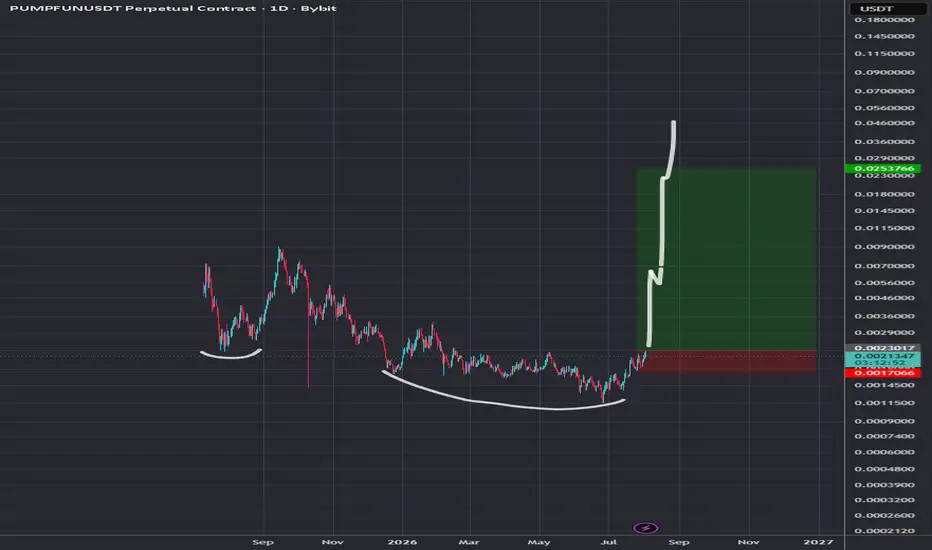
After months of trading near the bottom, price has finally broken above the major resistance and started moving.
As long as it holds the breakout, I’m watching $0.0035 → $0.0040 → $0.0048 next.
This one could get interesting if the momentum stays strong. 🚀
PUMP USDT SHORT SIGNAL#47. PUMP/USDT – Trade Setup (SHORT)
📈 Position Type: SHORT
🕒 Timeframe: 1H
📊 Market: Futures
💰 Entry Zone:
0.002717
0.0028
🛑 Stop-Loss:
0.002952
🎯 Take-Profit Targets:
• TP1: 0.002650
• TP2: 0.002540
• TP3: 0.002444
• TP4. 0.002320
Tp5.
⚙️ Leverage:
5*
▫️ After TP1, move SL to Entry + 0.2%.
▪️ Exit Plan:
• 40% at TP1
• 20% at TP2
• 20% at TP3
20% at TP4
📌 Risk Management:
Risk only 1–2% of your capital per trade.
⚠️ Always check and confirm the setup on your chart before entering the trade.
PUMPUSDT Showing Strong Accumulation StructurePUMPUSDT is developing a compelling base formation, suggesting a possible imminent rally. Price is currently reacting within a key accumulation zone, where early positioning remains strategic. The structure hints at underlying strength, with momentum gradually shifting in favor of bulls.
If the current support zone holds, the setup favors a multi-leg rally. Immediate targets have been mapped for short-term profit-taking, while extended projections align with the final breakout objectives.
Plan: Accumulate within the marked zone and monitor price reaction closely. A break above the immediate neckline will validate continuation toward midterm and final targets.
PUMP Strong Rally Pushes Price Into Key Resistance ZonePrice continues to maintain a strong recovery structure, trading inside an ascending channel with consistent higher highs and higher lows. The recent move has pushed price toward the upper boundary of the channel, where a breakout attempt could determine the next direction.
A confirmed breakout above the current resistance area could open the path toward further upside, while rejection from the channel top may lead to a short-term pullback toward the nearby support zones.
Key levels:
🟢 Support: 0.00218 → 0.00204
🔴 Resistance: 0.00278 → 0.00337
📈 Bullish scenario: Holding above 0.00218 and breaking the channel resistance could continue the upward move.
📉 Bearish scenario: A rejection from the upper channel may trigger a retest toward lower support before the next attempt.
PUMP FUN MANIA [LONG] GEM signal I've been watching this chart quietly for months and it is finally breaking out.
This project is not just a nothing burger meme coin. It is a meme coin creation platform for Solana and is already top 50 rank on Coinmarketcap.
In an ALT szn regime, this is the best candidate to buy and hold until this bull rally is over!
see dominance chart and other supporting evidence below!
🧠DATA DRIVEN signals
FOLLOW and LIKE for more high quality BACKTESTED signals from proprietary ML grade models, capable of accurately inferring phase, amplitude and likelihood unlike any mechanical indicator out there.
#PUMPUSDT D#PUMPUSDT D
#PUMP
If the red zone at 0.0031–0.0034 gets engulfed and price consolidates above it, PUMP could continue its bullish move.
For now, if you get confirmation at any of the blue zones, you can enter a long position.
The target for now is the red zone.
How do you get confirmation?
Check out the “Types of Triggers” post in the channel.
NYSE:PUMP
Degens Aping, Platform Printing and The $PUMP Pumping The Meme Casino Just Hit the Nitro Button
Looks like the degens found the buy button again.. PUMP is absolutely sending it, and this time it's not just because someone posted a Pepe with laser eyes. After weeks of getting farmed by paper hands, the token finally caught a wave of fresh hype as traders started rotating back into Solana meme plays
The biggest fuel behind this pump is the growing optimism around Pump. fun's ecosystem
Despite the meme coin market cooling off earlier this year, the platform continues to dominate Solana's token launch scene, generating massive trading activity and protocol revenue. Investors are betting that if meme season returns, Pump .fun will be one of the biggest winners. Basically, people aren't buying the token they're buying a ticket to the degen casino before the crowd shows up
On top of that, crypto sentiment has improved across the board. Bitcoin holding strong and Solana gaining momentum have pushed traders further out on the risk curve. When blue chips stop moving fast enough, degens naturally migrate to high beta plays like PUMP, hoping to catch the next ridiculous candle before Crypto Twitter starts posting rocket emojis every five seconds
Of course, let's not forget the classic crypto recipe, low float momentum, leveraged longs piling in, influencers shilling "early entry," and shorts getting absolutely liquidated into oblivion
Whether this turns into a full blown giga pump or just another exit liquidity event depends on whether buyers can keep the volume flowing. Until then, the meme machine is alive, the casino is open, and someone's portfolio is either going to Valhalla..or straight to McDonald's🍟
PUMP Surges 20% — Is Another 5% Rally Still Ahead?PUMP ( BINANCE:PUMPUSDT ) has surged nearly 20% over the past 24 hours, supported by both fundamental catalysts and a major technical breakout.
Can PUMP extend its rally, or is a temporary pullback approaching?
Key Catalysts
• BOOST Buybacks: Continuous buybacks helped absorb part of the selling pressure following the recent token unlock.
• Spot-Led Demand: Open Interest declined while price moved higher, suggesting that the rally was driven mainly by spot buying rather than excessive leveraged positions.
• Technical Breakout: PUMP broke above its multi-month Descending Channel with significantly higher trading volume, attracting new liquidity and momentum traders.
Technical Analysis
On the 4-hour time frame, PUMP is currently approaching the Resistance Zone, Resistance Lines, and Cumulative Short Liquidation Leverage($0.002230-$0.002186).
From an Elliott Wave perspective, PUMP appears to be completing its main wave 5. The price could temporarily break above the Resistance Lines before reaching its final top.
I expect PUMP to continue its bullish move and gain at least another +5%.
However, after reaching the Resistance Lines and Cumulative Short Liquidation Leverage, the token could experience at least a temporary pullback.
Cumulative Long Liquidation Leverage: $0.001958-$0.001915
Key Trading Level: $0.00200-$0.001970
Do you think PUMP can break above the Resistance Zone before a pullback?
🟢 Yes
🔴 No
📌 PUMP Analysis, 4-hour time frame.
🛑 Always use proper risk management and set a Stop Loss(SL) for every position.
🚀 If this analysis helps your trading plan, a BOOST would help more traders discover it.
PUMP.FUN / 4H — What happens when you tune VDS to the assetDefault settings work well across most assets. But VDS has another side — it's fully customizable per asset, timeframe, and exchange.
This chart is the result of that. Five signals. Every single one landed at a meaningful turning point — two SELL signals at local tops, two BUY signals at the lows, and a fresh SELL firing right now.
A full breakdown of how I approach custom tuning is coming soon.
Gamble or vision?Curious, what do you think of pump at this point the volume is picking up? The real profit of crypto is coming from two sources:
1. Hyper liquid
2. Pump fun, which means that they really make a profit and invest 50% back into the business by buying those tokens.
Based on that, we're betting on picking up more volume in crypto. Especially In MEME area it is a high chance but it stays a gamble.
PUMP SCREAMING UNDERVALUED RIGHT NOWPump fun has bought back and burned ~40% of supply
Pump is screaming undervalued at 500M Cap
1M+ USD in revenue every day. Every single day
New Go Bounty Feature..
A platform generating daily revenue higher than 99% of projects in crypto
Sitting in the top 6 for revenue across the entire market
It has potential to do very well when fundamentals actually start acting as Catalyst
PUMP: Cup and Handle Pattern CompletedPUMP: Cup and Handle Pattern Completed – Triggering a Bullish Breakout Wave with Superior Risk-Reward
PUMP has just issued a highly impressive bullish signal by officially confirming the completion of a textbook Cup and Handle chart pattern. Following a curved accumulation phase forming the cup base to absorb overhead selling pressure, the price action executed a minor corrective dip to construct the handle, before decisively breaking above the neckline resistance barrier. The sheer dominance of buying volume at the breakout point demonstrates that the bulls are in total control.
Based on the visual data from the 1-hour chart , the projected upside target for this breakout wave is measured equivalent to the vertical depth of the cup. The fact that the price holds firmly above the newly converted resistance floor alongside the dynamic MA100 trendline support confirms a solid structural foundation, unlocking substantial room for upward expansion in the short term.
This current technical setup delivers an exceptional Long trading opportunity with an elevated risk-to-reward (RR) ratio exceeding 4R. Traders can trigger trend-following buy orders while placing a tight stop-loss just below the handle support structure to protect capital efficiently. Nevertheless, strict adherence to disciplined risk management remains paramount regardless of market conditions.
Disclaimer: This is not financial advice, DYOR.
$PUMPUSD 3RD WAVE PUMP LOADING? (Don't Miss This Setup!)NYSE:PUMP 3RD WAVE PUMP LOADING? (Don't Miss This Setup!) 🚀
Looking closely at the 4H chart, NYSE:PUMP has already bounced off this rising trendline support twice before. Right now, price is pulling back down to test that exact same green support line again. If buyers hold this trendline for the 3rd time, we are expecting a massive third-wave pump straight toward those higher targets drawn on the chart.
This setup gives us a super clean, high-probability entry as price comes down to retest support. RSI is resetting nicely during this pullback, coiling up for the next big leg up. As long as this trendline holds, the momentum favors a sharp bounce, giving traders a solid risk-to-reward ratio right off the line.
⚠️ LONG SETUP INVALIDATION: Our bullish idea is completely invalid if a 4-hour candle closes firmly below the rising support trendline, or if price breaks down and fails to reclaim it on a retest.
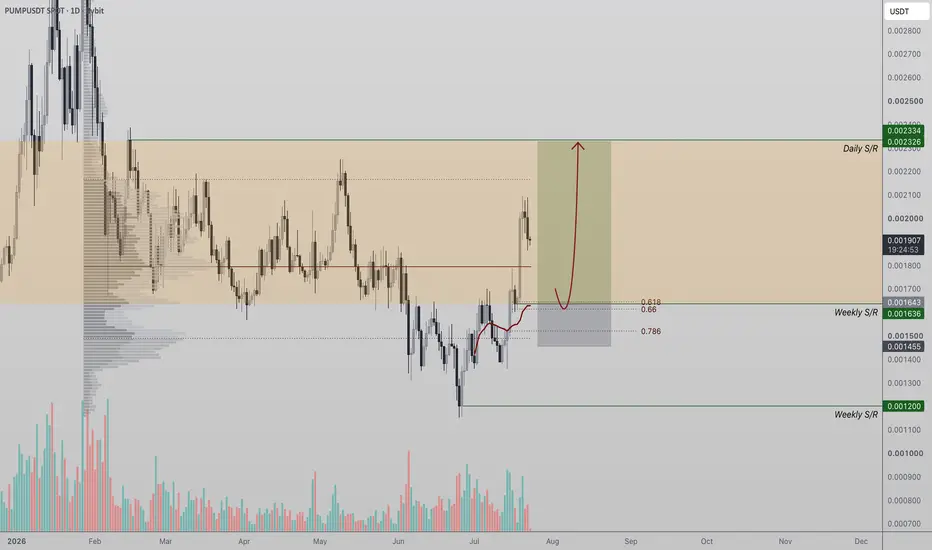
PUMP Eyes Key SupportPUMP is showing encouraging signs of strength after reclaiming the range Point of Control and holding firmly above weekly support.
This reclaim is an important technical development, as it suggests buyers have regained control of the current trading range and are attempting to establish a foundation for further upside. Remaining above this weekly support is critical, as it reinforces the short-term bullish structure and increases the probability of continued higher prices.
The ideal scenario from here would be a controlled bullish retest of the reclaimed support. If price revisits this region and successfully forms a higher low, it would confirm that the previous breakout is holding while also filling the market inefficiency created by the recent impulsive move higher. This type of price action often strengthens the trend by allowing buyers to re-enter before the next leg higher.
Adding to the bullish outlook is the strong technical confluence surrounding the current support zone. The weekly support aligns closely with the VWAP, the 0.618 Fibonacci retracement, and the reclaimed Point of Control, creating a high-conviction demand area. When several technical indicators converge at the same level, the likelihood of a meaningful market reaction increases.
As long as PUMP continues to hold this confluence zone, the probability favours a continuation toward the next daily resistance. Maintaining this structure would preserve the broader range while supporting a sustained bullish outlook in the sessions ahead.