QNT Main Trend. Triangle. Distribution. January 2026Time frame: 1 week. After a 147,000% pump, a large symmetrical triangle forms in the distribution zone (this is possible due to the limited supply of only 14.88 million coins, and the concentration of the bulk of the volume among the creators). Reversal zones and percentages to key support/resistance levels are shown.
In-depth trading ideas
QNT | 26' Q2 | May wk20 | 4hr TimeFrame** T.A explained **
Multiple Time-Frame Analysis; Color Code | Strength favors the higher timeframe.
Yearly timeframe = black
Monthly timeframe = pink
weekly = grey
daily = red
4hr = orange
1hr = yellow
15min = blue
5min = green if they are shown. (Level visibility on intervals is set to timeframe the level was found on and below to keep chart view organized.)
Ranges defined
A Range = two or more consecutive color candles (2+ in a row, same color creates a range)
There are two types of ranges - Accumulation Ranges &
Distribution Ranges.
*A single candle is a range on a lower timeframe. Mark the candle and then find the range / level on a lower timeframe aka "Range Finding".
Some people use boxes and call this boxing finding the zone - supply & demand zones - and marking the entire range top to bottom. This is acceptable but introduces risk by increasing probability of orders getting filled.
Candle Science further defines the zone / range into levels. So. after finding a range, identify and label the first and last candle of the range.
This is Candle Science. Everything has a default expectation and users thinking is guided by IF/THEN statements.
Below are the default expectations for each range and the first and last candle within the range.
DISTRIBUTION RANGES:
When price is above a distribution range its default expectation is to support price accumulation.
The first distribution candle in a distribution range is labeled as the BackSide Candle (BS).
Expectation = strong reaction to price. Look for price action to create long wicks reaching to or away from level. A steep angle trend is expected to form so Fair Value Gaps are expected to form on the timeframe of the level and lower timeframes.
If a steep angle trend is not forming, and long wicks are not being created then the idea is that liquidity is not there, confidence in the level is low. Price Action may then be looking for more liquidity to and seek it out at the FrontSide Candle.
FrontSide (FS) Candle = The last distribution candle in a distribution range.
Expectation = create a low angle accumulation trend reversal.
3 bar reversal patterns laddering up
like the distribution candles are the rungs of an accumulation ladder. price uses the top side of the BackSide Candle or the top side of the FrontSide Candle as support. They are used in bull flags to break distribution trends.
IF price fails to gain a BackSide or FrontSide level THEN they act as RESISTANCE. But we will then train our eyes to look at the bottom side of Accumulation Ranges because they have a default expectation as Resistance.
When Price is below an accumulation candle, the bottom side of the accumulation candle is the level of resistance.
ACCUMULATION RANGES DEFINED:
Inverse BackSide Candle (Inv.BS) = the first accumulation candle in an accumulation range.
Expectation. = strong reaction to price. long wicks reaching to or away from level. Creates a steep angle distribution trend. Usually create F.V.G's and impulsive, volatile moves like the BackSide Candle.
Inverse FrontSide Candle (Inv.FS) = The last accumulation candle in an accumulation range.
Expectation = reversal, create a low angle distribution trend. The bottom side of the accumulation candles are used as resistance levels.
TOOLS USED:
Boxes - used to define a zone by marking the entire range (if its small) or just one entire candle or just the wick of the candle to define the zone.
Horizontal Ray tool - used to define the level.
levels when dashed lines are untested, active level where buyers or sellers are waiting to create a level of interest.
Tested levels are dotted lines. If used, they reference the range and could become Origin levels or R.a.t.s in the future (levels where new trends originate or where traders are using Rejection as A Target to scalp and reverse position - aka stoploss hunters; like the rats they are.
Again the color code:
Yearly timeframe color is Black
Monthly timeframe is color pink
weekly grey
daily is red
4hr is orange
1hr is yellow
15min is blue
5min is green if they are shown.
strength favors the higher timeframe.
Quant (QNT) Showing Local Top Signals – Short Setup Toward $64:Current Price: 70.48 (Analysis was generated on Monday Morning)
Direction: SHORT
Confidence level: 42%(Several professional traders mentioned a potential local top and highlighted strong resistance above $77 with downside targets referenced near $64 and deeper toward $50-$52. However, limited social sentiment data reduces conviction.)
Targets
Target 1: 64.88
Target 2: 52.00
Stop Levels
Stop 1: 77.00
Stop 2: 80.00
Key Insights:
Here’s what’s driving this setup. Several professional traders highlighted that Quant may have already formed a local top, which often precedes a corrective move. When traders start discussing “local highs” rather than breakout levels, it usually signals that momentum is fading and the market may be preparing for a pullback.
Another important point traders emphasized is the broader crypto market context. The overall market has been under pressure with Bitcoin struggling and investors shifting toward a more defensive stance. When large-cap crypto loses momentum, mid-cap infrastructure tokens like Quant tend to experience deeper short-term corrections.
What also caught my attention is the repeated reference to a major resistance zone above $77. When multiple traders point to the same ceiling, it typically means liquidity is stacked there. That makes the risk/reward more favorable for short positions while price remains below that level.
Recent Performance:
Quant has been moving sideways between roughly $70 and $78 over the past few weeks. Each attempt to move higher has stalled quickly, suggesting buyers are losing momentum. The price currently sits near the lower part of that range, but the broader structure still looks like a topping formation rather than the start of a fresh breakout.
Volume has also been soft compared to earlier moves this year, which usually signals fading enthusiasm among traders.
Expert Analysis:
Professional traders repeatedly pointed out two important levels in their analysis. First is $69–$70 support, which has been tested multiple times. If that area breaks, downside momentum could accelerate quickly.
The second level traders mentioned is $77 resistance, which acts as a key invalidation point for bearish setups. As long as QNT stays below that zone, several traders see the probability of a corrective move increasing.
Another interesting detail: some trader models flagged deeper macro downside targets near $50–$52 if the broader crypto market weakens further. That level isn’t necessarily expected immediately, but it represents a major downside magnet if selling pressure increases.
News Impact:
Fundamental developments around CBDC interoperability and institutional blockchain infrastructure remain positive for Quant long term. However, markets often separate fundamentals from short‑term price action.
Right now macro conditions are dominating. Risk assets across both crypto and equities have been volatile, and traders appear more focused on liquidity and technical resistance than long‑term adoption narratives.
Trading Recommendation:
Here’s my take. The risk‑reward favors a SHORT position while price remains below $77. Traders appear to be treating that zone as a ceiling, and the local-top narrative is gaining traction among professional trading discussions.
A reasonable setup is targeting $64.88 as the first downside objective, which aligns with a commonly referenced support zone. If broader crypto weakness accelerates, the move could extend toward $52, which several traders highlighted as a deeper structural support area.
Risk management matters here. A sustained break above $77 would invalidate the bearish structure, and a move above $80 would likely trigger a broader short squeeze.
For now, the crowd wisdom from professional traders leans toward a corrective phase rather than an immediate breakout.
QNT - time to reveal the cardsQNT is ranging almost 4 years but when looking at pattern we see similar behaviour to BTC and XRP where we had a top, a correction, consolidation with wick of fibb 0.618 and pullback for higher low. All it remains now is bounce up and push to fibb 1.272 range like BTC and XRP did. Note that if we loose diagonal support line we can trigger dump leading to single digit price level so have your SL in place.
QNT Dip Range $8-$20 QNT's value stems from Overledger powering enterprise blockchain interoperability, connecting banks and chains in a market surging to trillions in tokenized assets.
I feel like price test $20 - $8 range.
I am looking to start acquiring a bag in this range.
Long term growth targets $180 to $400 by 2026 and $2500 by 2030 on institutional demand.
Quant at a critical breakout zone as traders eye upside momentuCurrent Price: 79.29 (Analysis was generated on Monday Morning)
Direction: LONG
Confidence level: 62%(This reflects mixed but slightly bullish trader language, repeated upside breakout levels, and supportive short‑term momentum, balanced against warnings of failure below key support)
Targets
Target 1: 84.85
Target 2: 88.00
Stop Levels
Stop 1: 77.00
Stop 2: 73.39
Key Insights:
Here’s what’s driving this setup. Several traders clearly stated that a break above the $84.9 zone opens the door toward the high‑$80s and potentially the low‑$90s. That level shows up again and again across different analyses, which gives it real weight. At the same time, traders repeatedly warned that weakness below $77 would invalidate the bullish structure, so risk management is critical.
What’s interesting is that even traders who sounded skeptical didn’t fully flip bearish at current prices. Instead, many described Quant as holding support and consolidating, which in short‑term trading usually favors a directional move. With price sitting closer to support than resistance, I’m leaning toward upside continuation rather than a clean breakdown.
Recent Performance:
Quant has been trading in a tight range over the last few sessions, roughly between the high $70s and low $80s. It recently pushed toward $84 before pulling back, which lines up with traders describing choppy but constructive price action. Importantly, price has not lost the $77–$78 area, which many traders flagged as the line in the sand.
Expert Analysis:
Several professional traders highlighted a possible breakout scenario if $84.9 is reclaimed on a strong close. A few also mentioned that previous upside moves failed because momentum dried up, which is why volume and follow‑through matter here. From my perspective, this is a classic compression setup: either price expands higher through resistance or it rolls over fast if support fails.
The repeated mention of corrective moves and failed breakouts keeps confidence from being higher, but the short‑term technical picture still favors a push higher first. That’s why I’m choosing a long bias with defined stops rather than chasing aggressively.
News Impact:
Recent discussion around Overledger partnerships and ongoing development updates has helped keep interest in Quant alive, even while broader crypto markets have been uneven. The lack of negative headlines is also important here. Traders aren’t reacting to bad news; they’re waiting for confirmation on the chart, which supports a technical‑driven move this week.
Trading Recommendation:
Putting it all together, I’m taking a LONG position on Quant with a clear plan. I want to see price hold above $77 and ideally push toward $84.85. A clean move through that level targets $88 within the week. If price loses $77, I’m out, and a deeper break below $73.39 fully invalidates the setup. This is a momentum‑based trade with disciplined risk, not a buy‑and‑hope position.
Tokenisation of sterling ? Bullish long term on QNTUSD because of the triangle formation taking place
If we see a dip first back somewhere to old KLOS/R then would be a nice acumination zone ready for the next spring move back up after the crypto bear.
I can see that the symmetrical nature of the triangle is governed by prior fib moves and inflection points are thus predictable with greater levels of probability. So if this follows possible resting points in the bull trend are also by definition more likely to be predictable too
The fib extension tool is shown here as possible points.
I would also look at all the moves and apply fib levels to them to see where key levels are and over lay that too not shown on the drawing, but key points highlighted where inversions occurred at these fib points I would guess there are more but you get the point.
QNT rumored to be working to allow you to put sterling on to block chains directly.
QNT - Inverse Head & Shoulders on Daily Quant has formed a nice inverse head and shoulders pattern on the daily. This was at key support and also corresponded with some bullish divergence on the RSI. This should take price up to the downward sloping trendline. A break of this trendline and it’s game on.
Quant Is Finishing A Bullish Triangle FormationQuant Network is a blockchain interoperability project that lets different blockchains communicate with each other. Its operating system, Overledger, allows developers and businesses to build apps that can run across multiple blockchains at the same time.
The token QNT is used to access and pay for Overledger services.
Quant with ticker QNTUSD is still holding up well above the lower triangle line, so bulls are still here. On the weekly basis, we can now see it finishing a bullish triangle pattern in wave B before we may see another rally for wave C. On a daily chart, it may actually have a completed complex W-X-Y decline within final wave (E) of B, but bullish confirmation for wave C is only above the upper triangle line and 136 level.
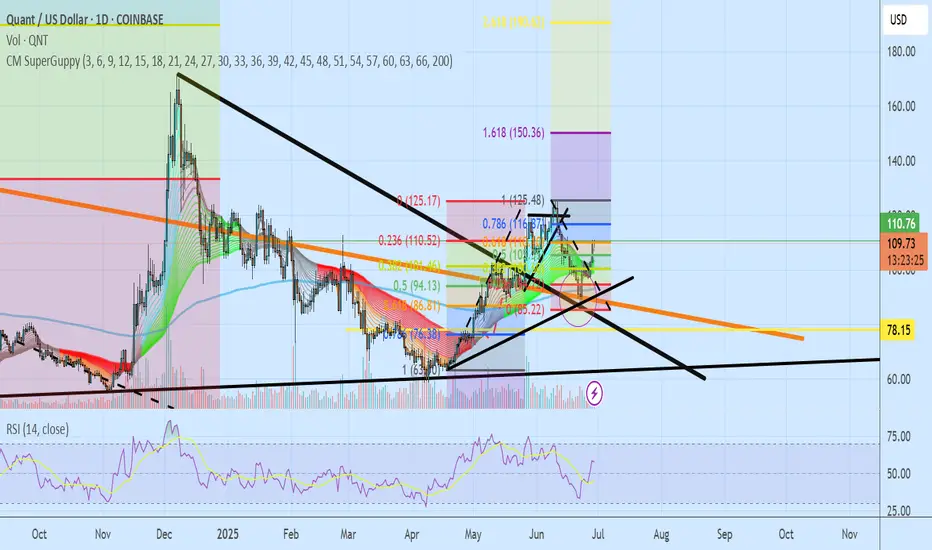
QNT FOR THE WIN!Looking at QNT if youve been following me on another platform under the same name. Youll see we have timed these perfectly. we entered QNT at around $75 sold at $123 the flase breakout/ war and had the rejection right back down to the .618 fib retracement. Once we held beautiful support at the downward trendline, around $90 we had an immediete push up. We wait to see what bitcoin does. If it consolidates or pushed upward we could see QNT push back up to $123 and beyond (currently at the .618 fib retracement).
If bitcoin gets rejected, we may see a small pullback but i cant imagine back down past $90 again. NOT FINANCIAL ADVICE.
Goodluck and have fun with it.
QNT is breaking out of the descending wedge upper trend line.QNT is now starting to trade outside the upper trendline of the descending wedge and is likely to make an attempt to move toward the equilibrium zone—or close to it.
This will be interesting to watch.
Good luck, and always use a stop-loss!
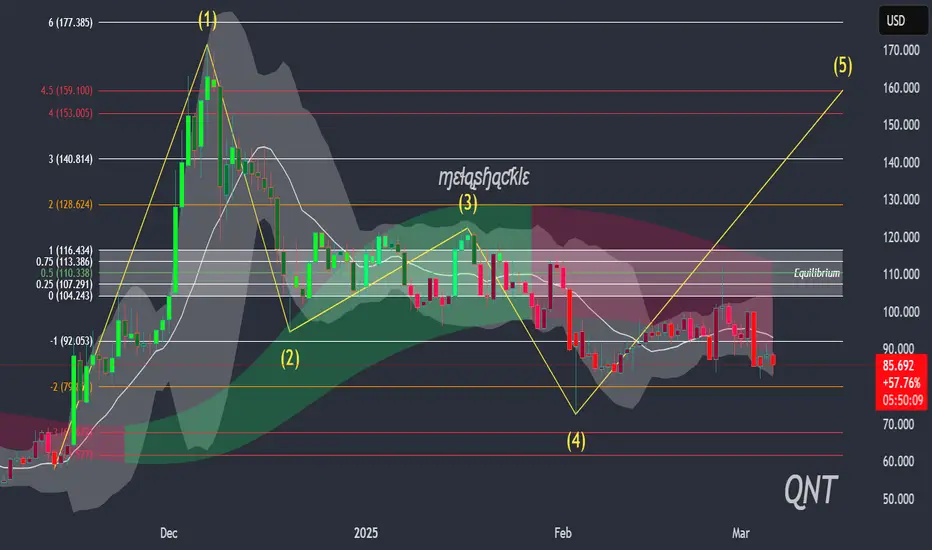
QNT could double in price quicker than you think!The QNT charts are looking incredible right now, and all ISO 20022 tokens are now exhibiting the same, or very similar, internal five-wave patterns that I believe are about to move up to the next level.
Although I don't own any QNT and have no plans to, many of my followers do. Either way, the charts are starting to look like a nice slice of cherry pie.
Good luck, and always use a stop loss!
SWEEEEP!They need your money to send it don't let it be your liquidity. When you see set ups like this is when you should sit on your hands, control your emotions, or just use proper risk management if you just cant help yourself from trading the range, but that's just what we se here. Liquidity needs to be swept and cleared from the lows if we are to go higher here from this level of $105. If GETTEX:QNT 's price action could give us a solid dip (signature pattern with a candle close and rejection) with some sort of reaction that will provide support at key psychological Fibonacci level should provide evidence that we could send higher.
USE PROPER RISK MANAGEMENT