In-depth trading ideas
RAYUSDT Descending Trendline Breakout! Preparing Major Reversal?📉 RAYUSDT on the 2D timeframe remains in a well-established downtrend that has been in place for several months. This is clearly reflected by the Descending Trendline, which has consistently acted as dynamic resistance since the previous market peak.
🔍 Price is now approaching this trendline once again after successfully forming a Higher Low from the recent support zone. This could be an early indication that selling pressure is weakening while buyers are gradually regaining control.
⚠️ As long as the price remains below the Descending Trendline, the primary trend is still considered bearish. However, the more frequently this resistance is tested without creating new lows, the greater the probability of a bullish breakout.
---
📐 Chart Pattern: Descending Trendline 📉
A Descending Trendline is a dynamic resistance line that connects a series of Lower Highs.
✨ Pattern Characteristics:
🔻 Indicates strong seller dominance throughout the downtrend.
🔄 The more often the resistance is tested without forming a new Lower Low, the higher the probability of a breakout.
📈 A breakout supported by strong trading volume often signals the beginning of a trend reversal from Bearish to Bullish.
🎯 On this chart, the price is once again testing the Descending Trendline, making this a critical decision zone for the next major move.
---
🟢 Bullish Scenario 🚀🐂
The bullish outlook will become more convincing if the price can:
✅ Break out and close decisively above the Descending Trendline.
Afterward, the price may target the following key resistance levels:
🎯 0.7850 USDT — Initial resistance.
🎯 0.8780 USDT — Next resistance level.
🎯 1.0150 USDT — Strong bullish confirmation area.
🎯 1.2320 USDT — Primary bullish target.
🚀 If the breakout is accompanied by increasing trading volume, the probability of a trend reversal from Bearish to Bullish will increase significantly.
---
🔴 Bearish Scenario 🐻📉
The bearish scenario remains valid if:
❌ The price is rejected once again at the Descending Trendline.
If selling pressure intensifies, the price could:
📍 Decline back toward the 0.60 USDT support area.
📍 Retest the previous Low at 0.5013 USDT.
⚠️ A breakdown below this support could lead to the formation of a new Lower Low, confirming the continuation of the overall downtrend.
---
📍 Key Levels 🎯
🚧 Resistance
🟡 0.7850
🟡 0.8780
🟡 1.0150
🟡 1.2320
📉 Dynamic Resistance
📏 Descending Trendline
🛡️ Support
🟢 0.60
🟢 0.5013
---
💡 Conclusion 📖
📊 RAYUSDT is currently at a crucial technical point. The Descending Trendline remains the primary obstacle that will determine the next major market direction.
🔻 As long as this resistance remains intact, the bearish trend continues to dominate.
🚀 However, if a confirmed breakout occurs with strong trading volume, the probability of a bullish trend reversal will increase substantially, opening the door for a gradual move toward the 1.2320 USDT target.
⚠️ Always wait for breakout confirmation, manage your risk carefully, and apply proper risk management before making any trading decisions.
---
#RAYUSDT #RAY #Raydium #Crypto #Cryptocurrency #TradingView #TechnicalAnalysis #PriceAction #DescendingTrendline #TrendlineBreakout #Breakout #Bullish #Bearish #TrendReversal #Support #Resistance #SwingTrading #CryptoTrading #Altcoins #DeFi #Solana #RiskManagement
RAYUSDT - Bear Flag, Breakdown or Reversal?RAYUSDT on the 8-hour timeframe is currently trading within a Bear Flag pattern, a bearish continuation formation that typically develops after a strong downward move (flagpole), followed by an upward-sloping consolidation phase.
📊 The chart shows price moving inside an ascending channel after a sharp decline earlier in June. This recovery has not yet established a strong bullish structure and appears more like a temporary retracement before a potential continuation of the downtrend.
⚠️ Price is currently testing the lower boundary of the channel, making this a critical area that could determine the next major move.
---
🐻 Pattern Formation: Bear Flag
📌 Key Characteristics of the Bear Flag:
🔻 A strong bearish move occurred beforehand (Bearish Flagpole).
📈 Price then entered an ascending channel (Flag).
📉 Volume and momentum tend to weaken during the consolidation phase.
📊 The higher timeframe structure still favors the bears.
⚠️ A breakdown below the lower trendline often signals a continuation of the downtrend.
The Bear Flag is considered one of the most reliable continuation patterns, especially when it forms after a significant bearish impulse.
---
🎯 Key Levels
🚧 Major Resistance
🔹 0.6200 – 0.6300
🔹 0.6800 – 0.7000 (Upper Channel Resistance)
🛡️ Major Support
🔸 0.5820
🔸 0.5600
🔸 0.5450
🔸 0.5300
📍 The 0.5300 level represents the lowest visible support within the current structure and serves as the primary bearish target if a breakdown occurs.
---
🚀 Bullish Scenario
✅ Bullish Confirmation If:
✔️ Price holds above the channel support.
✔️ A strong rebound occurs from the 0.58 – 0.60 area.
✔️ Price breaks and closes above the upper channel trendline.
✔️ Trading volume increases during the breakout.
🎯 Bullish Targets
🎯 0.6500
🎯 0.6900
🎯 0.7200
📈 If the breakout succeeds, the Bear Flag setup would be invalidated and could potentially evolve into a medium-term reversal structure.
---
📉 Bearish Scenario
❌ Bearish Confirmation If:
🔻 Price breaks below the lower channel trendline.
🔻 An 8H candle closes below the 0.5820 support level.
🔻 Selling volume increases during the breakdown.
🎯 Bearish Targets
🎯 0.5600
🎯 0.5450
🎯 0.5300
⚠️ If the 0.5300 support fails to hold, further downside could follow, potentially matching the projected move based on the Bear Flag's flagpole measurement.
---
📝 Conclusion
📌 RAYUSDT remains inside a Bear Flag structure on the 8-hour timeframe.
📌 As long as price continues trading within the ascending channel, the risk of a bearish breakdown remains the dominant scenario.
📌 The 0.5820 level is a critical support zone. Losing this area could trigger further selling pressure toward 0.5600 – 0.5300.
📌 On the other hand, a breakout above the channel resistance would invalidate the Bear Flag and open the door for a stronger bullish move.
🎯 For now, traders should wait for a confirmed breakout or breakdown before taking aggressive positions.
---
#RAYUSDT #RAY #Raydium #Crypto #CryptoTrading #TechnicalAnalysis #ChartAnalysis #BearFlag #BearishPattern #BreakdownSetup #Altcoins
$RAY AnalysisNASDAQ:RAY is not showing any good momentum on the higher timeframes right now. 📉
Chart looks neutral and price is moving without clear strength in either direction. 👀
I’m watching is green demand zone below. If price taps that zone and buyers step in, we could see a decent push from there. 📈
Nothing exciting yet, but definitely worth keeping on the watchlist.
Follow @HamzaTheInsider for more analysis. 🔥
Rayusdt shortInstructions:
Entry point: yellow
Stop loss: red
Take profit: green
👉Leverage x 5-10-20 for crypto
👉Leverage x 20-50-100 for commodities, stocks, indices, and forex
👉Margin 1-5% max.
Always practice risk and money management.
Invest a maximum of 5% on any trade or across all your trades.
Invest only what you can afford to lose, as no one is in control of the market.
👉Our analyses are primarily based on:
breakouts: two trend lines (ascending and descending) and a line indicating a horizontal breakout.
chart patterns: shoulders and head, triangle parttern, elliott impulse, etc etc.
We don't always have the time to track them at all times or to represent them visibly, given the numerous signals, the number of channels to manage, and especially because of the often rapid pace of market movements.
indicators: We associate at least two indicators with this technique.
👉Depending on the circumstances, we use specific indicators, often setting 3 or more take profit levels.
👉Indeed, there are good days in trading and also bad days. No one can promise to win every trade, and like all traders worldwide, we also experience stop-loss orders. However, we win more than we lose and remain positive.
👉You can close the position before or after the take profit orders indicated by the green lines if you are personally satisfied; the same applies to stop loss orders.
👉We must stay positive, clear-headed, and humble.
we cannot provide all instructions or all trades here on this channel.
Good luck to us all, and may God guide us. Amen.
rayusdt longInstructions:
Entry point: yellow
Stop loss: red
Take profit: green
👉Leverage x 5-10-20 for crypto
👉Leverage x 20-50-100 for commodities, stocks, indices, and forex
👉Margin 1-5% max.
Always practice risk and money management.
Invest a maximum of 5% on any trade or across all your trades.
Invest only what you can afford to lose, as no one is in control of the market.
👉Our analyses are primarily based on:
breakouts: two trend lines (ascending and descending) and a line indicating a horizontal breakout.
chart patterns: shoulders and head, triangle parttern, elliott impulse, etc etc.
We don't always have the time to track them at all times or to represent them visibly, given the numerous signals, the number of channels to manage, and especially because of the often rapid pace of market movements.
indicators: We associate at least two indicators with this technique.
👉Depending on the circumstances, we use specific indicators, often setting 3 or more take profit levels.
👉Indeed, there are good days in trading and also bad days. No one can promise to win every trade, and like all traders worldwide, we also experience stop-loss orders. However, we win more than we lose and remain positive.
👉You can close the position before or after the take profit orders indicated by the green lines if you are personally satisfied; the same applies to stop loss orders.
👉We must stay positive, clear-headed, and humble.
we cannot provide all instructions or all trades here on this channel.
Good luck to us all, and may God guide us. Amen.
RAYUSDT 1D#RAY is moving above the broken descending resistance and the range box on the daily chart. A minor pullback is expected. Consider accumulating a small position at the retest zone, which is aligned with the daily SMA100. In case of a successful bounce, the potential upside targets are:
🎯 $0.972
🎯 $1.099
🎯 $1.226
🎯 $1.407
🎯 $1.637
⚠️ Always remember to use a tight stop-loss and maintain proper risk management.
RAYUSDT Forming Bullish MomentumHere’s the clean, corrected version for **RAYUSDT** in the same style:
---
RAYUSDT is currently forming a clear bullish momentum pattern, a classic wave structure that often signals an upcoming breakout. The price has been consolidating within a narrowing range, indicating that selling pressure is gradually weakening while buyers are beginning to regain control. With consistent volume supporting accumulation at lower levels, the setup suggests a potential bullish breakout in the near term.
If the price breaks above the wedge resistance, the projected move could be moderate yet rewarding, with a potential gain of around 20% to 30%. This type of bullish momentum pattern is typically seen at the end of downtrends or corrective phases, signaling a possible shift in market sentiment from bearish to bullish.
Traders closely monitoring RAYUSDT are noticing strengthening momentum as it approaches a key breakout zone. The presence of solid trading volume adds confidence to this setup, indicating that market participants may be positioning early in anticipation of a reversal.
Growing investor interest in RAYUSDT reflects rising confidence in its technical structure and overall potential. If the breakout is confirmed with sustained volume, it could mark the beginning of a fresh bullish leg. This setup may offer a valuable opportunity for medium-term traders as momentum builds and the pattern completes.
✅ Show your support by hitting the like button
✅ Leave a comment below (What is your opinion about this coin?)
Your feedback and engagement keep me motivated to share more insightful market analysis with you!
YUSDT UPDATERAY Technical Setup Pattern: Falling Wedge Breakout Current Price: $0.762 Target Price: $1.50, $1.60 Target % Gain: 125.56%
Technical Analysis: RAY is breaking out of a falling wedge pattern on the 1D timeframe with a strong bullish candle pushing above the descending resistance, indicating a potential trend reversal supported by increasing momentum and consolidation near the base. Time Frame: 1D
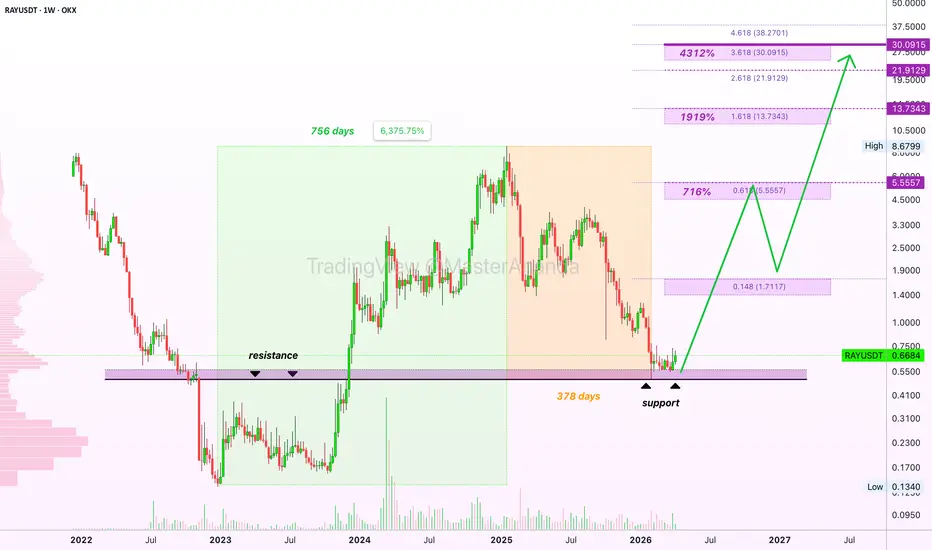
Raydium ready to hit new all-time high: $30 = 4,300%A two years long bull market on RAYUSDT (Raydium) resulted in 6,375% total growth. From a low point of $0.134 in December 2022 to a high of $8.68 in January 2025.
The bear market removed much of the gains but not all, a strong higher low is present; resistance turned support, and now we are ready for a new bullish cycle on Raydium. A perfect chart.
If a new bull market lasts two more years, like the first one, then we can expect growth until February-March 2028.
» The minimum target on this newly developing bullish move sits at $5.555. It opens up a nice 700% potential for profits.
» A new all-time high can result in a price of $13 with 1,900% profits potential.
» The last and final target long-term, can be $30 or $38, equals 4300% or much higher. Even higher than much higher is possible, these are only the standard targets.
This project already proved its strength through a massive bull market and relatively short bear market.
If you compare this one with other projects, it did much better. Some altcoins have been going down for years, 2 years, 3 years, 4-5 years and some even more.
There is strong demand for this project, there must be a reason for it.
Namaste.
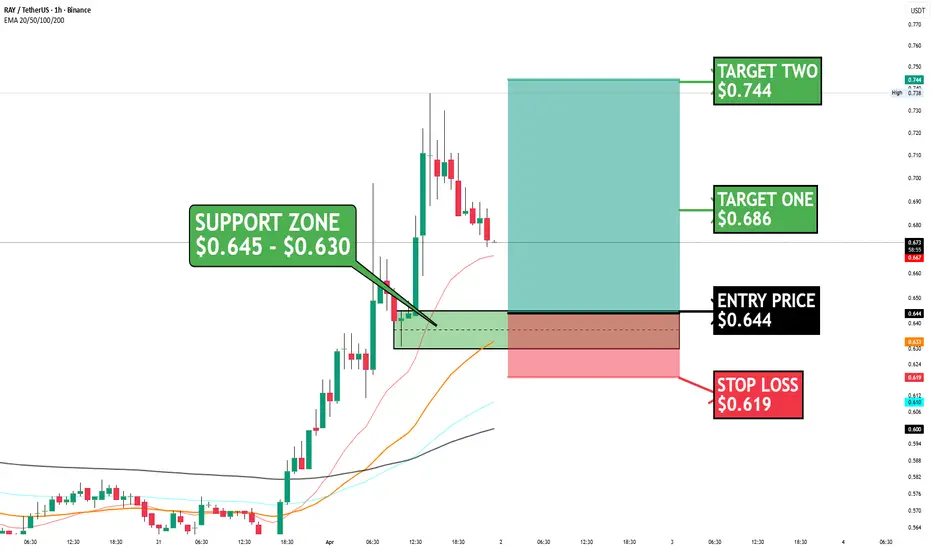
$RAYUSDT Pulling Back Into Support — Ready for Next Leg Up?BINANCE:RAYUSDT just had a strong impulsive move up and now we’re seeing a pullback into a key support zone — classic continuation setup if it holds.
Support Zone (Buy Area):
$0.645 – $0.630
This is a clean demand zone where price previously based before the breakout, plus EMA confluence backing it up.
Entry Zone:
$0.64 area (dip buy territory)
Stop Loss:
$0.619 (below support = setup invalidated)
Targets:
Target 1: $0.686
Target 2: $0.744
What’s the play?
Price already made a strong move, so this pullback is looking like a reload zone for buyers. If this support holds, we’re likely to see continuation toward the upside targets.
If this zone breaks, expect a deeper retrace — so don’t jump in blindly, wait for confirmation.
Bias: Bullish as long as $0.63 holds
This is a clean buy-the-dip setup in an uptrend. Let price come into the zone and react — no chasing.
RAYUSDT — Breakout or Another Drop Incoming?The chart shows a strong bearish trend in the mid to long term, indicated by consistent formation of lower highs and lower lows since the previous peak.
Price is currently moving below a descending trendline, which acts as a key dynamic resistance. The small sideways movement at the bottom suggests a phase of weak accumulation / consolidation after a sharp decline.
---
📉 Pattern: Descending Triangle / Bearish Continuation
The structure forms a Descending Triangle, characterized by:
Lower highs (marked by the downward trendline)
Horizontal support around 0.60 – 0.65
Increasing selling pressure
This pattern is typically a bearish continuation, but still has reversal potential if a strong breakout occurs.
---
🔑 Key Levels
Main Support: 0.60 – 0.50
Nearest Resistance: 0.685
Next Resistances: 0.885 – 1.027 – 1.240
---
🟢 Bullish Scenario (Reversal / Breakout) – 35%
📈 Confirmation:
Price successfully breaks out and closes above the trendline + 0.685 resistance
🎯 Targets:
0.885
1.027
1.240
📌 Note: This breakout would signal a shift from bearish structure to an early bullish reversal, especially if supported by strong volume.
---
🔴 Bearish Scenario (Continuation) – 65%
📉 Confirmation:
Price fails to break out and gets rejected from the trendline
Breakdown below 0.60 support
🎯 Targets:
0.50 (previous low)
Potential new lower lows if selling pressure continues
📌 Note: As long as price remains below the trendline, the bias stays bearish dominant.
---
⚠️ Conclusion
RAY is still under strong bearish pressure but is currently approaching a critical zone (trendline + resistance). The next move will largely depend on price reaction at this level.
Break above → potential reversal
Rejection → continuation downward
#RAY #RAYUSDT #CryptoAnalysis #TechnicalAnalysis #Altcoins #CryptoTrading #Bearish #Bullish #Breakout #DescendingTriangle #SupportResistance #PriceAction
RAY | Eight Dollars Was Barley The Beginning Its likely we see BINANCE:RAYUSDT decline another ~70% and its also likely we dont see any action till next year.
Buyers lost steam around $8 and failed to reclaim at its liquidity lvl. Because of this structural damage we're now locked into a Contraction phase running it back to a major demand lvl ($0.15).
Price needs to flush out as we head for capitulation and if this is the case then price action will need time to re-accumulate at lows which will require the rest of this year to do so.
In hindsight good things are to come as this gives you opportunity for what comes next for the cryptocurrency market.
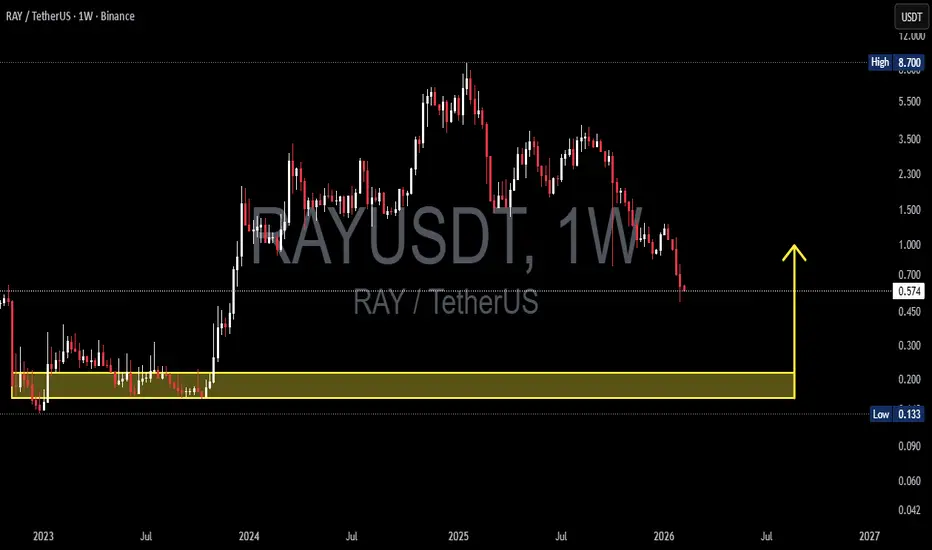
RAYUSDT — Testing Demand Zone?, Reversal or Breakdown Ahead?On the Weekly timeframe, RAYUSDT remains in a clear macro downtrend after forming its peak around the 8.7 USDT region. Following a distribution phase in the mid-range area (2 – 3.5), price continued declining gradually, forming consistent lower highs and lower lows.
Currently, price action is approaching a major historical demand / support zone that previously acted as the accumulation base before the massive 2024 rally.
Key zone:
0.215 – 0.160 USDT (Weekly Demand Block)
This area will determine whether the structure forms a macro bottom or continues into a deeper breakdown.
---
Pattern Explanation
1. Macro Distribution → Markdown Phase
After the parabolic rally, price entered distribution.
Wide consolidation range formed.
Support breakdown triggered further markdown.
2. Descending Structure
Characteristics visible on the chart:
Consecutive Lower Highs.
Gradual Lower Lows.
No significant bullish structure break yet.
3. Potential Double Bottom / Accumulation Base
If the demand zone holds, possible formations include:
Double Bottom.
Rounded Base.
Wyckoff Accumulation (Phase A–C).
The yellow zone acts as the last line of defense for buyers.
---
Key Levels
Resistance:
1.00 USDT — Psychological + minor structure.
1.50 USDT — Previous consolidation area.
2.30 – 3.50 USDT — Major supply zone.
5.50+ USDT — Macro distribution region.
Support / Demand:
0.573 USDT — Current reaction level.
0.215 – 0.160 USDT — Major Weekly Demand (Highlighted).
0.133 USDT — Absolute historical low.
---
Bullish Scenario
Bullish confirmation requires:
1. Price sweeps / taps the 0.215 – 0.160 demand zone.
2. Strong rejection appears (long wick / Weekly bullish engulfing).
3. Volume expansion at the lows.
4. Structure break above 1.00 USDT.
Potential upside targets:
Relief rally toward 1.00.
Continuation to 1.50.
Mid-term reversal toward 2.30 – 3.50.
If large accumulation occurs, the macro upside could expand significantly since this zone was the base of the previous rally.
---
Bearish Scenario
Bearish continuation triggers if:
1. Weekly close breaks below 0.160.
2. Demand zone fails to hold.
3. No significant volume reaction appears.
Implications:
Drop toward 0.133 (ATL retest).
If ATL breaks → downside price discovery.
Structure shifts into long-term markdown continuation.
The yellow zone would flip from demand into supply.
---
Conclusion
RAYUSDT is currently at a critical macro level.
Primary trend: Bearish.
Price is approaching major historical demand.
The 0.215 – 0.160 zone will decide reversal vs continuation.
Price reaction here will determine whether the market forms:
A macro bottom, or
A deeper bear market expansion.
Traders should wait for clear price action confirmation before taking large positions.
#RAYUSDT #RAY #Raydium #CryptoAnalysis #TechnicalAnalysis #Altcoins #SupportResistance #Wyckoff #CryptoTrading #Downtrend #Accumulation #MarketStructure #AltcoinSeason #CryptoChart
RAYUSDT Forming Bullish MomentumRAYUSDT is forming a clear bullish momentum pattern, a classic bullish reversal signal that often indicates an upcoming breakout. The price has been consolidating within a narrowing range, suggesting that selling pressure is weakening while buyers are beginning to regain control. With consistent volume confirming accumulation at lower levels, the setup hints at a potential bullish breakout soon. The projected move could lead to an impressive gain of around 190% to 200% once the price breaks above the wedge resistance.
This bullish momentum pattern is typically seen at the end of downtrends or corrective phases, and it represents a potential shift in market sentiment from bearish to bullish. Traders closely watching RAYUSDT are noting the strengthening momentum as it nears a breakout zone. The good trading volume adds confidence to this pattern, showing that market participants are positioning early in anticipation of a reversal.
Investors’ growing interest in RAYUSDT reflects rising confidence in the project’s long-term fundamentals and current technical strength. If the breakout confirms with sustained volume, this could mark the start of a fresh bullish leg. Traders might find this a valuable setup for medium-term gains, especially as the pattern completes and buying momentum accelerates.
✅ Show your support by hitting the like button and
✅ Leaving a comment below! (What is your opinion about this Coin?)
Your feedback and engagement keep me inspired to share more insightful market analysis with you!
NLDN | RAYSOLUSDT PERPETUAL SPECULATION SHORT RAYSOLUSDT 4H Perpetual
SHORT
Entry 1.1306
SL 1.2947
TP 0.8536
Should you find this analysis insightful, I invite you to like or leave a comment. Constructive feedback and suggestions are greatly appreciated. For further analyses, please follow me at @ydnldn.
TradeCityPro | RAY Near Resistance, Watching for Breakout👋 Welcome to TradeCityPro!
In this analysis, I want to review the RAY coin for you — one of the DeFi projects in the Solana ecosystem, which has a market cap of $313 million and is ranked 130th on CoinMarketCap.
🗓 Daily TimeFrame
This coin has a downtrend on the 4-hour timeframe that continued down to the 0.883 area, and it is currently in a corrective phase.
💥 During this correction and price consolidation, a range box between 0.883 and 1.242 has formed, and price has been moving sideways between these two levels.
✔️ After price was supported at 0.883, buying volume increased, and the price gained a strong bullish momentum.
⭐ At the moment, RAY is interacting with the 1.242 resistance, and breaking this level will be the first trigger for a long position.
💡 I personally will open a long position after the break of 1.242. The next resistance area is 1.675.
✨ If price gets rejected from 1.242, it can move downward again, and in this case, breaking the triggers 0.996 or 0.883 will give us short positions.
🧮 Since this coin has been in a downtrend previously, breaking 0.996 and 0.883 can continue the downtrend, and strong bearish momentum will enter the market with the break of these levels.
⛏ But for the market to become bullish, for now we don’t have much bullish momentum, and we need more confirmations.
📝 Final Thoughts
Stay calm, trade wisely, and let's capture the market's best opportunities!
This analysis reflects our opinions and is not financial advice.
Share your thoughts in the comments, and don’t forget to share this analysis with your friends! ❤️
RAYUSDT 1D#RAY is moving inside a falling wedge pattern on the daily chart. Enter this coin only after a clean breakout above the wedge. In that case, the potential targets are:
🎯 $1.406
🎯 $1.704
🎯 $1.945
🎯 $2.186
🎯 $2.528
⚠️ Always remember to use a tight stop-loss and maintain proper risk management.
RAYUSDT 12H#RAY is pressing the descending resistance on the 12H chart, and it has even formed a double-bottom pattern. Both the RSI and MACD are bullish as well. With all these factors combined, the probability of breaking above the descending resistance has increased. So keep an eye on it. In case of a breakout, the targets are:
🎯 $1.256
🎯 $1.347
🎯 $1.437
🎯 $1.565
🎯 $1.728
⚠️ Always remember to use a tight stop-loss and maintain proper risk management.
RAY/USDT – Major Decision Zone at $0.85–$1.10RAY has returned to the same demand zone that triggered every major rally over the past 2 years.
Hold this zone = potential multi-month reversal.
Lose this zone = structural breakdown.”
---
Pattern & Market Structure Explanation
The weekly chart of RAY/USDT is showing one of the clearest macro setups:
1. Multi-Month Descending Triangle (Strong Bearish Pressure)
A clean series of lower highs forming a dominant descending trendline.
This trendline has rejected every bullish attempt since mid-2024 — clear seller dominance.
2. Titanium Demand Zone: $0.85–$1.10
This zone has been the launchpad of every major RAY rally in 2022, 2023, and 2024.
Every touch of this area resulted in strong upside acceleration.
Price is now retesting it again…
This is the most important test for RAY’s macro trend heading into 2025–2026.
3. Liquidity Sweeps Are Appearing
Sharp wicks below the zone followed by rapid rejections upward.
This behavior is typical before a major direction shift — markets clean liquidity first.
Suggests big positions are being prepared beneath the surface.
---
Bullish Scenario – If This Zone Holds, a Major Reversal Can Begin
Bullish Confirmation Triggers:
Weekly close back above $1.15–$1.20.
Breakout above the descending trendline (major signal).
Increasing buying volume during the breakout.
Upside Targets:
1. $1.50 – Early resistance & first momentum checkpoint.
2. $1.85 – Trend structure recovery.
3. $2.65 – Mid-range target if momentum sustains.
4. $3.40 – Strong resistance where larger moves often stall.
5. $7.20–$8.70 – Long-term targets if a macro breakout unfolds.
Bullish Narrative:
If this demand zone holds, we might not be looking at a minor bounce —
this could be the beginning of a fresh multi-month bullish impulse.
---
Bearish Scenario – If Support Breaks, the Structure Shifts Completely
Bearish Confirmation Triggers:
Weekly close below $0.85.
No quick reclaim on the following weekly candle.
Strong selling volume on the breakdown.
Downside Targets:
$0.55 – First structural support.
$0.35 – High liquidity area.
$0.133 – Historical low (capitulation zone).
Bearish Narrative:
If this long-term support finally breaks, RAY enters a new phase of macro weakness.
Demand is absorbed, and price enters an extended redistribution cycle.
---
Core Insight: “The Last Support”
The $0.85–$1.10 zone is not just a level — it is the foundation of RAY’s macro structure.
At this zone:
Smart money typically positions
Liquidity concentrates
Market sentiment is tested
Breakdown = major shift in long-term trend.
Hold + trendline breakout = potential start of a new bullish cycle.
This is why this zone is the single most important area on RAY’s chart in the past 2 years.
---
#RAY #RAYUSDT #CryptoAnalysis #CryptoOutlook #TechnicalAnalysis #DescendingTriangle #DemandZone #Altcoins #PriceAction #CryptoTrading
RAYUSDT Forming Falling WedgeRAY/USDT looks like it’s entering a pivotal phase right now. Technically, the price has been consolidating after a corrective pull-back, and what I’m watching is whether RAY can break above its recent consolidation high with volume supporting the move. The project sits within a high-visibility niche—decentralized exchange infrastructure on the Solana chain—where AMM + order book, deep liquidity, and protocol buy-backs are high-search keywords. On the fundamentals, RAY is benefiting from renewed interest thanks to increased token staking, reduced circulating supply via buy-backs, and a strong ecosystem growth posture.
From a strategic viewpoint, a clean breakout above resistance and confirmation with volume would be the trigger for me. If RAY closes above resistance and holds it, the next move could carry upside momentum. The reward potential looks favorable given the combination of structural base plus thematic strength in the Solana-DeFi space. Risk control is essential, so placing a stop just below the recent consolidation low or major support would allow a defined risk-to-reward.
Fundamentally, the token maps into current crypto market themes that are heavily trafficked: DEX dominance, Solana ecosystem expansion, tokenomics with buy-back, and staking rewards. Investors appear to be increasingly interested again, as on-chain metrics and trading volume suggest increased engagement. That alignment between narrative and structure adds weight to the bullish thesis.