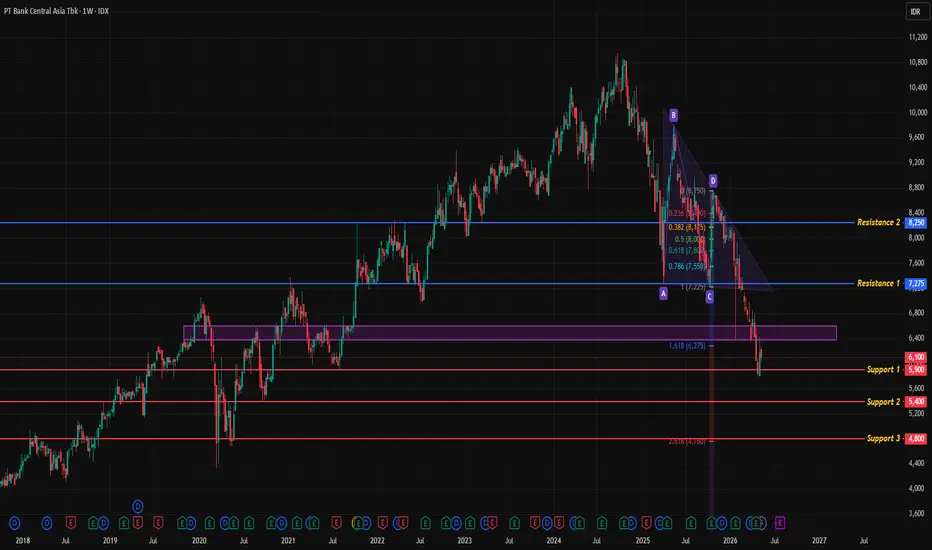
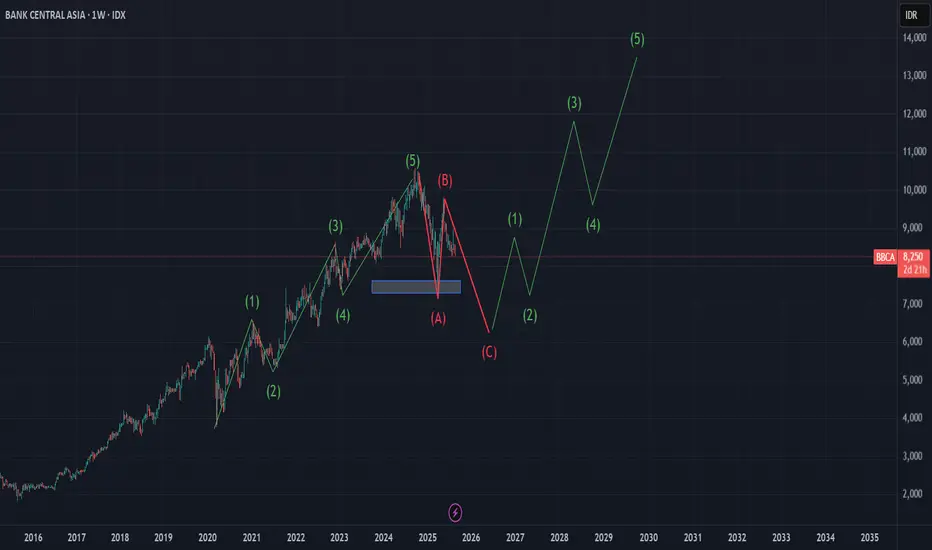
BBCA Weekly AnalysisCurrent Price: ±6,100
BBCA is currently still in a medium-term bearish structure.
The key 6,400–6,500 support zone has already broken down. This area previously acted as a major institutional demand zone and has now turned into resistance.
As long as price remains below this zone, market pressure
PT Bank Central Asia Tbk UnSp Singapore Depositary Receipt Repr 2/1 Sh
No trades
No trades
Compare with PT Bank Central Asia Tbk UnSp Singapore Depositary Receipt Repr 2/1 Sh
0.075 SGD
4.57 B SGD
9.02 B SGD
Details
Sector
Industry
CEO
Gregory Hendra Lembong
Website
Headquarters
Jakarta
Founded
1955
ISIN
SGXE23025161
FIGI
BBG01XWJCX85
Identifiers
ISIN SGXE23025161
PT Bank Central Asia Tbk provides commercial banking and other financial services. It operates through the following segments: Loans, Treasury, and Others. The firm offers deposits account, transaction banking, electronic banking, cash management, credit cards, bank assurance, credit facilities, bank guarantees, export-import facilities, foreign exchange facilities, and investment products. The company was founded on August 10, 1955 and is headquartered in Jakarta, Indonesia.
BBCA WEEKLY OUTLOOKAs a bank, BBCA IJ is an outstanding company. Customers genuinely enjoy its products and appreciate the quality of its services. This private institution has consistently delivered value to its investors.
⚠️DISCLAIMER ON⚠️
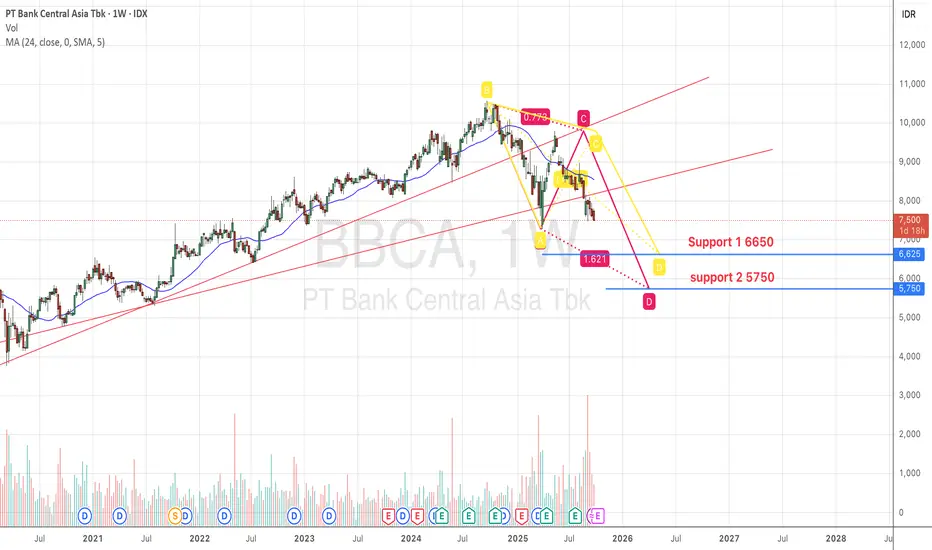
However, from a technical perspective, there is a risk of a deeper correctio
BBCAShort Term: There is a chance of a rebound to the 8,400 – 8,600 area if the 7,800 support holds.
Medium Term: As long as the price has not broken through and remains above 9,000, the trend is still likely to decline.
Important Levels:
Support: 7,800 – 7,600
Resistance: 8,600, then 9,600 – 10,000
BBCA Elliott Wave Analysis: A Potential C-Wave Correction BeforeBased on a technical analysis using Elliott Wave Theory on the weekly timeframe, BBCA stock appears to have completed a significant 5-wave impulsive cycle (a major bullish run) since its 2020 lows. Currently, the price is in an A-B-C corrective phase, which is a natural occurrence after a strong upt
See all ideas
Summarizing what the indicators are suggesting.
Oscillators
Neutral
SellBuy
Strong sellStrong buy
Strong sellSellNeutralBuyStrong buy
Oscillators
Neutral
SellBuy
Strong sellStrong buy
Strong sellSellNeutralBuyStrong buy
Summary
Neutral
SellBuy
Strong sellStrong buy
Strong sellSellNeutralBuyStrong buy
Summary
Neutral
SellBuy
Strong sellStrong buy
Strong sellSellNeutralBuyStrong buy
Summary
Neutral
SellBuy
Strong sellStrong buy
Strong sellSellNeutralBuyStrong buy
Moving Averages
Neutral
SellBuy
Strong sellStrong buy
Strong sellSellNeutralBuyStrong buy
Moving Averages
Neutral
SellBuy
Strong sellStrong buy
Strong sellSellNeutralBuyStrong buy
Displays a symbol's price movements over previous years to identify recurring trends.