SHIBA | Is the First Major Cycle Ending? A Potential Golden Era SHIBA | Is the First Major Cycle Ending? A Potential Golden Era Ahead?
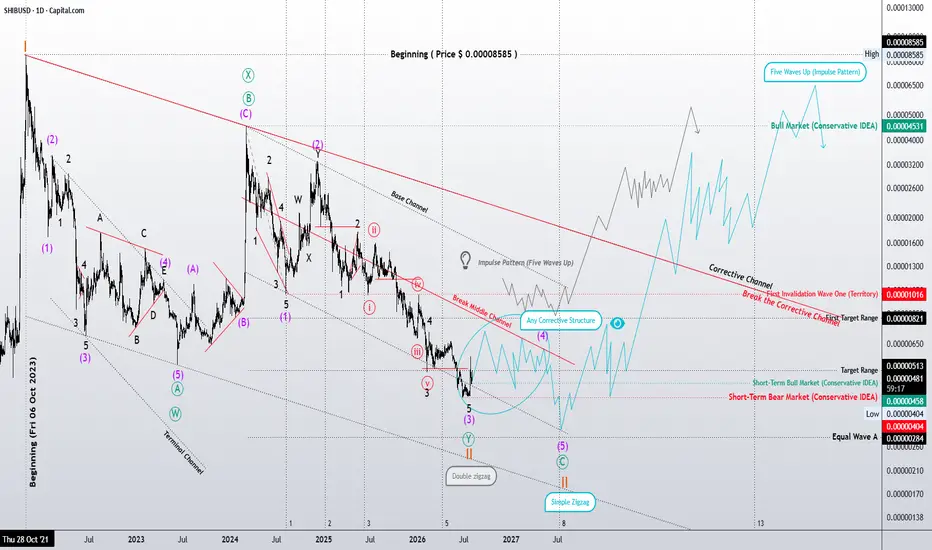
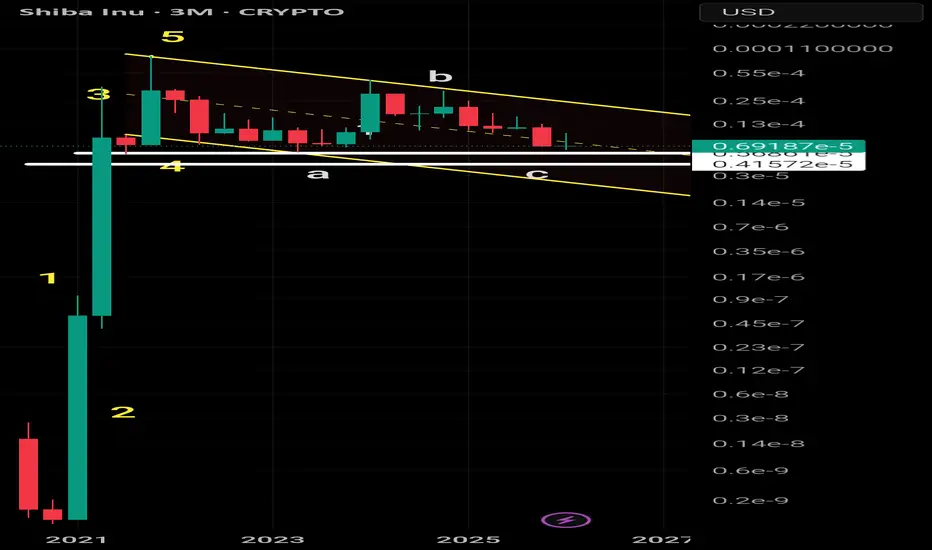
Based on my personal interpretation of the current Elliott Wave Principle structure, SHIBA may be approaching the completion of its first major corrective cycle. Either the correction has already ended, or the market may require only the completion of the remaining lower-degree waves before a new motive cycle can begin.
This view is based on my wave count, Fibonacci relationships, and the current price structure. According to Elliott Wave theory, once a valid corrective structure is complete, the market is expected to transition into a new motive phase. However, if additional time is still needed for the correction, I would expect that to appear through one of the recognized Zigzag-family structures or another valid corrective combination.
From my current wave count, both the aggressive and conservative trigger levels represent the first meaningful signs that a new bullish phase could be developing. As always, this scenario remains valid only while the market continues to respect the current wave structure and Elliott Wave rules.
If this interpretation proves correct, the larger question will not be whether another correction occurs, but at what degree of the new motive cycle that correction will eventually develop. Only the evolution of market structure can answer that question over time.
For that reason, I currently view the possibility of a Golden Era for SHIBA as a structural scenario rather than a prediction. If the present wave count continues to unfold as expected, the long-term Fibonacci objectives suggest the potential for a much larger bullish cycle than many market participants currently anticipate.
History has repeatedly shown that the market's largest trends are rarely obvious before they begin. The objective of this analysis is not to predict the future with certainty, but to identify the most probable path based on the structure available today.
In my opinion, Elliott Wave Principle is more than a forecasting technique. It is a structural framework for understanding market behavior. Prices may change, but structure follows recognizable rules, and the analyst's role is to interpret those structures objectively as they continue to evolve.
Mr. Nobody
Patterns whisper. I listen. 🎧📊
In-depth trading ideas
Two Valid Elliott Wave Scenarios Before the Next Bullish PhaseSHIBA Daily | Two Valid Elliott Wave Scenarios Before the Next Bullish Phase
A closer examination of the daily chart suggests that the current corrective structure can be interpreted in two valid ways under the Elliott Wave Principle.
The first scenario considers the correction as a completed or nearly completed Double Zigzag (W-X-Y). If this interpretation is correct, SHIBA may already be approaching the end of its higher-degree correction, allowing the market to begin building a new bullish cycle.
The second scenario views the structure as a Simple Zigzag (A-B-C), where both Waves A and C are developing as impulse patterns. Based on this wave count, the market could currently be completing Wave (4) of Wave C, leaving room for one final decline to complete Wave (5) before the correction is fully finished.
At this stage, both interpretations remain structurally valid. Therefore, the focus should not be on predicting which scenario must occur, but on observing how price action and the evolving wave structure confirm or invalidate each possibility.
If the Double Zigzag scenario is confirmed, the current region could represent the completion of the corrective phase. On the other hand, if the Simple Zigzag interpretation continues to unfold, one additional bearish leg may be required before a larger bullish motive sequence can begin.
In my view, the current structure deserves close attention. Rather than anticipating the future, I prefer to let the market reveal its intentions through the evolution of price and wave structure. As always, the primary objective is to follow the structure—not to force a preferred scenario.
Mr. Nobody
Patterns whisper. I listen. 🎧📊
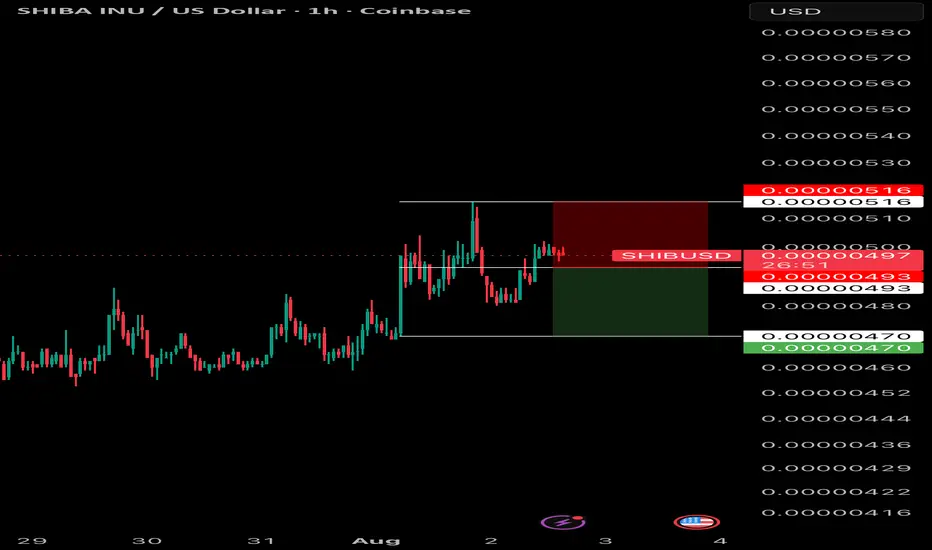
Shib trade updateTRADE CLOSURE UPDATE – SHIB/USD 📊
Pair: SHIB/USD
Status: Trade Closed Early ❌
Analysis:
The price is failing to show any significant momentum and has entered a tight consolidation range. Since the market is moving sideways with minimal volume, it's best to exit now (at breakeven / slight profit) rather than tying up capital.
Protecting capital is priority #1. We’ll wait for a clearer opportunity! 💡💵
Trading Signal: SHIB/USD (Short Position)📉 Trading Signal: SHIB/USD (Short Position)
* Pair: SHIB/USD (1H Timeframe)
* Position: Short / Sell 🔴
🎯 Trade Levels:
* Entry Price: 0.00000493 (or Market Price: 0.00000497)
* Stop Loss (SL): 0.00000516 🛑
* Take Profit (TP): 0.00000470 🎯
> ⚠️ Risk Management: Always use proper risk management and position sizing before entering the trade!
>
Sal......👇
* CRYPTOCAP:SHIB 4H | Bearish Outlook*
Price: *0.0000046027* (-4.70%)
*Key Points:*
1. *Rejection at Supply Zone*: SHIB got rejected hard from the 0.0000057621 resistance zone. This red box is acting as strong supply.
2. *Lost CG Level*: Price failed to hold above 0.0000048764. Now trading below it at 0.0000046027. As long as we’re under this level, bears are in control.
3. *Next Target*: The big green demand zone sits around *0.0000025509*. If we lose current support, the next drop could target this area. That’s another ∼45% down from here.
*Bias*: Bearish until price reclaims and closes above 0.0000048764.
*Invalidation*: 4H close above 0.0000057621 flips structure bullish.
Not financial advice. Trade at your own risk.
#SHIB #ShibaInu #Crypto #TradingView #Bearish
The most significant chart of inefficiency: SHIBA INUCould Shiba have created one of the most significant Double Tops in the history of assets?
Shib, along with a large portion of the Memecoin sector, is currently entering a crypto winter that COULD potentially reset nearly all tokens, coins, and memes lacking inherent utility, broad adoption, or significant social awareness.
Consider the 38 million coins that have been produced.
Which ones are truly necessary to you?
Which ones offer you real value or utility?
Which ones might be able to substitute certain elements of traditional finance?
A casino can certainly be entertaining.
But is living in a casino every day what you really want?
SHIB: liquidity sweep before bullish reversionThe Macro Picture 🗺️
SHIB's structural reset has fully extended — the $0.00000540 macro floor that held the range for four months has broken on a sustained close, the prior invalidation level at $0.00000510 was swept, and price has dropped into the lower extension. RSI now reads sub-30 with its moving average curling flat after a near-vertical descent, the textbook condition for sellers to exhaust. The broken floor pocket above now sits as the natural mean-reversion magnet, and a final liquidity sweep into the $0.00000470 pocket would clear the last layer of resting longs before that reaction unfolds.
The Setup ⚙️
The Trigger: A clean final flush into the $0.00000470 liquidity pocket would trigger sell stops parked beneath the local lows and trap late breakdown shorts who chased the move under $0.00000510 — the exact fuel a structural reversion needs.
The Reaction: RSI has compressed into sub-30 territory with its smoothing curling underneath, signaling momentum is stretched to the downside. A bullish divergence printing against a $0.00000470 sweep would confirm the exhaustion read is in play.
The Buy Area: The $0.00000470–$0.00000490 pocket is the high-confluence zone where structural buyers reload — the kind of capitulation print where averaging-based entries take advantage of forced selling before the bounce develops.
The Roadmap: Primary target sits at $0.00000540 — once the sweep traps late shorts, the path back into the broken floor zone becomes the dominant relief trade, with extension toward $0.00000570 if polarity reclaims cleanly. Invalidation: a sustained 2D close below $0.00000460 would invalidate this reversal thesis and confirm the macro descent is extending into a deeper structural leg.
SHIB at macro floor: sweep before range reversionThe Macro Picture 🗺️
SHIB has spent 2026 tracing a measured structural reset — from the $0.00001000 macro ceiling printed in January, price descended in clean stair-steps before carving a multi-month range floor near $0.00000540. The body of that range has acted as a volatility playground between $0.00000570 and $0.00000680, with bulls and bears trading the same pocket for nearly four months. Price has now slipped back to the lower boundary, and the macro floor desperately needs to be tested.
The Setup ⚙️
The Floor: The $0.00000540 macro floor is the line in the sand for the entire range structure. Bears are pressing into it while RSI breaks below 40 and its moving average curls lower, confirming momentum has handed short-term control back to sellers.
The Squeeze: The range pocket between $0.00000570 and $0.00000680 has compressed for months, and the path of least resistance now points to a clean sweep of the floor to clear out over-leveraged longs parked just beneath.
The Accumulation Zone: A deeper flush into the $0.00000510–$0.00000540 pocket opens a textbook area for staggered, averaging-based entries — the kind of high-confluence zone where structural buyers reload before the next macro reaction.
The Roadmap: Primary target sits at $0.00000680 — once the floor sweep traps late shorts, the path back toward the range ceiling becomes the dominant mean-reversion trade. Invalidation: a sustained 2D close below $0.00000510 would invalidate this reversal thesis and confirm the macro descent is extending toward sub-$0.00000500 liquidity.
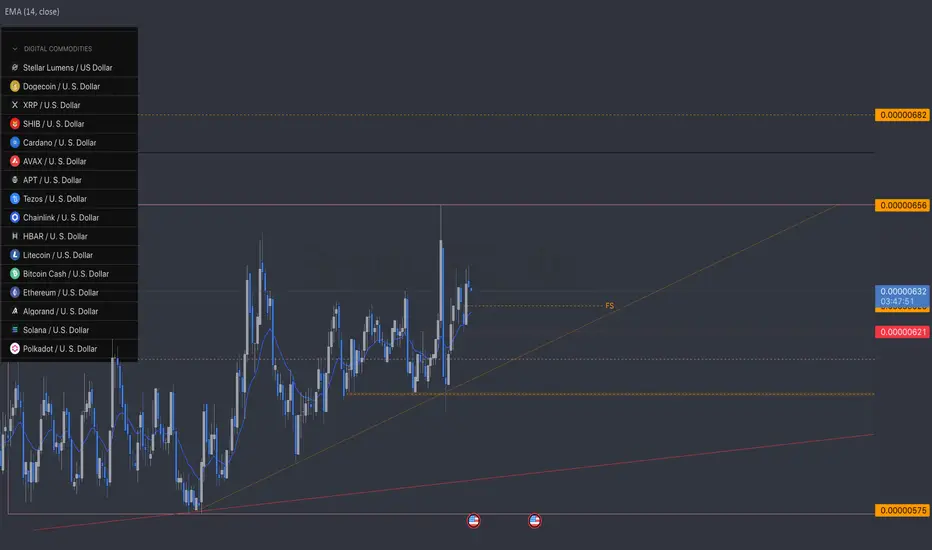
SHIB | May 2026 | 4hr Chart16 Digital Asset Commodities listed by the SEC is listed on the chart.
SHIB is listed at a Digital Asset Commodity and commodities are bought and sold in bulk.
Here are some levels of interest for those buying SHIB in bulk.
** T.A explained **
Multiple Time-Frame Analysis; Color Code:
Strength favors the higher timeframe.
Yearly timeframe = black
Monthly timeframe = pink
weekly = grey
daily = red
4hr = orange
1hr = yellow
15min = blue
5min = green if they are shown. (Level visibility on intervals is set to timeframe the level was found on and below to keep chart view organized.)
Ranges defined
A Range = two or more consecutive color candles (2+ in a row, same color creates a range)
There are two types of ranges - Accumulation Ranges &
Distribution Ranges.
*A single candle is a range on a lower timeframe. Mark the candle and then find the range / level on a lower timeframe aka "Range Finding".
Some people use boxes and call this boxing finding the zone - supply & demand zones - and marking the entire range top to bottom. This is acceptable but introduces risk by increasing probability of orders getting filled.
Candle Science further defines the zone / range into levels. So. after finding a range, identify and label the first and last candle of the range.
This is Candle Science. Everything has a default expectation and users thinking is guided by IF/THEN statements.
Below are the default expectations for each range and the first and last candle within the range.
DISTRIBUTION RANGES:
When price is above a distribution range its default expectation is to support price accumulation.
The first distribution candle in a distribution range is labeled as the BackSide Candle (BS).
Expectation = strong reaction to price. Look for price action to create long wicks reaching to or away from level. A steep angle trend is expected to form so Fair Value Gaps are expected to form on the timeframe of the level and lower timeframes.
If a steep angle trend is not forming, and long wicks are not being created then the idea is that liquidity is not there, confidence in the level is low. Price Action may then be looking for more liquidity to and seek it out at the FrontSide Candle.
FrontSide (FS) Candle = The last distribution candle in a distribution range.
Expectation = create a low angle accumulation trend reversal.
3 bar reversal patterns laddering up
like the distribution candles are the rungs of an accumulation ladder. price uses the top side of the BackSide Candle or the top side of the FrontSide Candle as support. They are used in bull flags to break distribution trends.
IF price fails to gain a BackSide or FrontSide level THEN they act as RESISTANCE. But we will then train our eyes to look at the bottom side of Accumulation Ranges because they have a default expectation as Resistance.
When Price is below an accumulation candle, the bottom side of the accumulation candle is the level of resistance.
ACCUMULATION RANGES DEFINED:
Inverse BackSide Candle (Inv.BS) = the first accumulation candle in an accumulation range.
Expectation. = strong reaction to price. long wicks reaching to or away from level. Creates a steep angle distribution trend. Usually create F.V.G's and impulsive, volatile moves like the BackSide Candle.
Inverse FrontSide Candle (Inv.FS) = The last accumulation candle in an accumulation range.
Expectation = reversal, create a low angle distribution trend. The bottom side of the accumulation candles are used as resistance levels.
TOOLS USED:
Boxes - used to define a zone by marking the entire range (if its small) or just one entire candle or just the wick of the candle to define the zone.
Horizontal Ray tool - used to define the level.
levels when dashed lines are untested, active level where buyers or sellers are waiting to create a level of interest.
Tested levels are dotted lines. If used, they reference the range and could become Origin levels or R.a.t.s in the future (levels where new trends originate or where traders are using Rejection as A Target to scalp and reverse position - aka stoploss hunters; like the rats they are.
Again the color code:
Yearly timeframe color is Black
Monthly timeframe is color pink
weekly grey
daily is red
4hr is orange
1hr is yellow
15min is blue
5min is green if they are shown.
strength favors the higher timeframe.
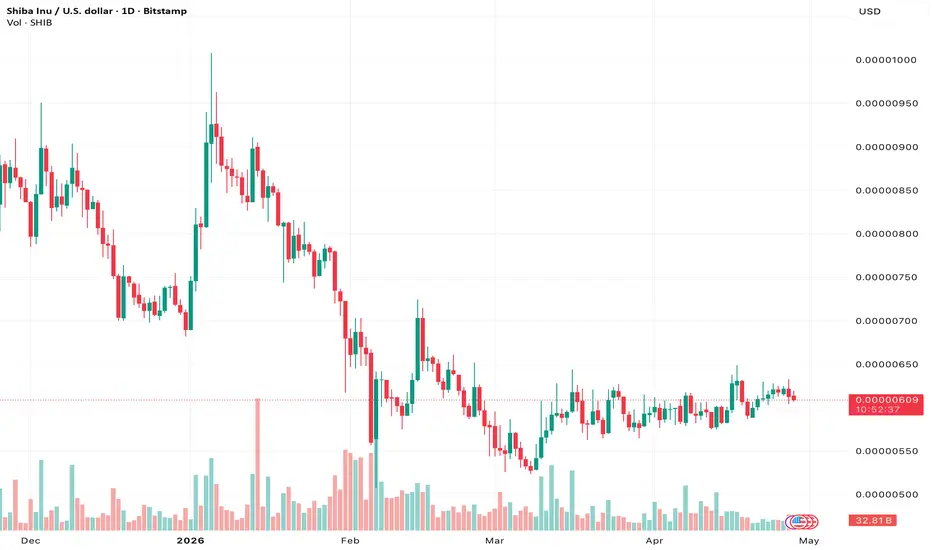
Shiba Inu Forecast: Will SHIB Rise or Drop Further?SHIB/USDT is currently trading in a consolidation phase after a long period of weakness. Shiba Inu remains one of the most popular memecoins, but its price structure continues to reflect strong dependence on market sentiment, momentum and speculative demand.
After losing a large share of its value from the October 2021 all-time high, SHIB is now moving sideways within a narrow short-term range. The latest price action shows no clear trend direction, with the EMA-20 running almost flat and price trading slightly below it.
From a technical perspective, SHIB remains neutral to mildly bearish in the short term. The RSI is around 45.6, below the neutral 50 level, which suggests that buyers have not yet regained control. Bollinger Bands indicate moderate volatility, while the current range remains limited between nearby support and resistance zones.
Key support levels are located around 0.00000603 USD and 0.00000596 USD. Resistance is visible near 0.00000620 USD and 0.00000629 USD. As long as SHIB trades below the EMA-20 and fails to break above resistance, upside momentum remains limited.
A bullish signal would require a sustained move above 0.00000629 USD, ideally supported by RSI moving above 50 and a close above the EMA-20. In that case, SHIB could attempt a move toward 0.00000640 USD.
On the downside, a break below 0.00000603 USD could increase selling pressure and open the way toward the 0.00000580–0.00000595 USD area. Such a move would likely be confirmed by RSI falling below 40 and the EMA-20 turning lower.
Possible scenarios:
Neutral scenario:
SHIB continues sideways between roughly 0.00000600 and 0.00000625 USD. This remains the most likely scenario while RSI stays between 45 and 55 and the EMA-20 remains flat.
Bullish scenario:
A breakout above 0.00000629 USD could trigger short-term bullish momentum, especially if RSI climbs above 50.
Bearish scenario:
A loss of the 0.00000603 USD support could lead to a faster decline toward 0.00000580–0.00000595 USD.
Overall, SHIB is still in a waiting phase. The next decisive move will likely depend on whether price can reclaim the EMA-20 and break above resistance, or whether support fails and sellers regain momentum.
$SHIB LIQUIDITY ZONE //PROCEED WITH CAUTION//We have just stepped into NEW all-time low territory, could we go lower absolutely, but if not, this is what they call the liquidity zone this is where we begin to load up on all the Shib we can get I expect it to go lower to 0.00000302 before we see a bounce upwards if it breakout lower below this point there is no telling how much more freefalling there will be. Proceed with caution
SHIB | March 2026- T.A explained -
BackSide (BS)
FrontSide (FS)
Inverse BS (Inv.BS)
Inverse FS (Inv.FS)
BS & FS levels are expected support when dashed lines, tested when dotted and resistance when solid lines.
The inverse is true for the Inv. BS Inv. FS levels, they are resistance as dashed lines, tested as dotted and support as solid lines.
Monthly timeframe is color pink
weekly grey
daily is red
4hr is orange
1hr is yellow
15min is blue
5min is green if they are shown.
strength favors the higher timeframe.
Shiba Inu under pressure as sellers defend key resistance:Current Price: 0.0000062 (Analysis was generated on Monday Morning)
Direction: SHORT
Confidence level: 62%(Several professional traders describe weak momentum, capped upside, and selling pressure near resistance, outweighing longer-term bullish community narratives.)
Targets
Target 1: 0.0000058
Target 2: 0.0000055
Stop Levels
Stop 1: 0.0000068
Stop 2: 0.0000072
Key Insights:
Here’s what’s driving this setup. Multiple traders describe SHIB as “surviving” rather than thriving, which matters. That language usually shows up when an asset is holding support but lacking real buying pressure. At the same time, traders repeatedly mention that a 2021-style rally is very unlikely in the current 2026 market structure, reinforcing the idea that upside expectations are capped short term.
What also stands out is positioning around resistance. Several traders are watching the $0.0000068–$0.0000070 zone, noting that price has struggled to hold above it. When assets keep stalling below the same level, the wisdom of traders usually leans toward fading rallies rather than chasing breakouts.
Recent Performance:
SHIB has been drifting lower over the past week, with daily bounces failing to build momentum. Weekly performance remains negative, and price action has stayed compressed between roughly $0.0000056 and $0.0000068. That kind of range, combined with lower highs, often precedes another leg down rather than a clean upside break.
Expert Analysis:
Several professional traders are highlighting bearish momentum on the charts. SHIB is trading below key moving averages, and traders note that every bounce is being met with supply. On-chain commentary also points to exchange inflows, which traders typically interpret as preparation to sell, not accumulate. While a few traders remain optimistic longer term, their outlook is framed over months, not this week.
News Impact:
The news flow isn’t providing fresh fuel for buyers. Shibarium progress and burn narratives are still mentioned, but traders broadly agree these factors aren’t strong enough right now to overpower technical weakness. In 2026, traders are demanding real traction and volume, and SHIB isn’t delivering that this week.
Trading Recommendation:
Putting it all together, I’m leaning SHORT on SHIB for the next 5–7 days. I’d look for downside toward $0.0000058 first, with $0.0000055 as a stretch target if selling accelerates. I don’t want to see price reclaim and hold above $0.0000068 — that’s my first invalidation level. Confidence isn’t extreme, so position sizing matters here. This is a tactical short, not a long-term call on the project.
SHIBUSD Testing Major 2021 Support – Potential Wedge CompletionShiba Inu (SHIBUSD) is currently testing its 2021 lows, a very strong and significant support level at the former wave 4 swing low. Notably, price action may also be completing subwave (5) of a wedge pattern within wave C of a larger ABC zig-zag corrective decline.
This structure suggests that a rebound could develop soon. However, the first meaningful bullish confirmation would only come with a move above the former wave (4) swing high. Until then, the broader corrective pressure remains intact despite the potential for a short-term bounce.
SHIBA: Testing the Final Line of Defense
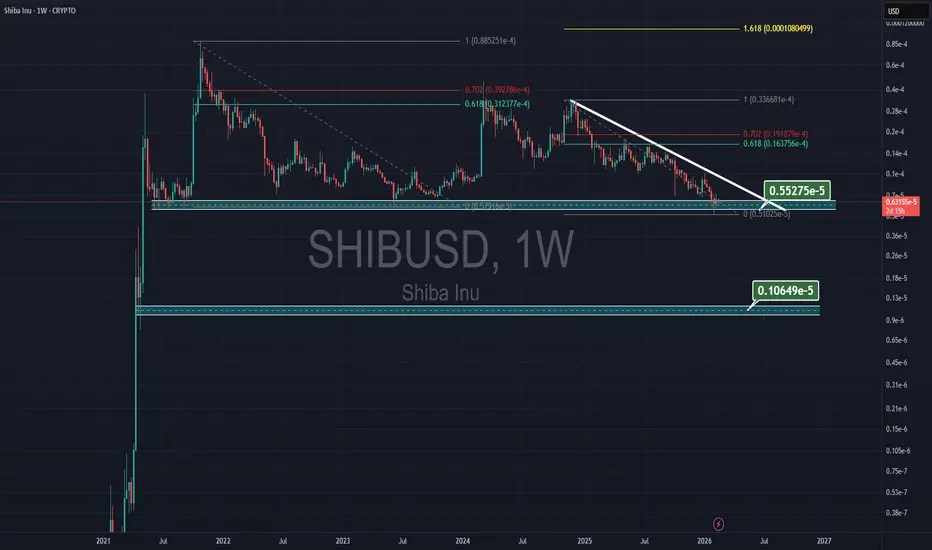
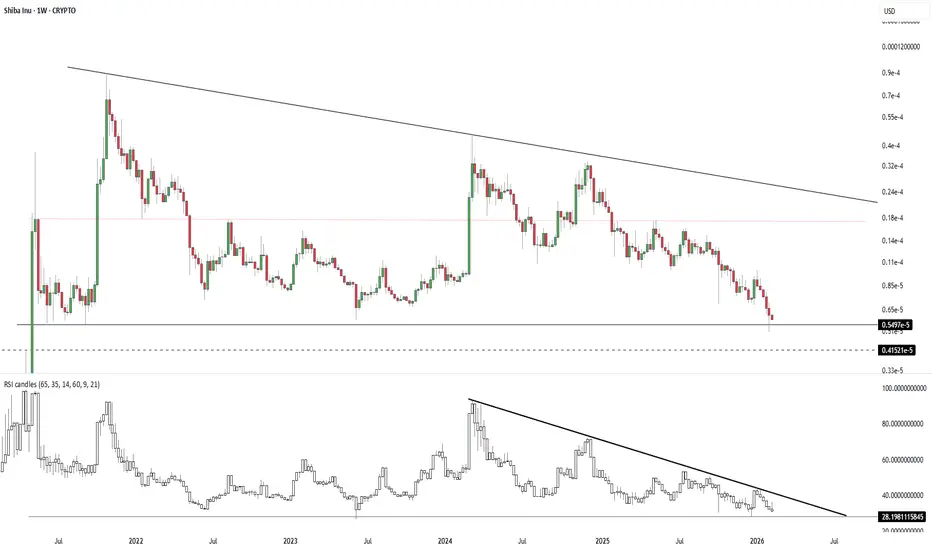
Major Support Zone (The "Floor"): The price is currently hovering right above the critical historic support level at $0.00000549. This zone acts as the "last line of defense."
Bullish Scenario: If this level holds, it presents a high Risk/Reward (R/R) long opportunity, as it has historically been a strong accumulation zone for Smart Money.
Bearish Risk: A weekly close below this level could trigger a free fall towards the $0.00000415 region (dashed line).
Descending Resistance The asset has been strictly respecting a multi-year bearish trendline. The price is being squeezed between this dynamic resistance and the horizontal support. A breakout above this diagonal trendline is the primary validation required for a trend reversal.
RSI Divergence & Compression: The Weekly RSI is currently at 31, sitting in the oversold territory. More importantly, the RSI indicator itself is showing a breakout from its own downtrend structure. Momentum often precedes price; this suggests that the selling pressure is exhausted.
Market Psychology: We are in the "Boredom" and "Disbelief" phase. Volume is low, and retail interest has faded. Historically, these periods of maximum compression and low volatility are where cycles bottom out before the next expansion phase.
Conclusion: This is a "Do or Die" moment for SHIB. Watch for a high-volume breakout above the descending trendline to confirm the reversal. Until then, patience is key.
Shiba updateShiba, a coin that had grown by more than 1 million percent in 14 months, has now declined for 51 months. Why?
The first wave of Shiba gave more than 1 million percent profit, and the wave has the right to rest for about 5 years. Now, after nearly 5 years, we are at the end of the huge and destructive wave 2.
I believe that it will grow as much as it has so far
As shown in the picture, I specified its supports
Dawn is near
shiba inu (SHIB)If Shiba Inu holds so much value, currently ~$5 billion, how come the chart is so lackluster for so many years? Developers spend too much money is my guess. When there is less development for a meme token, the token is more likely to do well, right? Because, if there is nothing happening behind the scenes, there is nothing to deplete the value of the tokens with no need to spend money, or so I'd like to think. Yet, there are always people who are also not in heavy development mode that still seem to spend their investment when the prices are high thus removing the potential long terms gains and future investors along the way.
SHIBA INU (SHIB) "current price < coinbase listing price" Shiba Inu proves to be predictably unsupported despite how popular it is for people to talk about their HODL and resistance to selling. The fact that so many people talked about buying Shiba Inu in the past four years and none of those holdings seem to prop up the price of Shiba Inu right now appears to prove meme tokens no matter how adapted and developed lose value faster than we realize. Tokens lose easier than Layer 1 blockchains. The interconnected value of layer 2 tokens means investing in a token will always offer more volatility. On the gains side there is an upside, on the other side that means greater percentages to impact the decline during a selling frenzy. Knowing the price of Shiba Inu is below the price of first listing to Coinbase, is it still worth it to invest time and money into a meme token in 2026 if the price does not carry a supportive value for the long term investment? Is trading cryptocurrency tokens only valuable for short term gains and short term positions?