RWE AG
No trades
No trades
Compare with RWE AG
2.98 CHF
2.92 B CHF
16.41 B CHF
713.04 M
Next report date
—
Report period
—
EPS estimate
—
Revenue estimate
—
Details
Sector
Industry
CEO
Markus Krebber
Website
Headquarters
Essen
Founded
1999
IPO date
Feb 25, 2008
ISIN
DE0007037129
FIGI
BBG000BCC3T9
Identifiers
ISIN DE0007037129
RWE AG is a holding company, which engages in generating electricity and gas from renewable and conventional sources. It operates through the following segments: Offshore Wind, Onshore Wind and Solar, Hydro, Biomass, and Gas; Supply and Trading; and Coal and Nuclear. The Offshore Wind segment focuses on development and realization of projects to expand capacity. The Onshore Wind and Solar segment include onshore wind, solar power, and parts of battery storage. The Hydro, Biomass, and Gas segment is involved in activities with run-of-river, pumped storage, biomass, and gas-fired power plants. The Supply and Trading segment offers proprietary trading of energy commodities and intermediary trading with pipeline gas and LNG. The Coal and Nuclear segment cover electricity production using coal and nuclear power, as well as lignite mining operations. The company was founded on April 25, 1898, and is headquartered in Essen, Germany.
RWE - An observation on price actionXETR:RWE
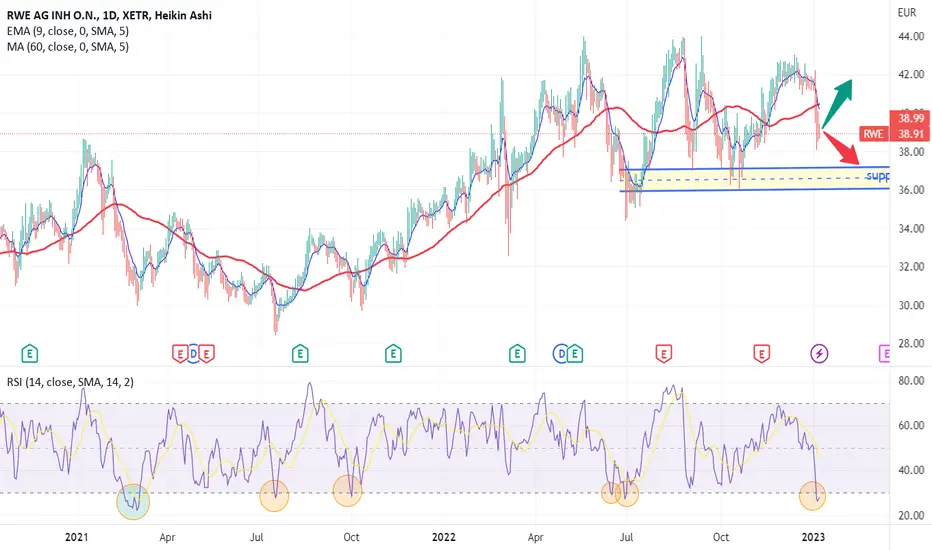
With using HeikinAshi candles and daily TF on $RWE, ma shows it starts a downward movement. But rsi broke the 30 line which is very rare case.
Normally rsi does a single reverse from the 30 line but there are some dates to consider. For example feb-mar 2021 which rsi and price action cont
An observation on RWEXETR:RWE
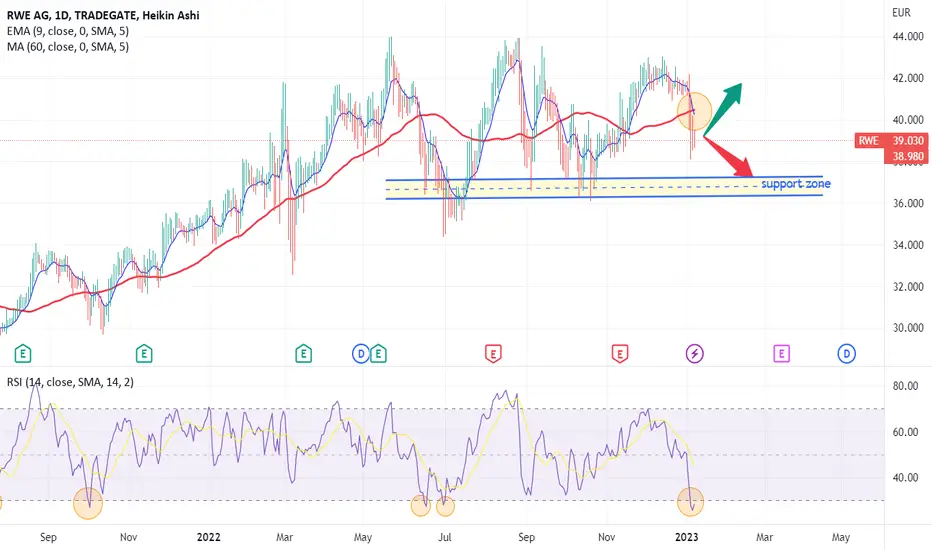
With using HeikinAshi candles and daily TF on $RWE, ma shows it starts a downward movement. But rsi broke the 30 line which is very rare case.
Normally rsi does a single reverse from the 30 line but there are some dates to consider. For example feb-mar 2021 which rsi and price action cont
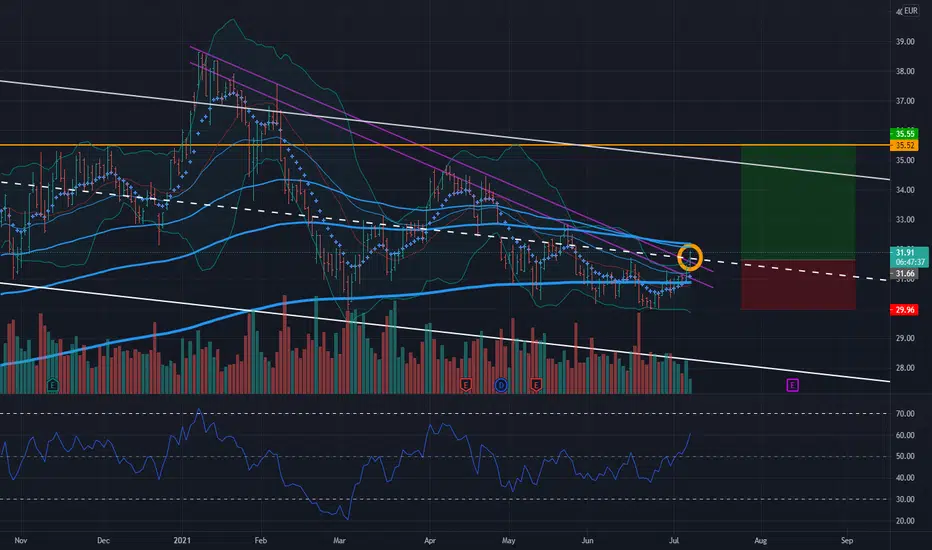
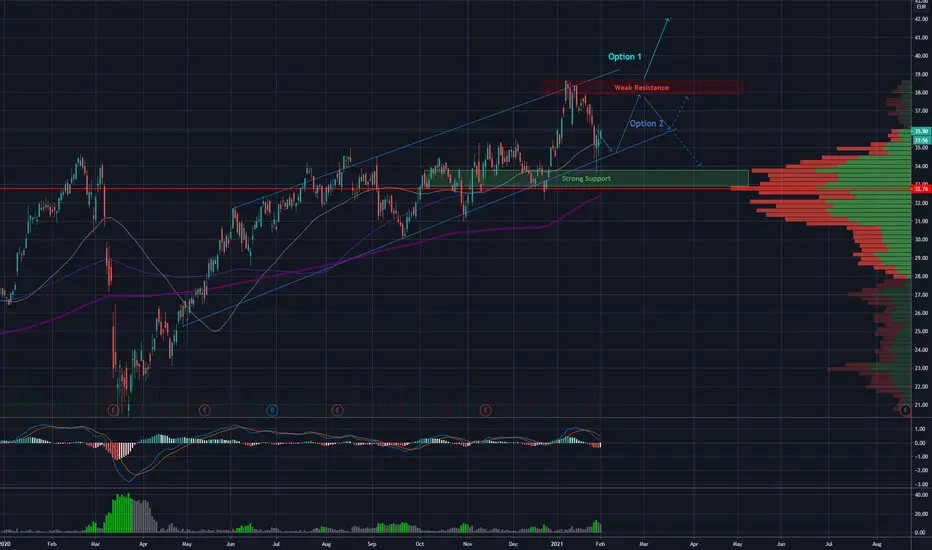
Long RWE if strong support holdsStarting from mid of May 2020 the stock used to be always above 200 SMA.
At the beginning of the year it was way too far away from 200 SMA that's why it was consolidating in the last weeks.
Option 1) Given the lower trendline and strong support indication based on volume the stock could bounce an
RWEHello everyone,
A good opportunity has been detected on the RWE stock.
After strong upward movement on the RWE, the price
is currently correcting to the downside.
We are expecting the price to reach approximately the 31.000
price level, which is also a major psychological support point,
where we h
See all ideas
Summarizing what the indicators are suggesting.
Neutral
SellBuy
Strong sellStrong buy
Strong sellSellNeutralBuyStrong buy
Neutral
SellBuy
Strong sellStrong buy
Strong sellSellNeutralBuyStrong buy
Neutral
SellBuy
Strong sellStrong buy
Strong sellSellNeutralBuyStrong buy
An aggregate view of professional's ratings.
Neutral
SellBuy
Strong sellStrong buy
Strong sellSellNeutralBuyStrong buy
Neutral
SellBuy
Strong sellStrong buy
Strong sellSellNeutralBuyStrong buy
Neutral
SellBuy
Strong sellStrong buy
Strong sellSellNeutralBuyStrong buy
Displays a symbol's price movements over previous years to identify recurring trends.
6.241% YTM
Maturity dateSep 18, 2055
Coupon5.88% (Fixed)
5.599% YTM
Maturity dateSep 18, 2035
Coupon5.13% (Fixed)
5.509% YTM
Maturity dateApr 16, 2034
Coupon5.88% (Fixed)
4.197% YTM
Maturity dateJul 6, 2037
Coupon4.00% (Fixed)
3.931% YTM
Maturity dateFeb 13, 2035
Coupon4.13% (Fixed)
3.857% YTM
Maturity dateNov 26, 2033
Coupon1.00% (Fixed)
3.767% YTM
Maturity dateJul 6, 2032
Coupon3.38% (Fixed)
3.627% YTM
Maturity dateJan 10, 2032
Coupon3.63% (Fixed)
3.331% YTM
Maturity dateMay 24, 2030
Coupon2.75% (Fixed)
3.320% YTM
Maturity dateJun 11, 2031
Coupon0.63% (Fixed)
3.260% YTM
Maturity dateFeb 13, 2029
Coupon3.63% (Fixed)
See all RWE bonds
Weight0.10%
Market value671.46 M
Weight0.14%
Market value446.73 M
Weight0.17%
Market value318.41 M
Weight2.19%
Market value213.45 M
Weight2.19%
Market value213.45 M
Weight2.47%
Market value196.65 M
Weight2.22%
Market value175.99 M
Weight2.22%
Market value175.99 M
Weight0.20%
Market value151.68 M
Weight1.41%
Market value131.36 M
Weight1.41%
Market value131.36 M
Explore more ETFs
Frequently asked questions
The current price of RWE is 53.46 CHF — it hasn't changed in the past 24 hours. Watch RWE AG stock price performance more closely on the chart.
Depending on the exchange, the stock ticker may vary. For instance, on SIX exchange RWE AG stocks are traded under the ticker RWE.
RWE stock hasn't changed in a week, the last month showed zero change in price, over the last year RWE AG has showed a 114.96% increase.
We've gathered analysts' opinions on RWE AG future price: according to them, RWE price has a max estimate of 69.70 CHF and a min estimate of 51.12 CHF. Watch RWE chart and read a more detailed RWE AG stock forecast: see what analysts think of RWE AG and suggest that you do with its stocks.
RWE stock is 0.00% volatile and has beta coefficient of 0.84. Track RWE AG stock price on the chart and check out the list of the most volatile stocks — is RWE AG there?
Today RWE AG has the market capitalization of 42.62 B, it has decreased by −0.60% over the last week.
Yes, you can track RWE AG financials in yearly and quarterly reports right on TradingView.
RWE AG is going to release the next earnings report on Aug 13, 2026. Keep track of upcoming events with our Earnings Calendar.
RWE earnings for the last quarter are 0.78 CHF per share, whereas the estimation was 0.48 CHF resulting in a 62.42% surprise. The estimated earnings for the next quarter are 0.58 CHF per share. See more details about RWE AG earnings.
RWE net income for the last quarter is 18.47 M CHF, while the quarter before that showed 773.76 M CHF of net income which accounts for 0.00% change. Track more RWE AG financial stats to get the full picture.
Yes, RWE dividends are paid annually. The last dividend per share was 1.10 CHF. As of today, Dividend Yield (TTM)% is 2.04%. Tracking RWE AG dividends might help you take more informed decisions.
RWE AG dividend yield was 2.65% in 2025, and payout ratio reached 27.89%. The year before the numbers were 3.82% and 15.93% correspondingly. See high-dividend stocks and find more opportunities for your portfolio.
As of Jul 25, 2026, the company has 20.12 K employees. See our rating of the largest employees — is RWE AG on this list?
EBITDA measures a company's operating performance, its growth signifies an improvement in the efficiency of a company. RWE AG EBITDA is 2.74 B CHF, and current EBITDA margin is 16.58%. See more stats in RWE AG financial statements.
Like other stocks, RWE shares are traded on stock exchanges, e.g. Nasdaq, Nyse, Euronext, and the easiest way to buy them is through an online stock broker. To do this, you need to open an account and follow a broker's procedures, then start trading. You can trade RWE AG stock right from TradingView charts — choose your broker and connect to your account.
Investing in stocks requires a comprehensive research: you should carefully study all the available data, e.g. company's financials, related news, and its technical analysis. So RWE AG technincal analysis shows the buy rating today, and its 1 week rating is buy. Since market conditions are prone to changes, it's worth looking a bit further into the future — according to the 1 month rating RWE AG stock shows the buy signal. See more of RWE AG technicals for a more comprehensive analysis.
If you're still not sure, try looking for inspiration in our curated watchlists.