SNX Major Resistance Test, Breakout or Rejection?📊 Technical Analysis — NYSE:SNX
💵 Pair: SNX/USDT
⏳ Time Frame: 3D
📍 Current Price: Around $0.2614
📐 Pattern: Descending Channel
---
📉 Pattern Overview — Descending Channel
SNX/USDT appears to be moving within a Descending Channel, formed by two downward-sloping trendlines:
🔴 Upper Trendline / Resistance
Acts as dynamic resistance and has repeatedly limited upward price movement.
🟡 Lower Trendline / Support
Acts as dynamic support where price has previously reacted and bounced.
📉 The chan
Synthetix / Tether USD
No trades
No trades
In-depth trading ideas
SNXUSDT: Model 1 Accumulation — The Market Is Showing Its HandSNX is currently sitting in a confirmed Model 1 accumulation schematic , and the expected order flow from this structure is relatively straightforward.
My technical objective sits around $0.44 , representing roughly a 90% spot expansion from the area I'm tracking.
This isn't about predicting every candle between here and the target.
It's about understanding what the range is building and positioning around the expected order flow before the expansion becomes obvious.
The accumulation is th
SNX/USDT H2: Upside momentum against a strong trend🎯 TP1: $0.247250 (+6.67%) │ TP2: $0.253281 (+9.27%)
🛑 SL: $0.212272 (-8.42%) │ R/R: 1 : 1.1
⚠️ SL is placed beyond recent candle wicks to reduce the risk of accidental stop-outs
FUNDAMENTAL BACKGROUND
SNX is trading without its own catalysts, following the overall improvement in crypto market sentiment. The Fear & Greed Index has risen from 38 to 62 over the week, indicating increased risk appetite. After the liquidation of BTC and ETH shorts, altcoins—including SNX—have gained support. The mac
SNX/USDT H4: Potential reversal from the bottom🎯 TP1: $0.196057 (+1.06%) │ TP2: $0.198114 (+2.12%)
🛑 SL: $0.190260 (-1.93%) │ R/R: 1 : 1.1
⚠️ SL is placed beyond the nearest candle tails to reduce the risk of accidental triggering
FUNDAMENTAL BACKGROUND
SNX is trading without its own catalyst, following the general altcoin trend. The US Consumer Price Index (CPI) data published on 12.08.2026 showed inflation slowing to 3.4% year-over-year compared to the previous 3.5%, supporting moderate risk appetite. However, geopolitical tensions betwee
SNX will turn bearish soon (4H)SNX seems to have started from where we placed the green arrow on the chart and has formed a Diametric pattern.
This Diametric pattern has been completed, and we expect it to enter a time-consuming bearish pattern.
The best zone for sell/short positions is the highlighted red area.
The targets are marked on the chart. Take some profit at the first target and then move your position to breakeven.
A daily candle close above the invalidation level will invalidate this analysis.
If you have a c
SNX: local squeeze with $0.29 destinationThe Macro Picture 🗺️
SNX unwound from the $0.3755 May high down to $0.191 in June, then bounced and settled into a base. Price is holding at $0.2225, well above the floor, coiling in the lower half of the range as it works off the downtrend.
The Setup ⚙️
The Range Floor 🟢
$0.191 (Macro Support) is the demand base. The June low was defended and price has built above it since — that's the floor this range pivots on.
The Decision Point 🔴
$0.3755 (Local High) is the bigger structural gate. Befor
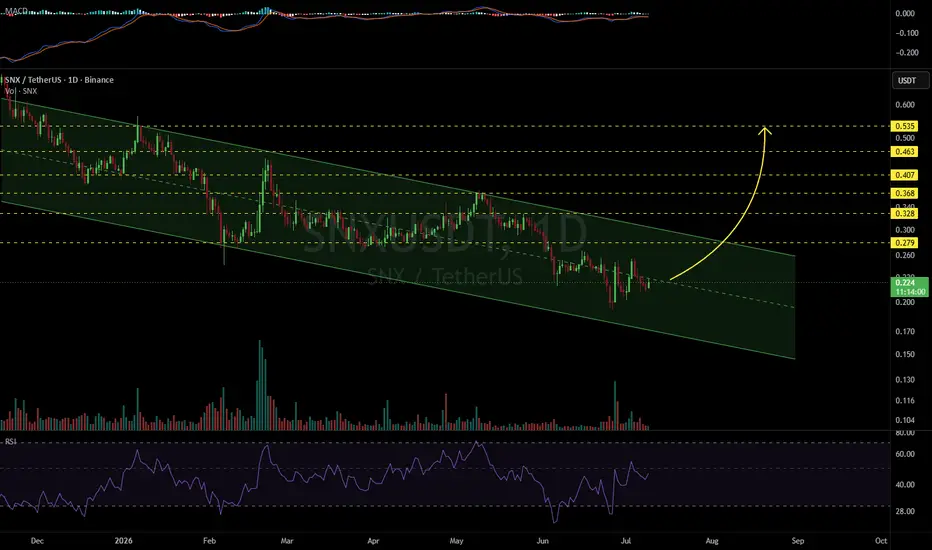
SNXUSDT 1D#SNX is moving inside a descending channel on the daily chart and is currently testing the channel's middle trendline.
In case of a breakout above the middle line, the first upside target is:
🎯 $0.279
If #SNX then breaks above the channel resistance, the remaining upside targets are:
🎯 $0.328
🎯 $0.368
🎯 $0.407
🎯 $0.463
🎯 $0.535
⚠️ Always remember to use a tight stop-loss and maintain proper risk management.
SNXUSDT Forming Bullish momentumSNXUSDT is currently forming a clear bullish momentum pattern, a classic wave structure that often signals an upcoming breakout. The price has been consolidating within a narrowing range, indicating that selling pressure is gradually weakening while buyers are beginning to regain control. With consistent volume supporting accumulation at lower levels, the setup suggests a strong potential for a bullish breakout in the near term.
If the price breaks above the wedge resistance, the projected move
SNXUSDT 1D#SNX is moving within a symmetrical triangle on the daily chart. It is facing strong resistance from the triangle resistance and the daily SMA100. 👉 Consider entering this coin only after a solid breakout; in that case, the potential upside targets are:
🎯 $0.376
🎯 $0.417
🎯 $0.457
🎯 $0.514
🎯 $0.587
⚠️ Always remember to use a tight stop-loss and maintain proper risk management.
Synthetix (SNX) · How long can a bullish move last?The market is heating up. Some of these charts will not even offer enough time to post.
Watch SNXUSDT and its price today. Watch the same chart next week, watch how fast things change.
Today we have a full green candle. SNXUSDT has been sideways for months, since early Feb.
There was one attempt at resistance, at higher prices, there are no attempts to challenge support. That is, after the 6-Feb low we have a bullish move with a flat bottom. Now we are seeing the start of a new move.
The que
SNXUSDT Tracking Final Leg of Downtrend or Reversal SetupSNXUSDT remains in a downtrend despite breaking its trendline, with price action still dipping. The current focus is on the potential completion of Wave 5, targeting the projected re-accumulation zone but this setup only activates if $0.548 support breaks.
If this level holds, a rebound could drive price toward the upside targets already outlined. On the flip side, a sudden breakout above $0.96 would invalidate the drop scenario entirely.
What’s your take on this structure? Drop your thoughts
SNXUSDT📈 SNXUSDT — High Probability Structure, Low Noise Execution
SNX is currently trading at 0.401 and structurally remains in an intact bullish regime.
This is not a hype move.
This is controlled continuation.
🧱 Structure Overview
• 4H trend: intact
• 1H trend: intact
• Price holding above MA200 on 4H and 1H
• Daily trend not fully aligned yet
This creates a mixed higher-timeframe regime — which means selectivity is critical.
📊 Probabilistic View
Current model alignment suggests:
UP: 90.9%
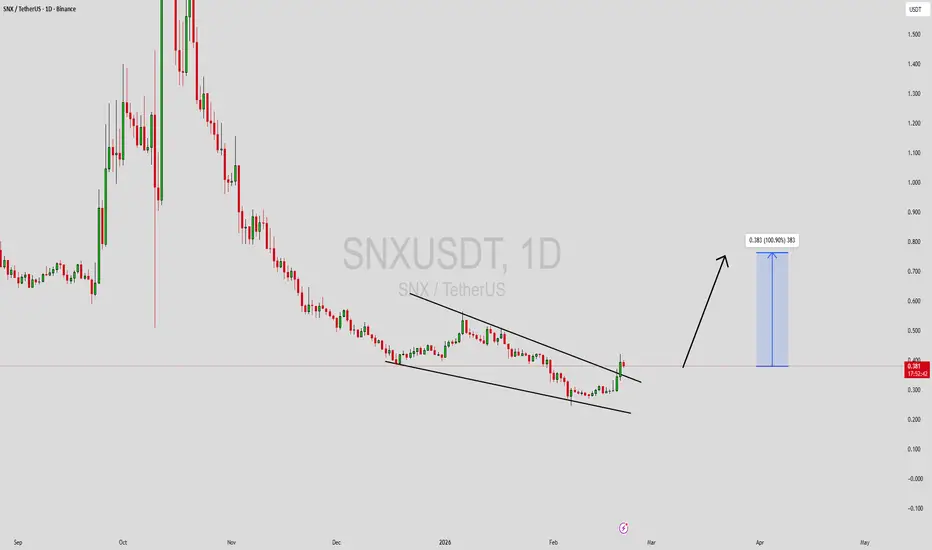
SNXUSDT Forming Falling WedgeSNXUSDT is forming a clear falling wedge pattern, a classic bullish reversal signal that often indicates an upcoming breakout. The price has been consolidating within a narrowing range, suggesting that selling pressure is weakening while buyers are beginning to regain control. With consistent volume confirming accumulation at lower levels, the setup hints at a potential bullish breakout soon. The projected move could lead to an impressive gain of around 90% to 100% once the price breaks above th
Synthetix turns bullish after all-time lowThe drop here has a two steps process and it starts with a rejection at MA200 in October 2025.
The first impulse lasted 10 weeks, 70 days of sustained bearish action. All candles closed red.
The second part, after three green weeks of relief, was much smaller, lasting four weeks/28 days.
The second part reveals the weakening aspects of the bearish move. The fact that it was that much smaller and the bounce that much stronger reveals the bottom is in. Synthetix already hit bottom two weeks ag
SNXUSDT Deep Bull 81% Premium Negative 7.8 Sigma Nears SqueezeSNXUSDT Deep Bull 81% Premium Negative 7.8 Sigma Nears Squeeze
SNXUSDT
Overview
SNXUSDT has strengthened since the prior read. Bias climbed from 78% to 81.4% with the deep timeframe now printing prime tier at 12 to 2. The recovery ratio expanded from 4.2x to 6.7x breakout plus territory. But the premium dislocation has widened further to negative 7.8 sigma and the Fut Only Trap flag remains active. The bull case is getting louder while the structural warning gets more extreme. Something has t
SNXUSDT 1D#SNX is breaking out above the descending resistance on the daily chart. If the daily candle closes above the trendline and we see a successful retest, the potential targets are:
🎯 $0.437
🎯 $0.556
🎯 $0.652
🎯 $0.747
🎯 $0.883
⚠️ Always use tight stop-losses and maintain strict risk management.
Synthetix (SNX), 150% move to market structure
Timeframe: Weekly chart
SNX has been doing what most altcoins do when nobody’s watching: slowly bleeding to death, then occasionally coughing up a dramatic candle just to keep you emotionally invested.
This is a high-risk, speculative setup. Not predicting enlightenment, we’re betting on the possibility that sellers have finally tired themselves out and the next meaningful sell pressure comes from buyers taking profit higher, not from fresh panic dumping down here.
Key Levels
Support (Base
Can #SNX Recover From Here or Will it Continue to Fall?Yello, Paradiser! Are you prepared for the moment when #SNXUSDT finally decides whether it will punish late bears or wipe out impatient longs? Let's look at the #Synthetix trade setup:
💎#SNX is currently trading around $0.418 on the 4H timeframe and remains stuck inside a clearly defined descending channel, respecting both the descending resistance and descending support with high precision. This type of structure tells us one thing very clearly: the market is compressing, and a decisive move i
SNX – The OG DeFi Token Awakens?SNX – The OG DeFi Token Awakens? 🧬🚀
Synthetix (SNX) is back on the radar, trading just above its historic base at $0.78–$0.88 — the same accumulation zone that birthed past monster runs.
This isn’t just nostalgia. The OG DeFi protocol is launching a new DEX in the coming weeks, built on L2 Ethereum. And yes — SNX was the first perpetuals DEX on-chain before it was even cool.
📊 Current Setup:
Strong base at $0.78–$0.88
Resistance targets: $2.04 → $5.08 → $14.06
Macro extension: $22.04
SNX/USDT Golden Zone 0.87–0.75 — Accumulation or Breakdown AheadSNX has returned to the golden zone at 0.87–0.75, a level that has historically acted as the main battlefield between buyers and sellers.
Price is now retesting the same area that once served as the foundation of a strong accumulation phase earlier this year.
But this time, the context is different — after a sharp rejection from the 3.68 high, the market is testing whether this zone still holds real demand strength or not.
---
📊 Technical Structure & Price Pattern
On the 2D chart, SNX has fo
SNXUSDT is a wild Dear Friends,
by reviewing the chart , the trader may be speechless for a while by following candles in bulish and bearish moves. it is really wild.
Synthetix is an ERC-20 token created by the Synthetix protocol that serves multiple purposes. In addition to serving as collateral on the protocol, by staking SNX, a holder will receive a portion of trading fees from the network as an incentive to contribute to the liquidity pools.
This token is worth having in your wallet in small amounts
but wa
SNXUSDT: Potential for Upward Momentum Towards $2.25SNXUSDT has demonstrated significant bullish momentum, breaking out of a consolidation phase with a remarkable +26.08% surge on October 19, 2025. This move pushed the price to a high of $1.7396, indicating strong buying pressure.
The price is currently situated above the crucial Fibonacci retracement level of 0.618 at approximately $1.9034. A successful retest and hold above this level could confirm the continuation of the uptrend. The daily Relative Strength Index (RSI) is at a healthy 59.71,
SLong