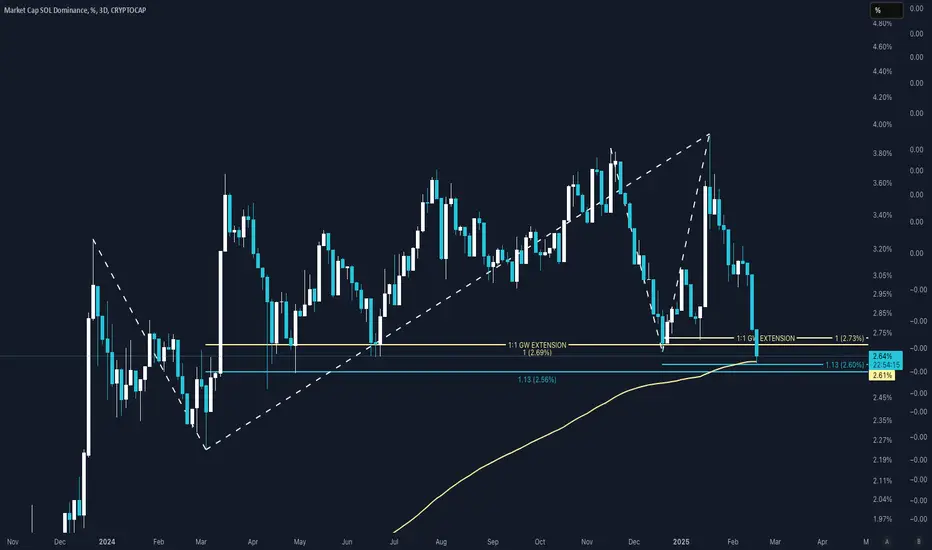
Potential Meme Coin Run SOL.D/ETH.D = Meme Coin Pump Anticipation
This savvy chart is a great tool at anticipating meme coin pumps. It shows when SOL is stealing share from ETH; hinting SOL meme pumps. We can see evidence of the nostalgic meme run from Jan '25 (yellow arrow marker).
Chart Structure: Expanded Flat 3-3-5
Market Cap SOL Dominance, %
No trades
No trades
Key data points
Previous close
—
Open
—
Day's range
–
Details
Coin
A Solana dominance story, the next chapter....SOL.D
1 month bars
Log Scale
Two major fib retracements
Left - nov '21 -> Dec '22 -> Jan '25
Right - Dec '22 -> Jan '25 -> Apr '25
From the bear cycle low the parabolic rally turned into a bearish rising wedge, bounded by higher highs and lower highs. this pattern ended with a SOL.D 3.97%.
Wi
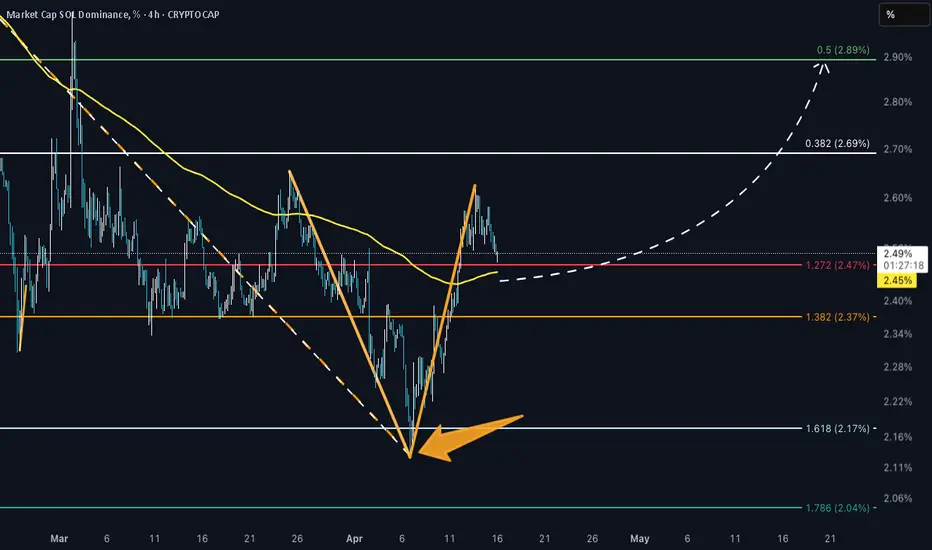
SOL.D 'V' Shape Recovery CRYPTOCAP:SOL.D
SOL.D tagged the high time frame 1.618 and has now formed a 'V' shaped recovery.
Price is currently on top of the 1:1.272 ratio band and sitting tight slightly above the 200 EMA. This area could turn into support here.
This suggests a nice wave up in the works for SOL and SOL
WARNING - SOLANA IS DEAD MartyBoots here , I have been trading for 17 years and sharing my thoughts on SOL here.
SOL is looking like ETH did last bull market
Do not miss out on SOL if it breaks down as this is a great opportunity to get out of the market and protect yourself
Watch video for more details
$SOL vs $ETH MCPublishing this to track this chart
Is a chart of SOL Market Cap dominance over ETH Market Cap dominance
A VERY bullish chart and classic uptrending chart, following supports/resistances, while playing respects to fibs.
Right now CRYPTOCAP:SOL is at 17% the market cap of CRYPTOCAP:ETH , expect
See all ideas
Summarizing what the indicators are suggesting.
Oscillators
Neutral
SellBuy
Strong sellStrong buy
Strong sellSellNeutralBuyStrong buy
Oscillators
Neutral
SellBuy
Strong sellStrong buy
Strong sellSellNeutralBuyStrong buy
Summary
Neutral
SellBuy
Strong sellStrong buy
Strong sellSellNeutralBuyStrong buy
Summary
Neutral
SellBuy
Strong sellStrong buy
Strong sellSellNeutralBuyStrong buy
Summary
Neutral
SellBuy
Strong sellStrong buy
Strong sellSellNeutralBuyStrong buy
Moving Averages
Neutral
SellBuy
Strong sellStrong buy
Strong sellSellNeutralBuyStrong buy
Moving Averages
Neutral
SellBuy
Strong sellStrong buy
Strong sellSellNeutralBuyStrong buy
Displays a symbol's value movements over previous years to identify recurring trends.
Frequently asked questions
Dominance is a coin's market cap relative to the total crypto market. It's expressed as a percentage and measured in US dollars. Solana dominance fluctuates over time, reflecting shifts in investor interest across the crypto market.
To observe relationships between cryptocurrencies and identify market leaders, explore the crypto market dominance charts and gain further insights from the crypto market cap charts.
A coin's dominance matters because it shows where capital is concentrated in the crypto market. Unlike price alone, dominance shows whether a coin is gaining or losing market share relative to others, helping traders identify its strength and shifts in investor sentiment.
Traders follow this metric to spot capital flows and changes in market conditions. Rising or falling dominance can signal when leadership is shifting between major coins and altcoins, supporting better timing in making informed decisions.
To find out what causes Solana dominance changes, read the latest crypto news and explore the community trading ideas.
Traders follow this metric to spot capital flows and changes in market conditions. Rising or falling dominance can signal when leadership is shifting between major coins and altcoins, supporting better timing in making informed decisions.
To find out what causes Solana dominance changes, read the latest crypto news and explore the community trading ideas.
A decline in Solana dominance may be caused by capital outflows or other coins gaining momentum. As a single metric, it does not indicate a potential price decline or growth. But when combined with other indicators, it can provide valuable insights into potential trend changes and a coin's performance.
For a broader view of the market, explore the Crypto Coins Heatmap and read the community's crypto trading ideas.
Dominance helps traders understand market structure and capital flows, adding valuable context beyond price signals alone.
By tracking dominance, traders can see where capital and overall market sentiment are moving. A good starting point is analyzing the SOL dominance chart. You can apply technical analysis tools such as indicators, drawing tools, and chart patterns to monitor its behavior and anticipate potential market shifts.
Dominance can also help identify broader trends. For example, BTC dominance has historically declined during certain market cycles, often coinciding with increased growth in altcoins. To spot and analyze such opportunities, you can use our crypto dominance charts.
By tracking dominance, traders can see where capital and overall market sentiment are moving. A good starting point is analyzing the SOL dominance chart. You can apply technical analysis tools such as indicators, drawing tools, and chart patterns to monitor its behavior and anticipate potential market shifts.
Dominance can also help identify broader trends. For example, BTC dominance has historically declined during certain market cycles, often coinciding with increased growth in altcoins. To spot and analyze such opportunities, you can use our crypto dominance charts.
Solana dominance = Solana market cap / total crypto market cap × 100%
Explore large-cap cryptocurrencies and discover more in the Crypto Coins Screener.
A rising dominance of a coin means its relative value in the crypto market is increasing compared to other coins. Even during market declines, some cryptocurrencies may gain market share in percentage terms, as they become more attractive to investors at lower prices than other coins.
Traders and investors closely monitor these changes in relative values, as they indicate shifts in the market. You can see how coins' caps relate to each other on the crypto dominance chart. To track factors that influence the market, follow the latest news.
There are several factors that can drive a rise or decline in Solana dominance:
- Smart money flows: Institutional investors can bring substantial capital into the market, driving rapid asset growth. Conversely, large sell-offs may contribute to bearish sentiment
- Promising technology: Coins with strong real-world use cases tend to attract capital, while newer or more efficient alternatives can draw market share away from older projects
- Regulation: Looser regulatory conditions often support market growth, while stricter rules can reduce liquidity and limit participation
- Market sentiment: In rising markets, optimism and momentum can increase demand across assets, encouraging investors to buy and pushing prices higher
To see what other traders expect from the market, explore SOL dominance trading ideas and follow real-time crypto news.
- Smart money flows: Institutional investors can bring substantial capital into the market, driving rapid asset growth. Conversely, large sell-offs may contribute to bearish sentiment
- Promising technology: Coins with strong real-world use cases tend to attract capital, while newer or more efficient alternatives can draw market share away from older projects
- Regulation: Looser regulatory conditions often support market growth, while stricter rules can reduce liquidity and limit participation
- Market sentiment: In rising markets, optimism and momentum can increase demand across assets, encouraging investors to buy and pushing prices higher
To see what other traders expect from the market, explore SOL dominance trading ideas and follow real-time crypto news.