The Roadmap to $300 SOLThe Roadmap to $300 SOL: How Bitcoin and Relative Strength Make It Happen
If you only look at crypto charts in USDT, you miss half the story. To truly understand if a coin is getting ready for a massive move, you need to look at its Bitcoin pair, such as SOL/BTC.
Here is a simple breakdown of what we are looking at on the chart and why everything points toward a $300 Solana.
1. What is a CRYPTOCAP:BTC Pair and Why Does It Matter?
Instead of asking if Solana is going up in dollars, a
Solana/Bitcoin
No trades
No trades
In-depth trading ideas
SOL strength against BTC vs ETH'sThe SOLBTC pair is much stronger
than the ETHBTC pair. Even with the massive beating SOLUSD took from ATH, wasn't nearly enough compared to the ETH beating on the BTC pair.
Considering this, I'd argue that this strength suggest SOL might be able to break the downtrend ETH against BTC that never could.
Very bullish on Solana and $SOL.
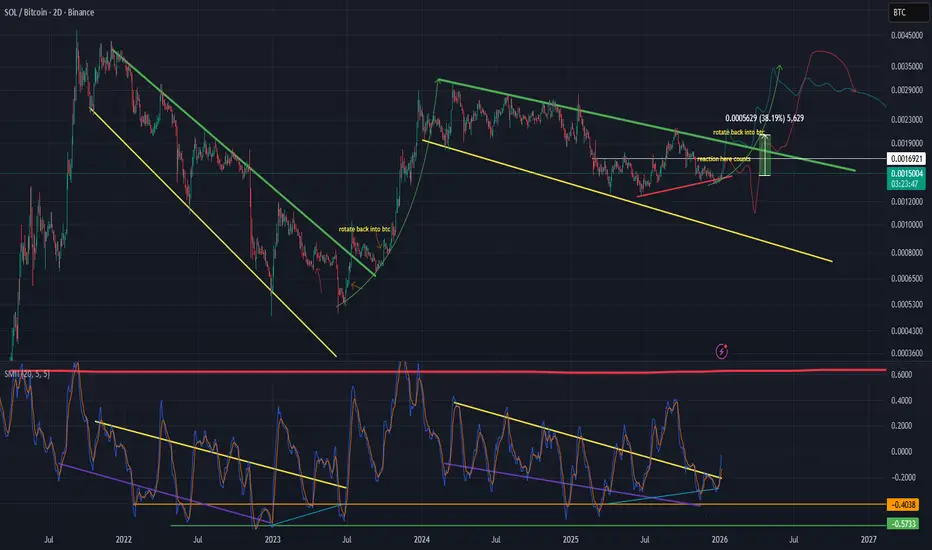
SOL/BTC – Symmetry Completion & Supply Zone Reversal ScenarioDaily Timeframe
In the SOL/BTC daily chart, price appears to be forming a large symmetrical structure. The first symmetry developed within the initial highlighted range, followed by a similar price structure forming in the second symmetry.
The key point in this setup is the overlap between the second symmetry and the supply zone. This confluence could make the current area an important reaction zone, especially if price fails to establish a sustained breakout above the upper boundary.
The cur
Measuring Wealth in Satoshis: The Strategic SOL/BTC RotationIf your ultimate goal in this market is to stack INDEX:BTCUSD Bitcoin , measuring your portfolio solely in US Dollars creates a fundamental blind spot.
TVC:DXY Dollars are inflatable paper ; Bitcoin is scarce.
True capital compounding comes from utilizing crypto-to-crypto pairs to increase your total Satoshi balance over full market cycles.
Look at the daily chart of SOL/BTC.
After a prolonged corrective period, CRYPTOCAP:SOLANA.C Solana completed a macro breakout from its long
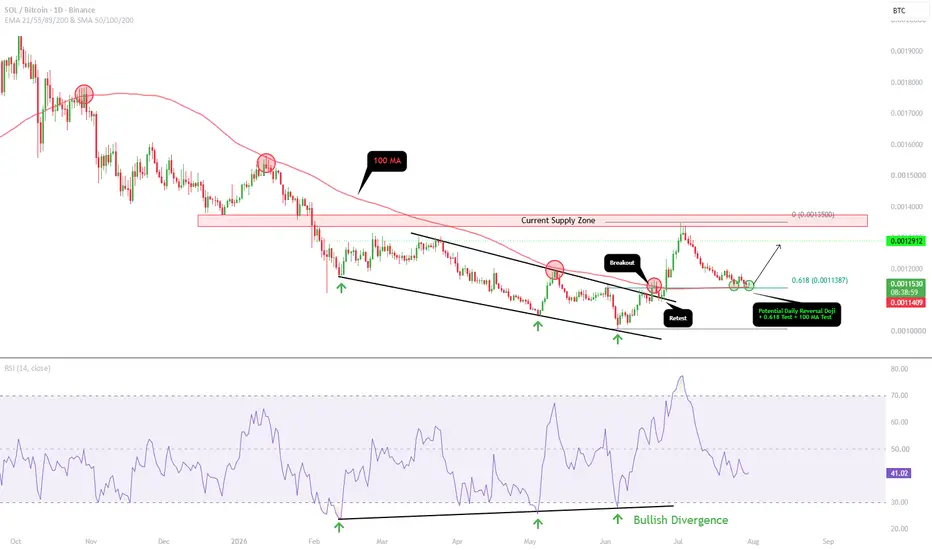
SOL/BTC - Significant Low FormingRight now SOL, in relation to BTC, is looking to form a significant low. If successful, that would mean SOL should begin gaining value against Bitcoin.
To understand this fully, we must first examine what has happened since the bull market top.
The Daily 100 MA
The first point of focus is the 100 moving average on the daily timeframe (red MA). This is where the SOL/BTC top formed at the end of October 2025 (red circle). It then marked the top again in January 2026, once more in May 2026, an
SOL vs BTC has triggered a Head and Shoulders.LA Vape Cabal
Donald Trump
Dave Portnoy
Libra
The band of thieves operating on Solana has stripped away all the opportunities for retail investors. Their relentless stealing has created a bitter experience for newcomers, while the veteran retail investors are barely hanging on.
The SOLBTC chart clearly shows the formation of a head and shoulders pattern, which has been triggered and is poised to significantly diminish satoshi value.
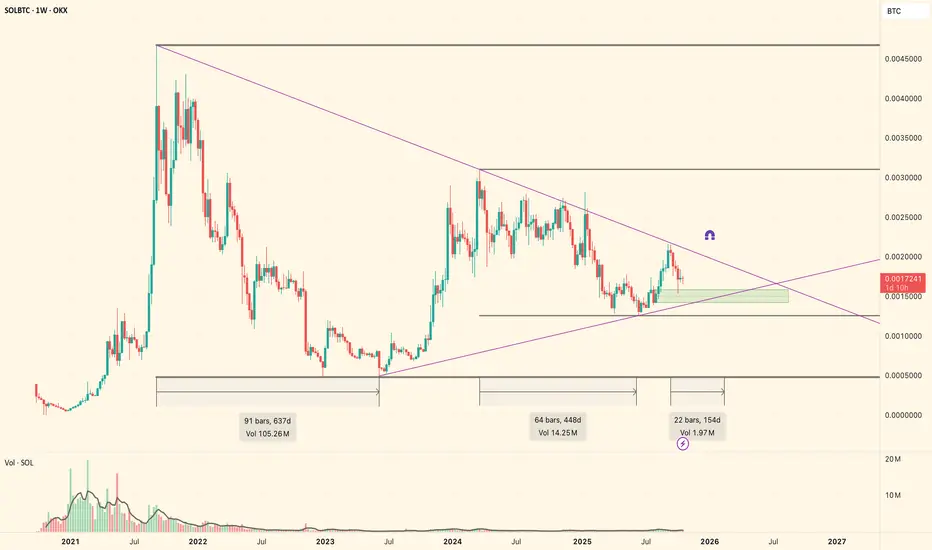
Solana (SOLBTC): Early Signs of Strength Within Wave 4 TriangleSolana continues to display improving relative strength against Bitcoin, with the SOLBTC pair showing a clear shift in momentum after a completed corrective phase. Price action is increasingly constructive, suggesting that buyers are regaining control within a larger higher-timeframe consolidation structure.
On the weekly timeframe, SOLBTC remains within a broad bullish (A)(B)(C)(D)(E) triangle formation in wave 4. This type of structure typically represents a long consolidation phase before a
SOLBTC: Risk Appetite Improving Above the CloudBINANCE:SOLBTC daily
This is an interesting chart for crypto risk appetite.
SOL has pushed above the Ichimoku cloud after a long period of relative weakness against BTC. The move is also supported by the lagging line clearing the cloud, which adds some confirmation that momentum has shifted in SOL’s favor.
That said, the short-term move is now somewhat extended. A pullback toward the cloud, especially around Span B / the upper cloud area, would be a normal place to look for a retest.
If pri
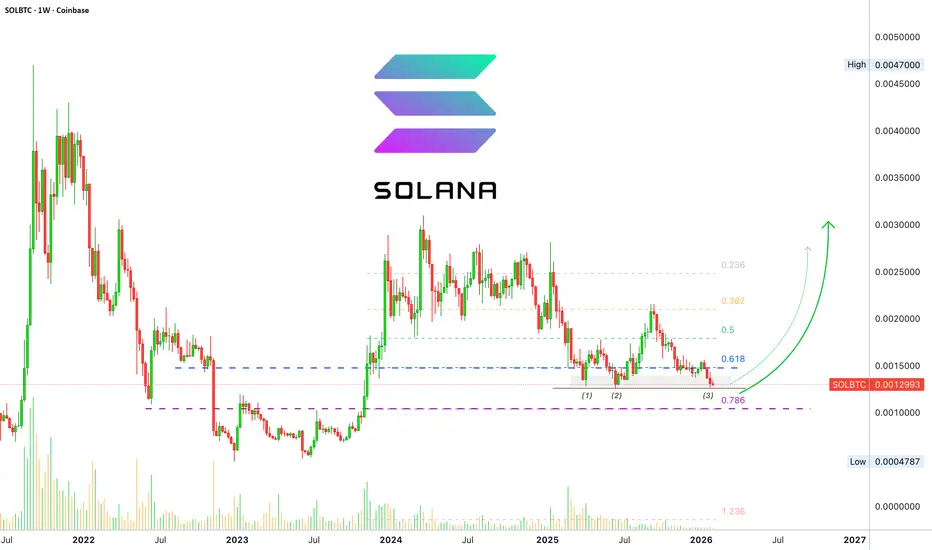
SOLBTC · Mixed but I am bullish · My personal trading experienceI know, I know. I know what you are going to say. That I am always drinking champagne.
Well, maybe or maybe not, but I am only always bullish when the action happens at support.
Here we are looking at Solana vs Bitcoin and I shall explain why this is a mixed bag and why I am bullish nonetheless.
The trading is now sandwiched between 0.618 and 0.786 Fib. retracement levels. Needless to say, since rejection at resistance produced the current chart, and there are several long-term lower highs, w
Buy accumilation I thought it was going to be an intra day trade for yesterday but itwas one of the lowest volume days in a long time.
We have been getting exhausted on the sells and higher lows. My buy signals just keep flashing.
Might be a possibly bullish move to end the weekly green. We need the volume to show up today/just before weekly close.
I will keep buying as long as my signal keeps flashing have price targets at 1:2
TP around 130 area.
I also want to make it clear i getthe buy signals on Sol/B
$SOL/$BTC (DAILY): GOLDEN POCKET bound and UPTRENDCRYPTOCAP:SOL vs CRYPTOCAP:BTC looks ripe on the WEEKLY, so let's zoom in on the DAILY for a better idea.
First of all, the 200 MA, the green upcurving KEY moving average, has held as additional support level in confluence with the GOLDEN POCKET.
We saw a good bounce and now it looks ready for some WAVE 3 explosive action, as soon as the imnediate resistance is overcome.
BULLISH MACD crossover, this chart should become super bullish once above the yellow 50 MA, my main short-term momentum
$SOL/$BTC (WEEKLY): BULLISHNESS brewing, MONEY WAVE next?CRYPTOCAP:SOL or CRYPTOCAP:BTC in the upcoming weeks and months, mid-term thesis. Last checks before I pull the trigger on SOLANA long (above $206, as per my previous posts).
So the WEEKLY chart first, these alt vs btc are my reliable, additional foundations in high-probability trading set-ups.
Important to note that SOLANA corrected for 15 months between MARCH 24 and JUNE this year, and since late JUNE we saw a big reversal (DOUBLE BOTTOM) followed by a local top last month. HIGHER HIGH af
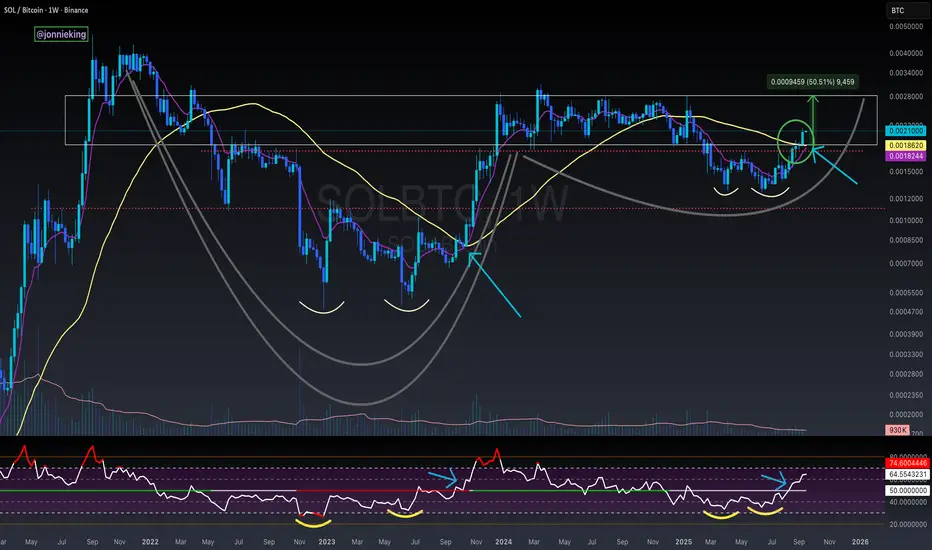
$SOL / $BTC 50WMA Reclaimed - Alt Season Confirmed!Ladies and Gentlemen,
CRYPTOCAP:SOL / CRYPTOCAP:BTC has officially closed the Week above the 50WMA and is back within the POI.
Double bottom confirmed this setup.
Along with the longest cup and handle I’ve ever seen lol.
Let the rotation for Alt Season begin!
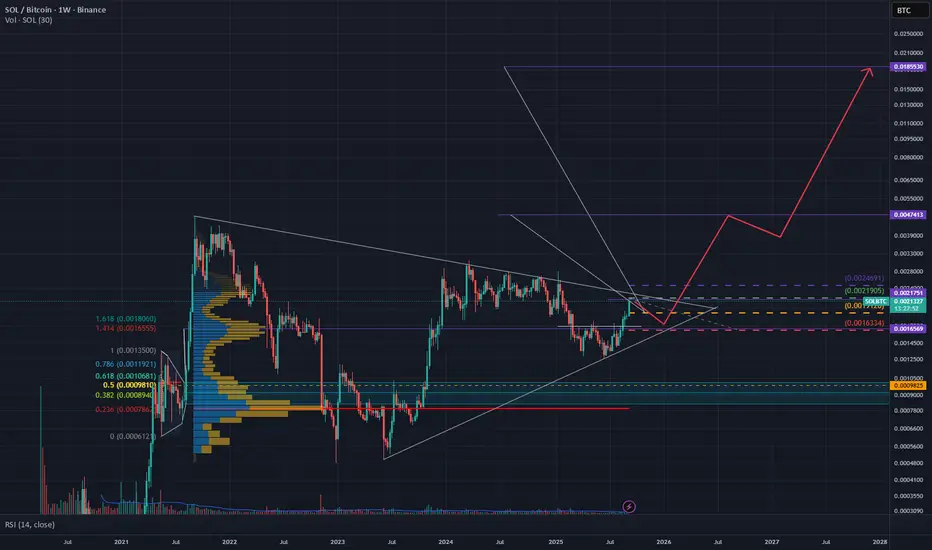
SOLBTCSOLBTC is on the brink of a HVF compliant RH3. We expect a small pullback to wind up before breaking out against BTC. Alts outperforming BTC is bull market conditions.
Too late now to catch the current leg, don't FOMO in. Keep in weekly review to find the right price to go big.
Fundamentals:
- Chose coin
- Doller weakness environment
- Rate cuts expected after weak economic data
Will Solana Recover? SOLBTC Reveals the AnswerThe truth is that we can find the answer by looking at SOLBTC (Solana vs Bitcoin). If we have a bearish SOLBTC then we know the market is about to tank and about to do so wildly. But, with a bullish SOLBTC we know Solana to be bullish and related altcoins as well. Let's dive into this chart and see what it has to say.
SOLBTC peaked March 2024. A peak is always followed by a correction and this time it took a while before support broke. SOLBTC went into distribution and crashed earlier to reach
$SOLBTC Broke down. Same with $SOLETH. Will it rebound? We peaked in CRYPTOCAP:BTC.D chart as we predicted here.
CRYPTOCAP:BTC weathering the storm: CRYPTOCAP:BTC.D close to 66%. CRYPTOCAP:BTC to 160K. for BITSTAMP:BTCUSD by RabishankarBiswal — TradingView
Since then, Altcoins have shown signs of strength and CRYPTOCAP:ETH.D is bouncing back with BITSTAMP:ETHUSD at 4000 $. Please check my CRYPTOCAP:ETH.D blog here.
CRYPTOCAP:BTC.D : Cycle tops are in. CRYPTOCAP:ETH.D : Bounce form the all-time lows for CRYPTOCAP:BTC.D by Rabishank
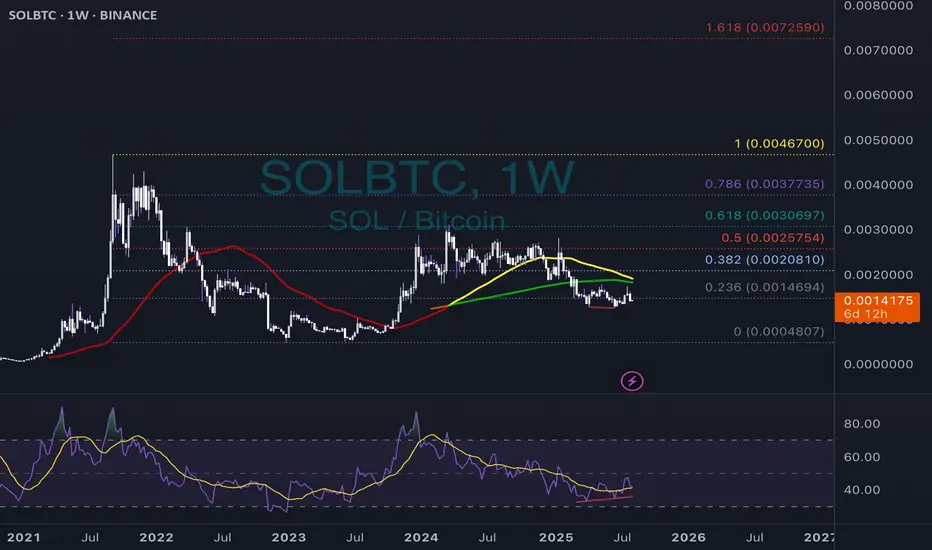
Sol/Btc✨ Solana vs Bitcoin — a quiet moment before the move?
📍 First week of August 2025
From the roaring highs of 2021,
Solana slowly faded under Bitcoin’s shadow…
Now resting around 0.0014 BTC,
breathing quietly, perhaps gathering strength:
🔸 RSI shows a bullish divergence — momentum building.
🔸 Moving averages (red & yellow) still overhead, but the gap is narrowing.
🔸 Key resistances:
▫️ 0.0020 → 38.2% Fib
▫️ 0.0025 → 50% Fib
▫️ 0.0030 → the golden 0.618 Fib.
🔮 Scenarios:
1️⃣ Break above 0.0020