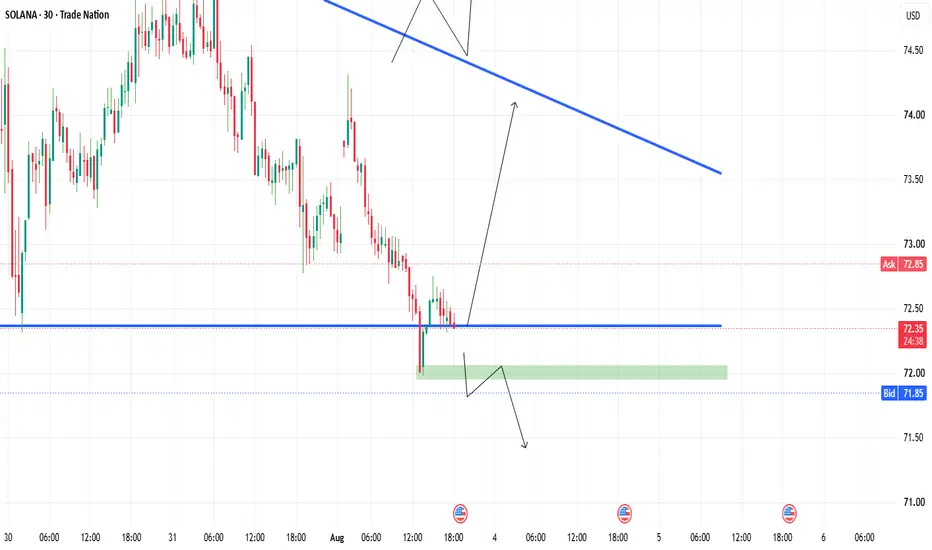
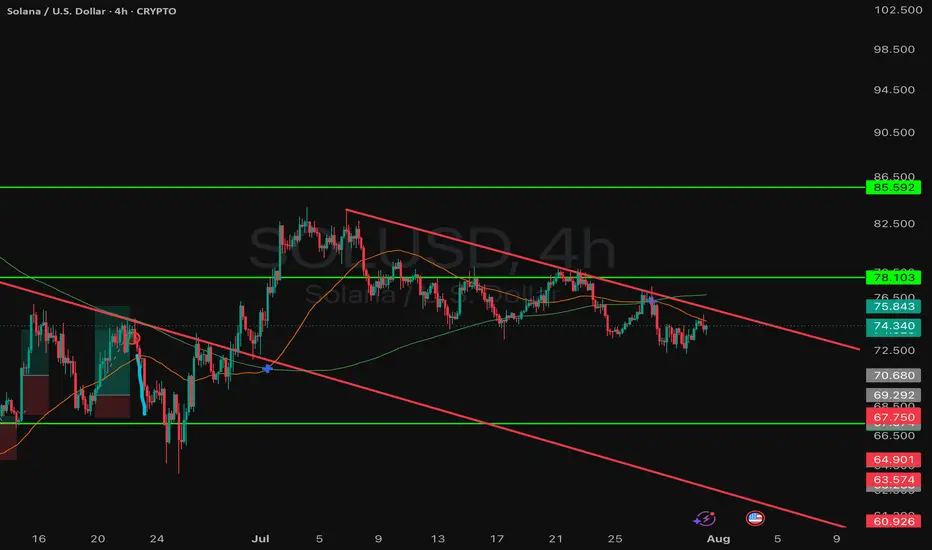
SOLUSD | SELL SETUP...SOLUSD | SELL SETUP 📉
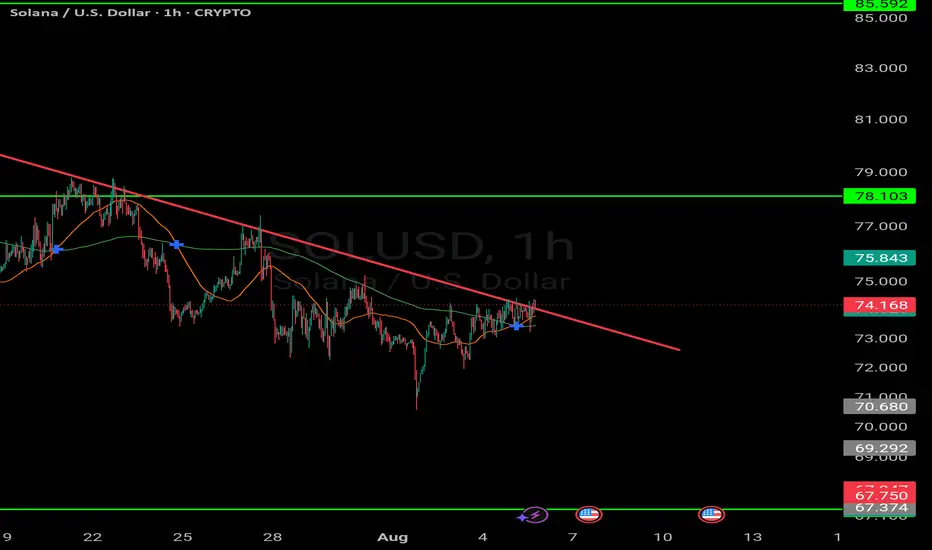
📍 Sell Zone: 72.80–73.00 (on pullback)
🎯 Profit Targets:
TP1: 71.80 ✅
TP2: 71.20 ✅
TP3: 70.70 ✅
🛑 Risk Control: A sustained 1H close above 73.20 invalidates the bearish setup.
📊 Market Perspective:
SOL remains below a descending trendline and has rejected higher prices, indicating sellers are still in control. The current support around 72.30 is being tested. A confirmed breakdown below this level could accelerate bearish momentum toward the lower demand zone around 70.70. Wait for price confirmation and manage risk carefully.
In-depth trading ideas
Solana Faces Growing Selling Pressure📊 SOL/USD is showing increasing bearish pressure after failing to break above a key resistance zone and remaining below the descending trendline. Price has produced a series of lower highs, while repeated rejections from the highlighted supply area suggest that sellers continue to dominate the market. The Ichimoku structure also supports the bearish outlook, with price struggling to regain bullish momentum. As long as the descending trendline and resistance zone remain intact, the path of least resistance continues to favor the downside. A confirmed rejection from the current levels could accelerate selling pressure and trigger the next bearish leg. 🔍
🎯 If sellers maintain control and price breaks below the nearby support, the first downside objective is 70.17. 🚨 Continued bearish momentum could extend the decline toward the second target at 68.10, where the next major support level is expected. ⚠️ A sustained move above the highlighted resistance zone would weaken the bearish outlook and delay the expected downside scenario.
If you found this analysis helpful, don’t forget to LIKE 👍 and COMMENT 💬!
SOLANA 1-month consolidation preparing for $45.500 drop.Solana (SOLUSD) has been consolidating below the 1D MA100 (green trend-line) and around the 0.618 level of its Fibonacci Channel Down for the exactly 1 month. Since the September 2025 High and the start of this pattern, we have seen this consolidation 3 times in total.
Every time a strong decline followed that hit at least the 0.236 Channel Fib and made the 1D RSI break below its 30.00 oversold limit. With the 1D MA200 (orange trend-line) holding as Resistance since November 03 2025, we expect it to reject SOL once more and initiate another strong Bearish Leg.
It is possible to complete another -53.88% total decline, which aligns with hitting the 0.236 Fib. We have a $45.500 Target but will close it if the 1D RSI hits 30.00 first.
---
** Please LIKE 👍, FOLLOW ✅, SHARE 🙌 and COMMENT ✍ if you enjoy this idea! Also share your ideas and charts in the comments section below! This is best way to keep it relevant, support us, keep the content here free and allow the idea to reach as many people as possible. **
---
💸💸💸💸💸💸
👇 👇 👇 👇 👇 👇
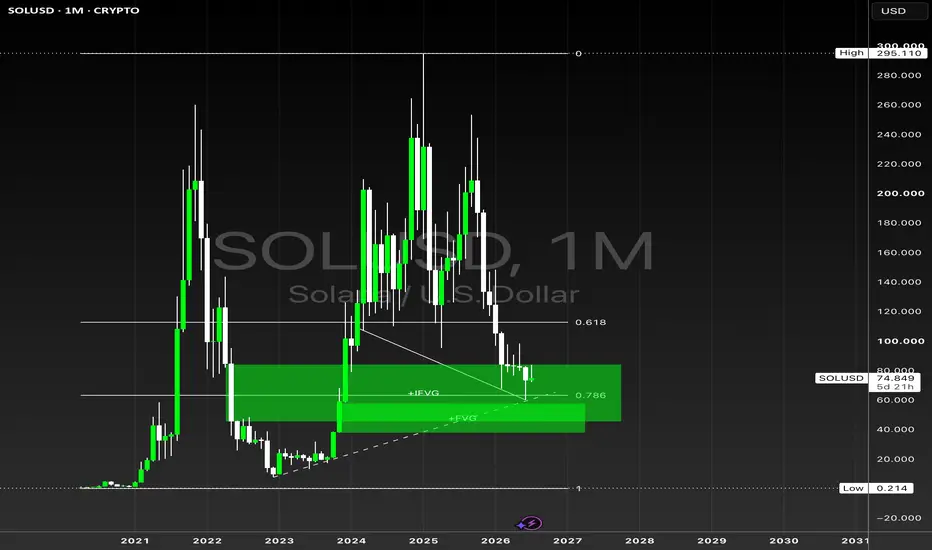
SOL | MonthlyCRYPTOCAP:SOL — Quan-Entangling Model
Quan-Analysis | Projecting the Primary Degree Uptrend 📈
Solana represents one of the most refined and structurally integrated Quan-Entangling Models I have architected across the crypto market.
Based on the entangled model illustrated on this monthly chart, my interpretation is that
SOL has been developing a Leading Diagonal in Cycle-degree Wave I since April 2020.
The Primary-degree Wave ⓸ correction should have concluded at $ 60.124 , with the next Primary-degree Wave ⓹ uptrend now projected to emerge.
Within the now well-stabilized Trend Ray , an approximately 160% 📈 advance into February 2027 is projected. The C onverging R esistance Ray χ points to the HPQ Target ➤ $196 🎯.
As the price continues to progress within the structural range surrounding the highlighted Trend Ray, the T ransition- R esistance Q uan-Structure ψ projects the ultimate ATH of the first Cycle at the HPQ Target ➤ $333 💫 | Early March 2028 .
🔖 The illustrated Trend Ray is structurally defined by the converging Trend E-lines ➤ Δ and χ .
#QuanAnalysis #StrategicAnalysis #FutureVision #MarketInfrastructure #QuantumEntanglement #CymaticTrendflow #TrendAnalysis
SOLUSD: THIS Formation Completes When THIS Level Holds!Hello There,
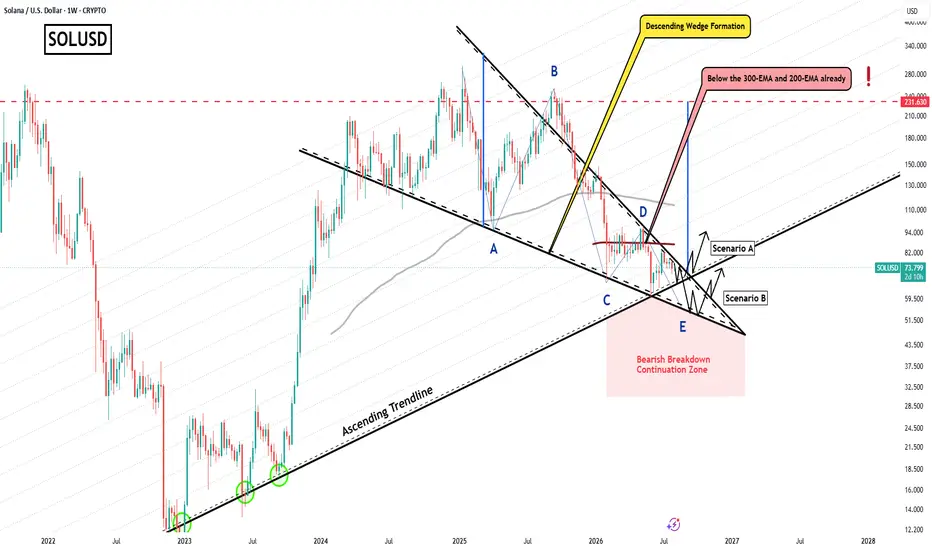
welcome to my new analysis of SOLUSD from a weekly timeframe perspective. In recent times, a lot of cryptocurrencies in the market approach crucial levels from which determining price moves are going to emerge in the upcoming times. With one of them being SOLUSD, I spotted the underlying dynamics that will determine the future outcomes.
When looking at my chart, we can see how SOLUSD recently approached this major ascending trendline. This ascending trendline has already supported several times in the past. Now, it is a very crucial zone to hold, and SOLUSD needs to bounce within it to complete the underlying formation, which is this gigantic descending triangle formation.
For this massive formation to complete, SOLUSD must hold the ascending trendline. Below this trendline, it has the bearish breakdown continuation zone. There are two main scenarios to consider. The first is that SOLUSD holds the historical ascending trendline and completes the formation from there.
The second scenario is that it first breaks below the historical ascending trendline and then finds support in the lower boundary of the descending triangle formation. Depending on how SOLUSD approaches the ascending trendline, it will determine the upcoming price action.
In this manner, thank you a lot for watching!
The support is highly appreciated.
VP
SOL PERPETUAL TRADESELL SETUPShort from $76.50SOL PERPETUAL TRADE
SELL SETUP
Short from $76.50
Currently $76.50
Targeting $73.30 or Down
(Trading plan IF SOL go up to $80
will add more shorts)
Follow the notes for updates
In the event of an early exit,
this analysis will be updated.
Its not a Financial advice
Solana (SOL) Bullish Forecast: Path Opens Toward $77.70Quick overview
Solana repeatedly reclaimed the $72.781 short-term CPM bottom after several false breaks beneath it.
Broad-market strength, supported by bullish confirmation from XRP and Chainlink, activated the upside scenario before SOL itself cleared $75.107.
The immediate technical pathway runs through $75.107, followed by the official short-term target at $77.710.
Our working bullish position was activated around $73.99, with protective invalidation positioned at $69.50.
This is strictly a short-term bullish forecast. Solana’s Weekly structure remains bearish, meaning the rally should not yet be mistaken for a medium- or long-term trend reversal.
Solana is beginning to construct a credible short-term recovery after repeatedly defending and reclaiming the pivotal $72.781 region.
The latest technical structure suggests that sellers have failed to establish sustainable control beneath this short-term CPM bottom. Several downward penetrations were quickly rejected, allowing SOL to recover the level and rebuild a temporary bullish base above it.
That repeated reclamation is significant. A single recovery can be dismissed as noise, but multiple failed breakdowns tend to reveal that bearish pressure is losing efficiency around the level in question. In Solana’s case, the market has repeatedly dipped beneath $72.781 without converting those moves into a sustained continuation lower.
Our outlook is therefore turning bullish—but only across the immediate short-term horizon.
The forecast does not call for a complete reversal of Solana’s larger bearish cycle. Instead, it anticipates a contained corrective advance toward $77.710, where the present bullish opportunity is expected to reach its technical destination.
Current Technical Setup: False Breaks Strengthen the Bottom
The most important feature of the current Solana structure is the market’s behaviour around $72.781.
This level represents the blue short-term CPM bottom and the foundation supporting the present recovery scenario. Price action repeatedly penetrated beneath it, but each attempt failed to produce meaningful bearish continuation. SOL instead reclaimed the level, stabilized above it and began rotating higher.
That behaviour suggests the market may have completed a local downside cycle.
The bullish scenario was not dependent on waiting for Solana to cross the first visible obstacle at $75.107. By the time SOL began advancing from the lower range, bullish cross-asset confirmation was already emerging elsewhere in the crypto market.
XRP crossed its $1.0823 trigger, Chainlink moved through the purple-system level at $8.20, and the broader market began advancing in unison. Taken together, those developments provided enough evidence that the recovery was not isolated to SOL.
This wider participation activated the bullish setup around $73.99, rather than forcing us to wait for a later and potentially less efficient entry above $75.107.
Projected Move: $75.107 Opens the Road to $77.710
The immediate technical obstacle sits at $75.107.
A sustained move through this level would strengthen the short-term bullish structure and confirm that Solana is progressing into the upper section of its current CPM range. From there, the market would be expected to continue toward $77.710.
That upper level represents our official profit target and the hard destination for the present forecast.
The pathway can therefore be summarized as follows:
Short-term foundation: $72.781
Bullish position area: $73.99
Immediate obstacle: $75.107
Primary short-term target: $77.710
Protective invalidation: $69.50
The distinction between an obstacle and a target is important. While $75.107 may temporarily slow the advance or trigger intraday hesitation, it is not the final objective of this setup. The forecast remains directed toward $77.710 unless the underlying structure fails first.
A clean advance through $75.107 would substantially reduce the remaining technical distance and leave the upper CPM destination exposed.
Why This Forecast Is Bullish Only in the Short Term
Despite the constructive lower-timeframe setup, Solana’s Weekly chart remains bearish.
That higher-timeframe condition prevents us from treating the present recovery as the beginning of a full-fledged bull cycle. The market may be rising, but it is rising against an underlying structure that has not yet completed a convincing bullish reversal.
This creates an important analytical boundary.
The expected move toward $77.710 should be treated as a corrective bullish wave inside a broader bearish environment. Once the target is reached, SOL could face renewed resistance, profit-taking or a deeper bearish rejection.
In other words, the market can be bullish over the next leg without being bullish overall.
We are not extrapolating the present setup beyond its technical mandate. The bullish forecast effectively ends at $77.710. Any call for a larger upside cycle would require fresh evidence, a meaningful change in the Weekly structure and a separate technical assessment after the current target is tested.
The protective stop at $69.50 reflects that caution. A decline through that level would invalidate the local recovery structure and indicate that the failed breakdowns around $72.781 were not sufficient to establish a sustainable bottom.
Solana Technology and Ecosystem Update
Solana’s underlying network continues to develop even as its price structure remains mixed across different timeframes.
On July 30, Solana mainnet activated SIMD-0286, raising block capacity to 100 million compute units. The same development cycle included new Agave, Firedancer, Solana SDK and developer-tooling releases, reflecting continued work on network capacity and validator-client diversity.
Another upcoming network upgrade is expected to increase Solana’s maximum transaction size from 1,232 bytes to 4,096 bytes. The change is designed to accommodate more complex workloads—including larger multisignature operations, transaction batches and certain zero-knowledge proofs—with mainnet activation targeted for the third quarter of 2026.
Institutional and tokenized-asset activity has also continued to expand. According to the Solana Foundation, the network hosted approximately $3.7 billion in non-stablecoin real-world assets across more than 313,000 holders by late July 2026.
These developments strengthen Solana’s longer-term technological and ecosystem case. They do not, however, override the current Weekly bearish structure or transform this narrowly defined short-term trade into a long-term bullish forecast.
Conclusion: Bullish Toward $77.70, Cautious Beyond It
Solana’s repeated recovery above $72.781 suggests that the market has constructed a viable short-term bottom.
The inability of sellers to convert multiple downside penetrations into a sustained breakdown, combined with bullish confirmation from XRP, Chainlink and the broader crypto market, supports an immediate upside rotation.
Our official technical destination is $77.710, with $75.107 acting as the remaining obstacle along the way.
Key levels to watch
Short-term CPM bottom: $72.781
Bullish entry area: $73.99
Immediate upside obstacle: $75.107
Official profit target: $77.710
Protective stop and invalidation: $69.50
The bottom line is deliberately precise: Solana is bullish over the short term, but not yet bullish on the Weekly scale.
A move toward $77.710 is increasingly likely, but reaching that target may complete the correction rather than begin a much larger advance.
SOLUSD: THIS Formation is Going Set Up a Major Breakout!Hello There,
welcome to my new analysis about SOLUSD on the weekly timeframe perspective. In recent times I have detected important underlying factors that will determine the upcoming price action of SOLUSD. Right now, there are a lot of signs that are speaking towards a huge transformative price action. SOLUSD is still in a corrective mode, however, this could change when all the whales have finally sold.
As when looking at my chart now, we can watch there how SOLUSD trades within this gigantic ascending triangle formation. The lower boundary of this formation serves as a strong support in which SOLUSD already bounced several times. This ascending triangle formation lower boundary support line has already been the origin of the initial inverse head-and-shoulders formation . This formation was the base of the massive bullish expansion shooting SOLUSD above the 200 USD level.
Currently, SOLUSD is already continuing with a highly similar descending wedge formation, which is a pivotal bullish formation. In the first descending wedge formation, SOLUSD already formed the inverse head-and-shoulders formation, which additionally confirmed the bullish breakout above the upper boundary and further expansion towards the upside. Such an inverse head-and-shoulders formation could form now again, as the left shoulder is already almost completed.
Once SOLUSD continues with the head of this second inverse head-shoulder formation, it will confirm with a decisive bounce within the ascending triangle's lower boundary. Currently the double bottom in the MACD and bullish MACD crossover is already confirming that such a scenario is likely. Once SOLUSD confirms the double breakout as shown in my chart, it will pave the way for further strong bullish expansions moving above the 200 USD level again.
The situation will be highly determining and decisive. Therefore, I am going to monitor it for any significant changes and possible whale interactions.
Thank you a lot for watching!
The support is highly appreciated.
VP
SOLUSD Price Forecast: Bearish Breakdown Potential Within Symmet# SOLUSD Price Forecast: Bearish Breakdown Potential Within Symmetrical Triangle
SOLUSD is consolidating inside a narrowing symmetrical triangle pattern below the Ichimoku Cloud on the 12H timeframe, indicating tightening volatility before a major expansion. As long as price remains rejected by the descending upper resistance trendline near 74.74, the bias leans bearish toward lower support levels.
📉 Bearish Scenario
A break below the lower ascending trendline support may push SOLUSD toward:
🎯 Target 1: 70.48
🎯 Target 2: 64.32
📈 Bullish Invalidation
A strong 12H candle close above 74.74 and the upper trendline would invalidate the bearish setup and could trigger a move higher toward 80.00+.
Key Levels
Resistance: 74.74
Current Price: 74.27
Support 1: 70.48
Support 2: 64.32
Bearish Invalidation: 12H Close Above 74.74
Solana tightens inside a triangle: breakout or breakdown?Solana tightens inside a triangle: breakout or breakdown?
SOL trades near $73.17, holding above the SMA 200 at $73.05 but below the EMA 9 at $73.40 and SMA 50 at $73.34. MACD is bearish as price approaches the triangle’s apex.
▫️ Solana’s on-chain activity increased year over year
▫️ Network costs declined
▫️ Liquid staking usage expanded
▫️ Q2 annualized staking yield was approximately 6.25%
The fundamentals are improving, but the news has not produced immediate demand for SOL.
🧠 Smart Momentum → 🔴 weakening
📈 Trend → ⚪ compression
🎯 S/R → $72.70–73.00 support / $74.00–74.20 resistance
📰 News Impact → 🟢 positive long term, neutral for price now
📊 Volume → declining; breakout needs confirmation
⚙️ Setup: short on confirmed 30-minute breakdown
🔻 Entry: $72.70–72.80
🛑 Stop Loss: $73.40
🎯 Take Profit 1: $72.00
🎯 Take Profit 2: $71.70
A recovery above $74.20 invalidates the bearish setup and returns control to buyers.
Disclaimer: This is not invest advice.
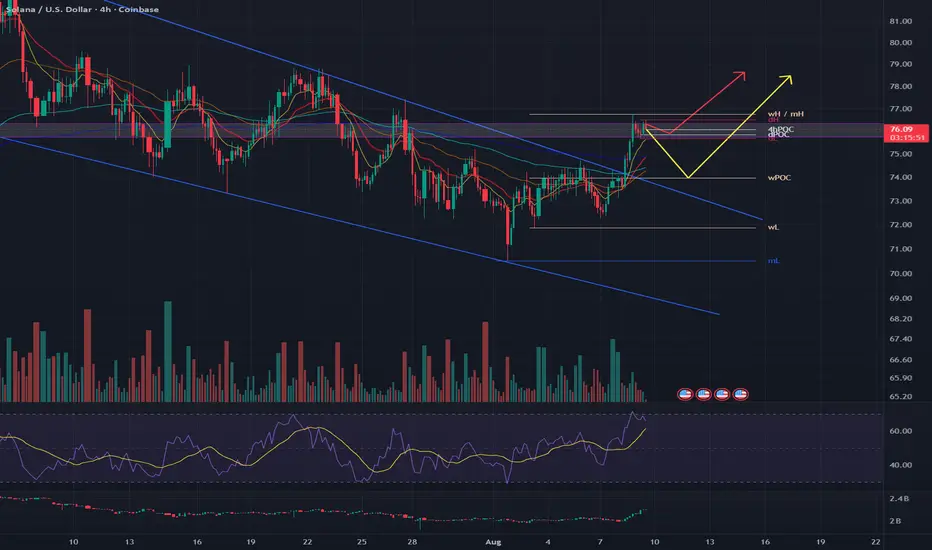
SOLANA 8/8/2026 19:55 UTC +7SOLANA — 2 POSSIBLE PATHS IN MY CURRENT WAVE COUNT
SOL is currently around $75.4, and the purple structure suggests that Wave A may not necessarily be complete yet.
There are currently two possibilities I’m watching:
🟢 SCENARIO 1 — Wave A Extension
Wave A could extend higher before the correction begins.
Instead of ending around $75.6, SOL could continue toward approximately $77.1.
If this happens, I would expect Wave B to retrace afterward, before the next upside move develops.
Path:
$75.4 → $77.1 → Wave B retracement → higher
🔴 SCENARIO 2 — Wave A Already Complete
The second possibility is that Wave A has already completed around $75.6.
In this case, SOL could begin the retracement from the current area, without reaching $77.1 first.
Path:
$75.4–75.6 → Wave B retracement → higher
🔑 WHAT I AM WATCHING
The key question now is whether SOL can continue pushing higher toward $77.1, or whether the retracement begins first.
After this corrective phase, my next major upside area remains:
$78.7 → $80.65
And if SOL reaches the $78.7–80.65 resistance zone, I will be watching closely for a larger corrective move.
So my current roadmap is:
Wave A → Wave B retracement → upside → larger correction
The market will tell us whether Wave A extends to $77.1 or has already completed near $75.6.
Which scenario are you watching — extension first or retracement first?
━━━━━━━━━━━━━━
SpotSafeCapital
Structure. Discipline. Patience.
SOL/USD: Bullish BoS Above 74.83 Extends Above the BandSOL's pushed to 77.29 and it's now trading above the upper band at 76.53, with EMA21 at 75.35 and EMA55 at 74.54 both sloping up on the 4H. The trend bias is up, and the fresh bullish BoS 8 bars back through the 74.83 swing high confirmed the shift — that level flipped from resistance to the pivot the whole move now leans on.
Why it matters: price is stretched. Sitting above band_upper means we're roughly a full ATR above EMA21, and that kind of extension on the 4H usually mean-reverts before it extends. The structural read stays bullish while 74.83 holds on a closing basis, but chasing here is chasing the extension, not the setup. The cleaner re-entry is a drift back into the band.
What I'm watching: a pullback into the 75.30–75.60 pocket (EMA21 and band upper) that holds with a rejection wick. That's where dip-buyers who missed the BoS get their second look.
Invalidation: a 4H close back below 74.53 (EMA55) tells us the reclaim's failed and the swing low at 72.34 comes into play — below that, the idea's done.
Targets: 79.20 — clean air toward the recent range shelf. 80.80 — psychological round. 82.79 — window high, where sellers last stepped in.
Setup: Pullback into the 75.30–75.60 EMA21/band zone that holds keeps the bullish BoS thesis live toward 82.79.
Invalidation: 4H close below 74.53 (EMA55) invalidates — swing low at 72.34 opens up.
Targets: 79.20 — first clean-air resistance above current range · 80.80 — round-number magnet · 82.79 — window high and last major supply pocket
SOLUSD Breakdown Below 71 Could Target 62Solana remains under pressure near the key support at $71.88, while the chart is forming a symmetrical triangle.
A confirmed breakdown below $71.88 could strengthen bearish momentum and open the way toward $65.62 and $62.50. The Bollinger Bands, MACD and Stochastic Oscillator currently support the downside scenario.
The bullish scenario would become relevant only after a breakout and consolidation above $78.12. In this case, SOL could recover toward $87.50 and $93.75.
Support: $71.88, $65.62, $62.50
Resistance: $78.12, $87.50, $93.75
One Wallet Launched 716 MemecoinsMemecoin launches drive a huge share of Solana's daily transactions and fee revenue. So it's worth understanding who is behind those launches, and how their previous ones ended.
Every token you buy was created by someone. On Solana, that someone is often a wallet that has done it hundreds of times before, and left a public record of how each one ended.
Here's one interesting wallet:
• 716 tokens launched
• 492 dead — no activity, value gone to zero
• 13 still alive and actively trading today
• 211 graduated — finished the bonding curve and made it to a real liquidity pool
• Best launch peaked around $450 MILLION market cap
Take a second with those numbers. One wallet. Five hundred corpses. Two hundred graduations. Nearly half a billion dollars at the peak.
And here's the part that matters: all of it was public BEFORE every single one of those launches. It's on-chain. It can't be faked and it can't be deleted. Anyone could have read it in two minutes.
Most buyers never do.
THE CHART SHOWS THE PAST. THE CREATOR PREDICTS THE FUTURE.
Ten minutes after launch, every token chart looks the same: a green candle and a dream. The rug and the 100x are identical twins at minute one. The chart simply cannot help you yet.
The creator's history can.
Buying a fresh launch is backing a founder, not trading an asset. And this wallet? Nearly 30% of its launches graduate, in a market where roughly 1% of all tokens ever make it. Those are two completely different games, and you only know which one you're playing by checking the wallet behind the launch.
• Creator with graduated tokens? They've carried launches to the finish line before.
• Creator with 40 dead tokens and zero graduations? They're showing you the future in advance.
• Fresh wallet, zero history? The biggest question mark in the market.
No guarantees, just odds. But trading IS odds.
HOW TO CHECK A CREATOR (2 MINUTES, FREE)
Steps 1-3 are on the launchpad itself, steps 4-5 in any Solana explorer.
1. FIND THE DEPLOYER
The token page shows the wallet that created it. Open that wallet's profile and every token it ever launched is listed there.
2. READ THE HIT RATE, NOT THE VOLUME
Graduations against total launches. 5 launches with 2 graduations beats 300 launches with 1. Big volume with a near-zero hit rate means the wallet earns from launching, not from the token succeeding.
3. CHECK IF THE WINNERS SURVIVED
Open the two or three biggest past tokens. Still trading months later, or flatlined right after the peak? Wins that keep running mean a builder. Wins that die in days mean an exit.
4. CHECK THE WALLET'S AGE AND FUNDING
Look at its first transaction. Years of history beats a wallet created last week. Then check where the first funds came from: a known exchange is normal, a fresh anonymous wallet means someone wanted distance from their own past.
5. CHECK WHAT THE CREATOR KEPT
Look at the holder list. If the creator's supply sits in a few connected wallets, the float you're buying is smaller than it looks, and the exit is already loaded.
🔴 RED FLAGS
• Many launches, zero graduations
• Wallet created days before the launch
• Every past token: pump, dump, flatline
• Supply parked in a few connected wallets
🟢 GREEN FLAGS
• Graduations in the track record
• Old wallet, long consistent history
• Creator holds a fair share, not a control block
So next time FOMO pulls you into a fresh launch, remember: behind every ticker there's a wallet, and every wallet has a story. Reading it takes two minutes, and it's the closest thing this market has to a founder's resume.
If this saves even one person from a rug, it did its job.
Educational content, not investment advice. Always DYOR.