Solana (SOL) re-enters the opportunity buy-zone · 10X LEVSolana (SOLUSDT) is looking great right now with the same chart setup that was first activated in early February. This chart setup has now been active for 280 days.
This is a very good-n-powerful chart that says so much positive and so much good, that I am tempted to call for "selling the house," again; but it would be hard to sell your house more than once.
SOL is now at its seventh consecutive red week... Wow! That is all I have to say. Seven weeks closing red and the chart structure continu
Solana / Tether
No trades
No trades
In-depth trading ideas
**SOLUSDT – SELL SETUP.....**SOLUSDT – SELL SETUP** 🔴
Bearish Bias
Resistance Rejection
**Sell Engagement Zone:** 71.70 – 72.20
**Price Objectives:**
- Target A: 69.50
- Target B: 68.80
- Target C: 67.50
**Invalidation Level:** 72.50
**Market Analysis:**
SOLUSDT is consolidating below a major resistance zone around 71.80–72.20. The descending trendline continues to limit bullish momentum, while repeated rejection near resistance suggests sellers remain active.
A bearish reaction from the resistance area could
SOLUSDT – Bullish Breakout Ahead? ...........SOLUSDT is showing an interesting recovery structure after a significant bearish move from the 86.00 region toward the 67.60 support area.
Following the sharp decline, buyers started gaining control, creating a series of higher lows along a clearly developing ascending trendline.
**Technical Market Structure:**
The chart highlights an important transition from bearish momentum into a consolidation and recovery phase.
Price has tested the 75.50–76.29 resistance zone multiple times. Although s
Symmetrical Triangle Breakdown – Is $66.50 the Next Support?🔹 SOLUSDT is showing signs of bearish pressure after consolidating within a symmetrical triangle structure. Price recently struggled to break above the descending resistance trendline around the 75.00–76.00 zone, where sellers repeatedly defended the upside. Meanwhile, the rising support trendline has come under pressure, suggesting that buyers are gradually losing control of the short-term market structure. The latest price action near 72.84 indicates weakness following multiple rejections from
SOLUSDT | 4H Analysis | Potential Relief Rally & POI RetestsAfter analysing the 4H structure and drawing multiple descending trendlines, I believe SOL could be approaching a potential relief rally.
One thing that stands out to me is the increasing steepness of the current downward move. As price accelerates away from previous structure, the possibility of a corrective move increases.
My current scenario is:
A potential relief rally from the current price area.
A break of the steeper descending trendlines.
A move towards my marked POI levels around $
SOLUSDT: Recovery Looks Fragile — $63 Be Next?Solana has been losing ground for weeks, and the latest price action gives me little reason to expect a sustained recovery. With SOL trading around $71.78, I believe the market remains firmly in the hands of sellers, despite signs of short-term stabilization.
The 2H chart tells the story clearly. SOL continues moving inside a well-defined descending channel, with successive lower highs and both EMAs trending downward. The recent rebound from the $67–$68 area has struggled to gain momentum, sugg
15% Bullish Rally Above $106 or 14% Bearish Breakdown Below $89?Solana (SOL) is approaching a critical technical decision zone, where the next confirmed breakout or breakdown could create a significant directional trading opportunity. With clearly defined support and resistance levels, the current market structure presents two potential scenarios: a powerful bullish expansion or an aggressive bearish continuation.
From a bullish perspective, $106 represents the key resistance level and primary breakout confirmation threshold. A decisive move above this regi
SOLUSDT – SELL SETUP....**SOLUSDT – SELL SETUP** 🔴
Bearish Reversal Setup
**Premium Sell Zone:** 73.70 – 74.10
**Profit Targets:**
- Target I: 72.00
- Target II: 70.20
- Target III: 67.80
**Capital Protection (SL):** 74.55
**Market Analysis:**
SOLUSDT is showing signs of bearish pressure after facing strong rejection from the 74.00–74.50 resistance region. The recent pullback indicates weakening bullish momentum, while the rising trendline is under pressure.
A confirmed breakdown below 72.00 could strengthen th
SOLUSDT — Bearish Continuation | Technical & Fundamental....SOLUSDT — Bearish Continuation | Technical & Fundamental Analysis
1. Market Overview
Solana (SOLUSDT) is currently trading around 87.00. The overall market structure remains bearish, with price consistently forming lower highs and lower lows beneath a descending trendline.
The recent price action suggests a possible temporary recovery toward resistance before another potential downside move.
2. Technical Analysis
Current Price: 87.00
Major Resistance: 88.80 – 90.00
Trendline Resistance: D
SOL - Oversold at a Strong Demand Zone?SOL has been overall bearish, trading within the falling channel marked in red.
However, following the recent bearish movement, price is approaching the lower boundary of the channel, which is considered a potential oversold area.
📊 Technical Outlook
Interestingly, the lower red trendline intersects with a strong demand zone marked in green, around $72–$78.
This creates an interesting confluence of two technical factors:
Lower Channel Boundary (Red): Acting as dynamic support and a potent
SOLUSDT Daily: $97.34 Now Rejects Price From AboveThe $97.34 area on the SOLUSDT daily chart spent weeks acting as a floor. Swing lows stalled there 3 separate times, with the most recent tests landing on Sep 2, Sep 11, and Sep 15, each one holding and turning price back up.
That changed on Oct 29, when a 1D candle closed below the level at $95.62, breaking the floor that had held for weeks. Price then came back up to retest the same area from underneath, tagging a swing high of $98.16 on Nov 4. So far that retest has held, with the level keep
SOLUSDT: Another Bearish Leg Unfolding — Is $60 Next?# SOLUSDT — History Repeating? Another Major Breakdown Toward $60?
**Solana is once again showing signs of weakness, and the daily chart is telling an interesting story.**
Looking at the broader market structure, SOL has been consistently forming lower highs and lower lows since its major peak near $250.
The chart highlights a repeating pattern:
- **First major decline:** SOL dropped sharply from the $250 region toward $65–$70.
- **Recovery phase:** Buyers pushed the price back toward $120–$
Solana: SOLUSDT 5X LONG (PP: 915%) · Flash-Jump Alert! Trading Trading volume has been dropping on SOLUSDT for almost two years. Solana hasn't performed a higher high in almost two years. The lack of bullish action coupled with decreasing bearish volume shows a market that lacks a trend.
SOLUSDT closed six consecutive weeks red yet, no new lows, no challenge of support. Solana is trading back within the opportunity buy-zone. Another opportunity presents itself.
Good morning my fellow Cryptocurrency trader, this is one of those... Very low risk vs—fast—and
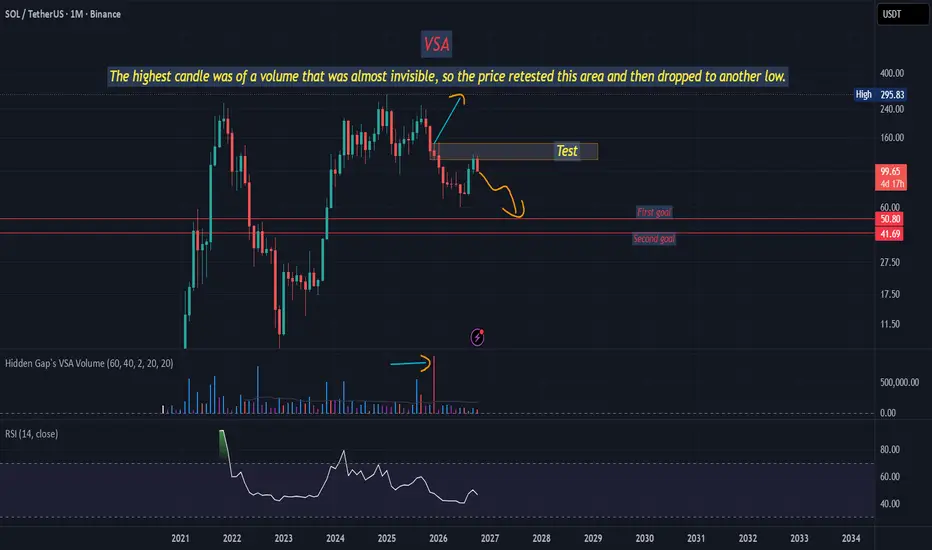
Where is the final bottom?From the volume analysis school, we find that the shaded candle body, which is barely visible to the naked eye, contains the highest historical volume. Therefore, when the price fell, it returned to retest this specific candle, and upon retesting it, it resumed its downward trend. We expect a further drop to a new low. There is another analysis for this currency based on Elliott Wave theory, which is consistent with the volume analysis school. Regards.
SOLUSDT: The future of SOLANA, Golden LevelsIf support level 64 is lost, the validity of previous analysis diminishes, and the probability of a further decline toward lower levels (subsequent supports) increases. In technical analysis, the breakdown of a key support level typically invalidates the previous bullish scenario and indicates a trend reversal or accelerated selling pressure.
The color levels are very accurate levels of support and resistance in different time frames, and we have to wait for their reaction in these areas.
So, P
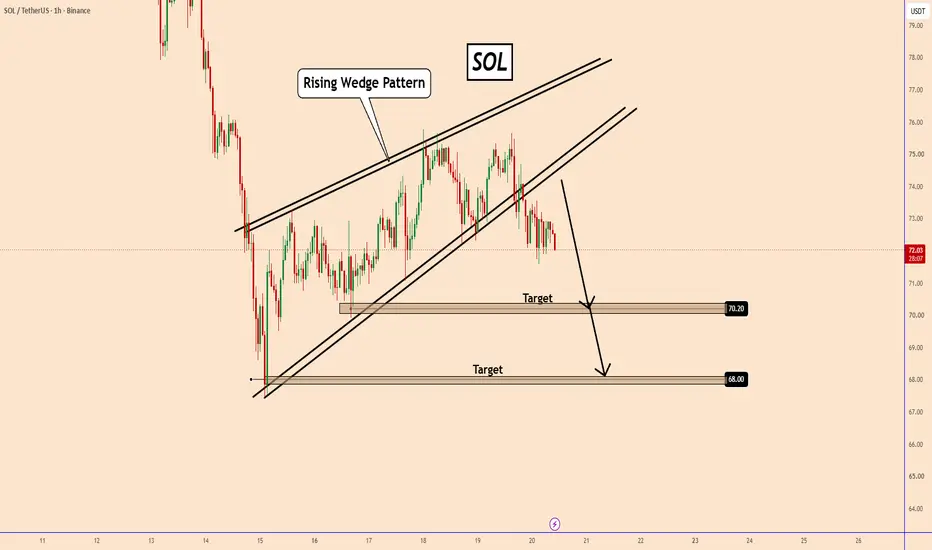
SOL: Rising Wedge Breakdown Signals Further DownsideSOL: Rising Wedge Breakdown Signals Further Downside
Solana (SOL) appears to be losing bullish momentum after forming a rising wedge pattern on the 1-hour chart.
Following its recovery from the $67.50 area, price moved within an upward-sloping structure, but the latest price action suggests that buyers are struggling to maintain control.
The recent rejection from the $75–$76 region, followed by a breakdown below the lower boundary of the rising wedge, strengthens the bearish outlook.
The
Solana · Bitcoin, Cryptocurrencies & The Future of MoneyI am talking about variety, solid projects and longevity. I am also talking about spot-trading and leverage. Short-term and long-term.
Needless to say, when it comes to the Cryptocurrency market—the Altcoins, Solana is a very strong project.
"SOLUSDT (Solana) is a great buy below $100." Buying and accumulating SOL tokens below $80 is one hundred times better.
We are looking now at the extreme opportunity buy-zone on one of the top Cryptos and this is not going to be repeated again.
Just once
SOL 12H: Demand at 68.5 held but the old range is now resistanceSOL is down about 40% from the late-September high near 123, which was rejected right at the 5D supply zone around 119–122. The sell-off broke through the 1D supply at 98.6–103, the 96.3 fib, and the flipped zone at 87–88.7. It then cut through 80.8–85.4 almost without stopping.
Price wicked into the 64.4–68.6 demand zone and bounced. It’s now sitting just under 73–76.8. That area was the July–August range, which used to be support and has now flipped to resistance. It’s the first real test for
#SOLUSDT Oversold at Major Support – Potential Bullish Rebound#SOL
SOL has recently declined toward the price levels seen in January 2026, an area from which the price previously initiated a strong bullish rally toward higher levels. This gives the current zone significant technical importance and makes it an area worth monitoring.
Solana is one of the major cryptocurrencies that continues to attract considerable investor interest, alongside assets such as XRP, thanks to its prominent position and strong presence in the cryptocurrency market.
The recen
#SOLUSDT #4h (Binance) Broadening wedge near breakout [LONG]SOL (Solana) looks likely to dip a last time before showing some short-term recovery towards 100EMA resistance.
⚡️⚡️ #SOL/USDT ⚡️⚡️
Exchanges: Binance Futures, Bitget Futures
Signal Type: Regular (LONG)
Leverage: Isolated (7.0X)
Amount: 5.4%
Entry Targets:
1) 71.20 - 100.0%
Take-Profit Targets:
1) 82.44 - 50.0%
2) 93.69 - 50.0%
Stop Targets:
1) 67.45 - 100.0%
Trailing Configuration:
Stop: Breakeven -
Trigger: Target (1)
Published By: @TradingOn
CRYPTOCAP:SOL BINANCE:SOLUSDT.P #4h #Sol
Wave Analysis - SOLANA (8H)Just like on ETH, Solana is having difficult times during weekly wave 2.
What you see right now can be explained by two ways:
1- Larger outlook: Sol is simply in wave 2 phase for a weekly chart and its almost done.
2- Shorter outlook: Sol is creating an ABC correction for that weekly wave 2.
At the moment, SOL is in wave C and also inner wave 3 of this wave C.
I believe that we should see SOL around $88 soon enough.
The problematic part is that $88 won't be the last drop (probably).
$88 is i
SOLUSDT: Downtrend Accelerating - 75.60 in SightSolana continues to lose ground, and the latest price action suggests that sellers are becoming increasingly aggressive. After several failed recovery attempts, SOL has slipped toward 81, with little evidence of a meaningful bullish reversal.
On the 2H chart, price remains trapped inside a descending channel, with both EMAs sloping downward. The previous 82.8–85.5 support zone has turned into resistance, while repeated rejections near the channel's upper boundary confirm that sellers continue t